

Summary
A protocol for the use of reaction flow high performance liquid chromatography columns for methods employing post column derivatization (PCD) is presented.
Abstract
A protocol for the use of reaction flow high performance liquid chromatography columns for methods employing post column derivatization (PCD) is presented. A major difficulty in adapting PCD to modern HPLC systems and columns is the need for large volume reaction coils that enable reagent mixing and then the derivatization reaction to take place. This large post column dead volume leads to band broadening, which results in a loss of observed separation efficiency and indeed detection in sensitivity. In reaction flow post column derivatization (RF-PCD) the derivatization reagent(s) are pumped against the flow of mobile phase into either one or two of the outer ports of the reaction flow column where it is mixed with column effluent inside a frit housed within the column end fitting. This technique allows for more efficient mixing of the column effluent and derivatization reagent(s) meaning that the volume of the reaction loops can be minimized or even eliminated altogether. It has been found that RF-PCD methods perform better than conventional PCD methods in terms of observed separation efficiency and signal to noise ratio. A further advantage of RF-PCD techniques is the ability to monitor effluent coming from the central port in its underivatized state. RF-PCD has currently been trialed on a relatively small range of post column reactions, however, there is currently no reason to suggest that RF-PCD could not be adapted to any existing one or two component (as long as both reagents are added at the same time) post column derivatization reaction.
Introduction
High performance liquid chromatography (HPLC) coupled with post column derivatization (PCD) is a powerful tool that is useful in solving a number of issues in the analytical laboratory. It can be used to detect compounds that are otherwise undetectable with the suite of detectors available1,2, increase the signal of the target analyte, which allows lower limits of detection and quantitation3-5 or selectively derivatize a target analyte in order to avoid matrix effects6. Commonly used PCD reactions include the reaction of amines, such as amino acids, with ortho-phthaladehyde7-9, ninhydrin9,10 or fluorescamine11,12, the derivatization of reactive oxygen species (ROS) with the 2,2-diphenyl-1-picrylhydrazil radical (DPPH•)13,14 or 2,2'-azino-bis(3-ethylbenzothiazoline-6-sulphonic acid (ABTS)15,16, and the use of the iodide-azide reagent to derivatize sulfur containing compounds17,18.
There are, however, numerous drawbacks to the use of PCD reactions with HPLC systems6. Principally among these is the use of reaction coils between the point of addition of the derivatization reagent(s) and the detector, which allow time for mixing and the reaction to occur8. These reaction loops often have volumes of 500 µl or more, which is significant compared to the volume of the rest of the HPLC system19. The use of these high volume reaction loops results in increased peak broadening compared to what would be observed without the presence of the reaction loop. This results in shorter, wider peaks that have higher limits of quantitation and detection and negatively effects chromatographic resolution. Figures 1 and 2 highlight the deterioration of peak shape that result from the addition of various post column reaction loop volumes. This analysis was performed with a mobile phase composition of 94% methanol and 6% Milli-Q water. The flow rate of the mobile phase was 1 ml/min, the injection volume was 20 µl and the analysis wavelength was 265 nm. Coils of varying dead volumes from 20 µl to 1,000 µl were inserted between the column and the detector to simulate the effects of reaction loop dead volume in PCD methods. These loops were prepared from stainless steel tubing of 0.5 mm internal diameter. The experiment was performed on a HPLC system consisting of a controller (SCL-10AVP), a Low Pressure Gradient Valve (FCL-10ALVP), a Pump (LC-20AD), an Injector (SIL-10ADVP), and a pda detector (SPD-M10ADVP). The mobile phase was pumped through a degasser prior to introduction into the HPLC system. The separation was performed using a 250 mm x 4.6 mm i.d. 5 µm column. Experimental conditions were chosen to be typical of PCD reactions that have recently been published in the literature.
The simplest, most common post column reactor setup is termed a non-segmented tubular reactor which is effectively a long, thin tube through which the liquid can flow and the reaction can take place. In this system peak broadening is dependent on not just the dead volume added to the system, but also the internal diameter of the tube as highlighted by Iijima et al.8. Furthermore, coil geometry plays a part in the observed brand broadening. Stewart 20 stated that coiling of the reactor changes the secondary flow profiles, resulting in better mixing, meaning that the dead volume may be minimized. It has been stated that peak broadening is not significant when using an open tubular knitted coil 21 . When the peak broadening is excessively large, other types of reactors may also be considered 20,22. These may include bed reactors or segmented flow reactors. These reactors are particularly useful for slow reactions that would otherwise require large reaction loops. As non-segmented tubular reactors are the most common types of reactors used in PCD applications, the rest of this article deals with this type of reactor setup.
The design of the reaction flow (RF) column incorporates a multi-port end fitting that allows mobile phase to exit (or enter) the column through either a single port located at the radial central region of the column or three ports located at the outer wall region of the column (see Figure 3). These two streams are separated using an end fitting containing a central porous frit that is surrounded by an impermeable ring that is in turn surrounded by an outer porous frit that extends out to the column wall. Due to the central impermeable ring cross flow is not possible between the two porous regions.
During reaction flow chromatography, the derivatization reagent(s) are pumped against the direction of mobile phase flow into one or two of the outer ports of the reaction flow column. The column eluent is mixed with the derivatization reagent(s) in the outer frit and passed to the detector through a free outer port. Reaction flow can be used for either a single reagent derivatization (1 port for the derivatization reagent, 1 port to pass the column eluent to the detector and 1 port blocked) or a dual reagent system (2 ports for the derivatization reagents and 1 port to pass the column eluent to the detector). The flow from the central stream can either be used to detect the underivatized column eluent, effectively multiplexing detection23, or passed to waste.
One major tuning technique that is available when running RF-PCD chromatography is the ratio of the central and peripheral flows. The optimum ratio for each derivatization depends on a number of factors such as whether the central flow will be detected or passed to waste. Therefore once the optimum ratio has been determined, it should be ensured that the correct flow ratio is achieved prior to each run being performed.
It has been found that the use of a frit to mix the column eluent stream and the derivatization reagent in RF-PCD results in more efficient mixing compared with traditional mixing techniques that typically employ a zero dead volume T-piece or low dead volume W-piece to mix the two streams. This has allowed for the use of relatively small reaction loops, or even the elimination of the reaction loop altogether. The reduction of the reaction loop size results in sharper peaks compared to traditional post column derivatization methods. This means that, despite the fact that not all of the column eluent is derivatized, greater signal to noise ratios are observed and therefore lower limits of detection and quantitation can be achieved.
Reaction flow chromatography has been developed to overcome difficulties with the adaption of PCD reactions to modern HPLC columns and systems, particularly the loss in efficiency caused by band broadening due to large post column dead volumes caused by the need to employ large volume reaction loops. The more efficient mixing processes in RF-PCD compared to conventional PCD mean that smaller reaction loop volumes may be employed leading to an increase in observed separation efficiency. Furthermore RF-PCD chromatography shows both increased signal and decreased noise compared to conventional PCD techniques resulting in lower limits of detection and quantitation compared to conventional PCD methods. An additional advantage of RF-PCD compared to conventional PCD methods is the ability to monitor the underivatized stream that elutes from the central port of the RF column as well as the derivatized stream that elutes from the peripheral region of the column. RF-PCD is a relatively new but promising technique that displays many advantages over traditional PCD methods.
Connection of the RF column is achieved in almost the same way as a conventional HPLC column with the major difference being the number of end fittings on a RF column. Fittings used to connect a standard HPLC column to the HPLC system are able to be used to connect a RF column to the HPLC system.
Subscription Required. Please recommend JoVE to your librarian.
Protocol
Caution: Please refer to material safety data sheets (MSDS) for all materials and reagents before use (i.e., MSDS for methanol). Ensure the use of all appropriate safety practices when handling solvents and High Performance Liquid Chromatography (HPLC) eluent. Ensure appropriate use of engineering controls of HPLC, analytical balance and detector instrumentation, and ensure the use of personal protective equipment (safety glasses, gloves, lab coat, full length pants, and closed-toe shoes).
Note: This protocol describes 3 methods of reaction flow post-column derivatization (RF-PCD) techniques, each with a different reagent specific to the nature of a chemical compound of interest. For the analysis of ROS go to section "1. Detection of ROS using DPPH•", for the analysis of primary amines see section "2. Detection of primary amines using fluorescamine", and for the analysis of phenolic compounds go to section "3. Detection of phenols using 4-aminoantipyrene and potassium ferricyanide". Use ultra-pure water (e.g., Milli-Q water) throughout.
Note: Connection of the RF column is achieved in almost the same way as a conventional HPLC column with the major difference being the number of end fittings on a RF column. Fittings used to connect a standard HPLC column to the HPLC system are able to be used to connect a RF column to the HPLC system.
1. Detection of ROS Using DPPH•
- Set up of HPLC instrument
- Prepare the HPLC instrument with 100% water on line A and 100% methanol on line B as the mobile phase. Purge the pumps as per manufacturer's requirements.
- Set up the HPLC instrumental components and the additional derivatization pump as illustrated in Figure 4A.
- Set the UV-Vis detector to analyze at a wavelength of 520 nm.
- Set up of RF column
- Connect the inlet of the RF column to the HPLC instrument.
- Connect a 15 cm length of 0.13 mm i.d. tubing to outlet central port of the RF column.
- Connect an outlet peripheral port to the UV-Vis detector using a 15 cm length of 0.13 mm i.d. tubing.
- Connect the DPPH• pump line to a peripheral port on the outlet of the RF column.
- Block the unused peripheral port on the outlet of the RF column using a column stopper.
- Bring the flow rate of the HPLC pump to 1 ml min-1 at 100% line B - 100% Methanol.
- Equilibrate the column with the 100 % methanol mobile phase for 10 min for a 4.6 mm i.d. x 100 mm length column. This time should be scaled according to the dimensions of other columns the user may employ.
- Preparation of DPPH• reagent
- Prepare a 0.1 mg/ml solution of DPPH• in methanol.
- Sonicate the flask containing the DPPH• reagent for 10 min.
- Cover the flask in foil to prevent exposure to light.
- Purge the DPPH• pump with the prepared DPPH• reagent as per the manufacturer's requirements.
- Tuning the RF column outlet
- Accurately weigh two clean and dry vessels. Label one vessel as central and the other as peripheral.
- Collect the effluent exiting the central port into the vessel labeled central for 1.0 min.
- Re-weigh the central port vessel and calculate the weight of the flow from the central port as follows:
Weight of Central Port (g) = Final Weight of Central Port Vessel (g) - Initial Weight of Central Port Vessel (g) - Repeat steps 1.4.2 and 1.4.3 for the effluent exiting the UV-Vis that is attached to the peripheral port of the RF column and calculate weight for the peripheral port vessel as follows:
Weight of Peripheral Port (g) = Final Weight of Peripheral Port Vessel (g) - Initial Weight of Peripheral Port Vessel (g) - Calculate the percentage of the flow coming from the central and peripheral ports as follows:
% Central Port = Weight of Central Port (g) / (Weight of Central Port (g) + Weight of Peripheral Port (g)) x 100
% Peripheral Port = Weight of Peripheral Port (g) / (Weight of Central Port (g) + Weight of Peripheral Port (g)) x 100 - Ensure the segmentation ratio between the central flow and the peripheral flow is 30:70 (central:peripheral). If the central flow is above 30%, decrease the amount of flow exiting by adding a length of 0.13 mm i.d. tubing to the outlet of the central port. If the central flow is below 30% decrease the length of 0.13 mm tubing from the central port.
- Repeat step 1.4.1 to 1.4.6 until a segmentation ratio of 30:70 (central:peripheral) is achieved.
- Set the flow rate of the DPPH• reagent pump to 0.5 ml min-1.
Note: The RF column set up with DPPH• reagent is now ready for analysis. Samples may now be injected.
- Post run shutdown conditions
- Once all of the samples have been injected, indicating that the run has finished, stop the derivatization reagent pump flow.
- Remove the DPPH• reagent pump line from the peripheral port and stopper the port.
- Equilibrate the column with the mobile phase in which it is to be stored by allowing the mobile phase to pass through the column at 1 ml min-1 for 10 min.
- Stop the flow of the mobile phase pump on the HPLC instrument.
- Replace the DPPH• reagent with methanol and purge the additional pump.
Note: The HPLC system can now be shutdown.
2. Detection of Primary Amines Using Fluorescamine
- Preparation of mobile phase
- Prepare 1 L of a of 10 mM ammonium acetate solution, adjusting the pH of the solution to 9.0 with 5 M ammonium hydroxide prior to dilution to volume.
- Add 52.6 ml of acetonitrile (ACN) to the ammonium acetate buffer to attain a premixed mobile phase of 95:05 (buffer:ACN).
- Set up of HPLC instrument
- Prepare the HPLC instrument with the pre-mixed prepared buffer on line A as the mobile phase. Purge the pump as per manufacturer's requirements.
- Set up the HPLC instrumental components and the additional derivatization pump as illustrated in Figure 4A.
- Attach a pulse dampener coil to the derivatization pump.
- Set-up the fluorescence detector (FLD) with an excitation wavelength of 390 nm and emission wavelength of 475 nm.
- Set up of RF column
- Connect the inlet of the RF column to the HPLC instrument.
- Connect a 15 cm length of 0.13 mm i.d. tubing to outlet central port of the RF column.
- Connect an outlet peripheral port of the RF column to the FLD detector using a 15 cm length of 0.13 mm i.d. tubing.
- Connect the derivatization pump line to a peripheral port on the outlet of the RF column.
- Block the unused peripheral port on the outlet of the RF column using a column stopper.
- Bring the flow rate of the HPLC pump to 1 ml min-1 at 100% line A - 10 mM Ammonium Acetate buffer pH 9, premixed with 5% ACN.
- Equilibrate the column with the 100 % line A mobile phase for 10 min for a 4.6 mm i.d. x 100 mm length column. This time may be scaled according to the dimensions of other columns the user may employ.
- Preparation of fluorescamine reagent
- Make 100 ml of a 0.1 mg ml-1 fluorescamine reagent.
- Sonicate for 1 min.
- Cover with foil to prevent exposure to light.
- Purge the reagent pump with the prepared fluorescamine reagent as per the manufacturer's requirements.
- Tuning the RF column outlet
- Accurately weigh two clean and dry vessels. Label one vessel as central and the other as peripheral.
- Collect the effluent exiting the central port into the vessel labeled central for 1.0 min.
- Re-weigh the central vessel and calculate the weight of the flow from the central port as follows in step 1.4.3.
- Repeat steps 2.5.2 to 2.5.3 for the effluent exiting the FLD that is attached to the peripheral port of the RF column and calculate weight for peripheral as follows in step 1.4.4.
- Calculate the percentage of the flow coming from the central and peripheral ports as follows in step 1.4.5.
- Ensure the segmentation ratio between the central flow and the peripheral flow is 43:57 (central:peripheral). If the central flow is above 43%, decrease the amount of flow exiting by adding a length of 0.13 mm i.d. tubing to the outlet of the central port. If the central flow is below 43%, decrease the length of 0.13 mm tubing from the central port.
- Repeat step 2.5.1 to 2.5.6 until a segmentation ratio of 43:57 (central:peripheral) is achieved.
- Set the flow rate of the mobile phase pump to 0.7 ml min-1.
- Set the derivatization pump to flow at 0.1 ml min-1.
Note: The RF column set up with fluorescamine reagent is now ready for analysis. Samples may now be injected.
- Post run shutdown conditions
- Once all of the samples have been injected, indicating that the run has finished, stop the derivatization pump.
- Remove the derivatization pump line from the peripheral port and stopper.
- Equilibrate the column with the mobile phase in which it is to be stored by allowing the mobile phase to pass through the column at 1 ml min-1 for 10 min.
- Stop the flow of the mobile phase pump.
- Replace the fluorescamine reagent with acetonitrile and purge the derivatization pump.
Note: The HPLC system can now be shutdown.
3. Detection of Phenols Using 4-Aminoantipyrene and Potassium Ferricyanide
- Preparation of mobile phase
- Prepare 1 L of a of 100 mM ammonium acetate solution, adjusting the pH of the solution to 9.0 with 5 M ammonium hydroxide prior to dilution to volume.
- Add 52.6 ml of methanol to the ammonium acetate buffer to attain a premixed mobile phase of 95:5 (buffer:methanol).
- Set up of HPLC instrument
- Prepare the HPLC instrument with the pre-mixed prepared buffer on line A as the mobile phase. Purge the pump as per manufacturer's requirements.
- Set up the HPLC instrumental components and the two additional reagent pumps as illustrated in Figure 4B.
- Attach a pulse dampener coil to each of the reagent pumps.
- Set the UV-Vis detector to analyze at a wavelength of 500 nm.
- Set up of RF column
- Connect the inlet of the RF column to the HPLC instrument.
- Connect a 15 cm length of 0.13 mm i.d. tubing to outlet central port of the RF column.
- Connect an outlet peripheral port of the RF column to the UV-Vis detector using a 15 cm length of 0.13 mm i.d. tubing.
- Connect each reagent (i.e., 4-aminoantipyrene and potassium ferricyanide) pump line to a peripheral port on the outlet of the RF column.
- Bring the flow rate of the HPLC pump to 1 ml min-1 at 100% line A - 100 mM Ammonium Acetate buffer pH 9, premixed with 5% methanol.
- Equilibrate the column with the 100 % line A mobile phase for 10 min for a 4.6 mm i.d. x 100 mm length column. This time may be scaled according to the dimensions of other columns the user may employ.
- Preparation of 4-aminoantipyrene reagent
- Prepare an ammonium acetate buffer with a pH of 9 by following step 3.1.1.
- Weigh 150 mg 4-aminoantipyrene and dissolve in 100 ml of prepared ammonium acetate buffer (pH 9).
- Sonicate for 1 min.
- Cover with foil to prevent exposure to light.
- Purge the first reagent pump with the prepared 4-aminoantipyrene reagent as per the manufacturer's requirements.
- Preparation of potassium ferricyanide reagent
- Weigh 150 mg of potassium ferricyanide and dissolve in 100 ml of ammonium acetate buffer (pH 9) prepared as per step 3.1.1.
- Sonicate for 1 min.
- Cover in foil to prevent exposure to light.
- Purge the second reagent pump with the prepared potassium ferricyanide reagent as per the manufacturer's requirements.
- Tuning of RF column
- Accurately weigh two clean and dry vessels. Label one vessel as central and the other as peripheral.
- Collect the effluent exiting the central port into the vessel labeled central for 1.0 min.
- Re-weigh the central vessel and calculate the weight of the flow from the central port as follows in step 1.4.3.
- Repeat steps 3.6.2 to 3.6.3 for the effluent exiting the UV-Vis that is attached to the peripheral port of the RF column and calculate weight for peripheral as follows in step 1.4.4.
- Calculate the percentage of the flow coming from the central and peripheral ports as follows in step 1.4.5.
- Ensure the segmentation ratio between the central flow and the peripheral flow is 50:50 (central:peripheral). If the central flow is above 50%, decrease the amount of flow exiting by adding a length of 0.13 mm i.d. tubing to the outlet central port. If the central flow is below 50%, decrease the length of 0.13 mm tubing from the central port.
- Repeat step 3.6.1 to 3.6.6 until a segmentation ratio of 50:50 (central:peripheral) is achieved.
- Set the flow rate of the 4-aminoantipyrene pump to 0.5 ml min-1.
- Set the flow rate of the potassium ferricyanide pump to 0.25 ml min-1.
Note: The RF column set up with the two-component reagents is now ready for analysis. Samples may now be injected.
- Post run shutdown conditions
- Once all of the samples have been injected the run has finished, indicating that the run has finished, stop both of the reagent pumps.
- Remove the reagent pump lines from the peripheral ports and replace them with a 15 cm piece of 0.13 mm tubing.
- Equilibrate the column with the mobile phase in which it is to be stored by allowing the mobile phase to pass through the column at 1 ml min-1 for 10 min.
- Stop the flow of the mobile phase pump on the HPLC instrument.
- Replace both the reagents on the reagent pumps with methanol and purge the additional pumps as per manufacturer requirement.
Note: The HPLC system can now be shutdown.
Subscription Required. Please recommend JoVE to your librarian.
Representative Results
The first PCD method that was adapted for use by RF-PCD was the derivatization of antioxidants using the 2,2-diphenyl-1-picrylhydrazil radical (DPPH•)24. This reaction was introduced by Koleva et al.25 and has been widely used since. The detection relies on the decolorization of the DPPH• radical in the presence of reactive oxygen species, hence the presence of antioxidants results in a drop in the observed absorbance. The DPPH• reaction often employs large reaction loops of 500 µl or more13-15, however it was found that when using the RF-PCD column no reaction loop was required. Figure 5 shows two chromatograms of a sample of Ristretto coffee derivatized using the DPPH• radical using both conventional PCD and RF-PCD instrumentation.
The second PCD method that has been adapted for use by RF-PCD is the derivatization of four amino acids (glycine, leucine, phenylalanine and tryptophan) using fluorescamine as the derivatization reagent23. The method was adapted from the work by Udenfriend et al.11 with the mobile phase composition, fluorescamine concentration and fluorescamine flow rate optimized for use with RF columns. The conventional method utilized a two-reagent derivatization system where pH 9.0 buffer was added to the effluent stream before the addition of the fluorescamine reagent, whilst the RF-PCD method utilized a mobile phase that was already buffered, thus only a single reagent derivatization system was needed. For this application the derivatized stream was analyzed at 390 nm using a UV-Visible detector, which corresponds to the excitation wavelength used for detection by fluorescence. The derivatized stream could be detected using a fluorescence detector, giving greater signal to noise and therefore lower limits of detection and quantitation, as per the work by Udenfriend et al.11. Furthermore, the eluent coming from the central port of the RF-PCD setup was monitored using a second UV-Visible detector.
The performance of the RF-PCD method for the derivatization of amino acids was compared to the conventional PCD method. Table 1 lists the calculated limits of quantitation and detection for each of the amino acids analyzed in both RF-PCD and conventional PCD modes. The limit of detection was defined to be the concentration where a signal to noise ratio of 2 was obtained while the limit of quantitation was defined to be the concentration where a signal to noise ratio of 10 was achieved. Figure 6 shows a chromatogram of the four amino acids analyzed using the conventional PCD method, the RF-PCD method and the underivatized stream from the RF-PCD method. Figure 7 is a comparison of the signals obtained for the peaks due to glycine and leucine using both the conventional PCD method and the RF-PCD method. Figure 8 compares the peak width of the tryptophan peak when analyzing using the conventional PCD method, the RF-PCD method and the underivatized stream from the RF-PCD method.
The final PCD method that has been adapted for use by RF-PCD26 is the derivatization of four phenols (phenol, 4-methoxyphenol, p-cresol and tocopherol). The method was adapted from work by Bigley and Grob27 with minor changes to optimize the method for use with RF columns. This work utilized a two-component derivatization reaction where solutions of both 4-amionantiprine and potassium ferricyanide were added to the column eluent at the end fitting of the RF column. It was found that when using an RF column for the reaction no additional post column reaction loops needed to be used. Figure 9 shows an example of a chromatogram where a 21-component test sample that contained some components that show a response to the derivatization scheme and some that do not, were separated, derivatized and detected (black trace). The same mixture was also separated and detected underivatized for comparison (red trace). In Figure 9 the RF-PCD response has been displayed as a negative response for easier visual distinction (the detector response obtained was positive). Figure 10 shows a comparison of the peak shape of p-cresol both derivatized using the RF-PCD column and underivatized.
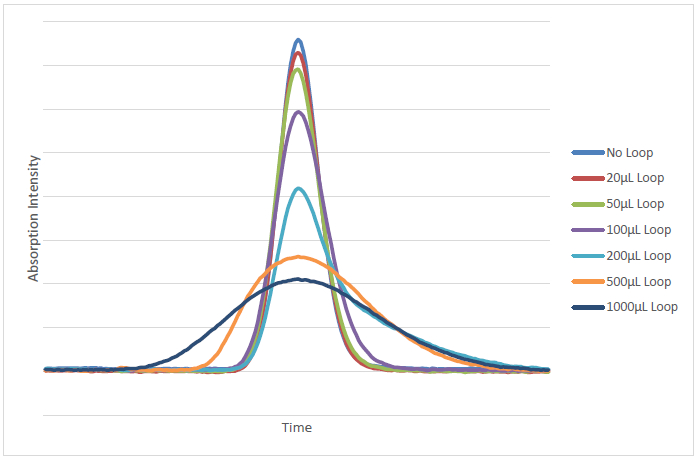
Figure 1. Chromatographic overlay of hexylbenzene injected on a HPLC system with various dead volumes added between the column and the detector. Please click here to view a larger version of this figure.

Figure 2. Chromatographic overlay of toluene, ethylbenzene and propylbenzene injected on a HPLC system with various dead volumes added between the column and the detector. Please click here to view a larger version of this figure.

Figure 3. Illustration of Reaction Flow column design. Please click here to view a larger version of this figure.

Figure 4. Instrumental set up of RF-PCD. (A) single reagent (i.e., DPPH• or fluorescamine derivatization reagents) and (B) dual reagent (i.e., 4-aminoantipyrene and potassium ferricyanide derivatization reagents). Please click here to view a larger version of this figure.

Figure 5. Chromatograms of the separation of Ristretto coffee with detection after post column derivatization using the 2,2-diphenyl-1-picrylhydrazil radical (DPPH•). The derivatization was performed using a conventional column with a 500 µl reaction coil (A) and a reaction flow column (B). Please click here to view a larger version of this figure.

Figure 6. Chromatographic overlay of four amino acids (glycine (G), leucine (L), phenylalanine (P) and tryptophan (T)) over the range of 10 to 1,000 ppm detected by post column derivatization using fluorescamine as a PCD reagent after separation by HPLC. The chromatograms are as follows: (A) conventional PCD, (B) RF-PCD, and (C) central (underivatized) port from RF-PCD. Please click here to view a larger version of this figure.

Figure 7. Comparison of the signals obtained for glycine (first peak) and leucine (second peak) from conventional PCD (red trace) and RF-PCD (black trace). Please click here to view a larger version of this figure.

Figure 8. Peak width comparison of the peak due to tryptophan based on (A) retention time and (B) peak volume. The black trace shows the conventional PCD method, the red trace shows the RF-PCD method and the green trace shows the underivatized stream from the central port of the RF-PCD method. Please click here to view a larger version of this figure.

Figure 9. Chromatographic separation of an artificial sample. The components include phenol (P), 4-methoxyphenol (M), p-cresol (C) and tocopherol (T) as well as numerous alkylbenzenes, polynuclear aromatic hydrocarbons, anisole, phentanole, caffeine, phenylalanine and benzamide. The peaks labeled i, ii and iii are alkylbenzenes that unexpectedly responded to the derivatization scheme. The black trace represents the underivatized response using a UV detector at 254 nm while the red trace represents the derivatized response at 500 nm. Note for visual clarity the derivatized response has been inverted. Please click here to view a larger version of this figure.

Figure 10. Chromatographic response of p-cresol. The black trace represents the underivatized response using a UV detector at 254 nm while the red trace represents the derivatized (RF-PCD) response at 500 nm. Please click here to view a larger version of this figure.
| Reaction type | Glycine | Leucine | Phenylalanine | Tryptophan | ||||
| LOD (ppm) | LOQ (ppm) | LOD (ppm) | LOQ (ppm) | LOD (ppm) | LOQ (ppm) | LOD (ppm) | LOQ (ppm) | |
| RF-PCD | 6 | 25 | 10 | 100 | 25 | 250 | 50 | 250 |
| RF-PCD central port (underivatized) | Not Detected | Not Detected | Not Detected | 1 | 10 | |||
| Conventional PCD | 10 | 100 | 50 | 500 | 50 | 500 | 100 | 500 |
Table 1. Limits of detection and quantitation of four different amino acids detected by different post column derivatization systems using fluorescamine as the derivatization reagent after separation by HPLC.
Subscription Required. Please recommend JoVE to your librarian.
Discussion
RF-PCD allows for the efficient mixing of the derivatization reagent with the HPLC effluent post-column without the use of reaction coils, minimizing the effects of band broadening and improving separation performance. RF-PCD methods have also shown improvements in signal response with respect to detection method. Camenzuli et al.28 was the first to report the use of reaction flow columns with DPPH• for the detection of ROS in an espresso coffee sample. Their study involved the analysis and optimization of RF conditions to attain maximum performance, testing a range of DPPH• concentrations with various DPPH• reagent flow rates. It was concluded that a DPPH• concentration of 0.1 mg ml-1 with a DPPH• reagent flow rate of 0.5 ml min-1 was optimal for an improved separation performance (i.e., efficiency and sensitivity) under RF-PCD conditions compared to the conventional PCD method of DPPH• derivatization. Figure 5 shows two chromatograms utilizing the DPPH• assay of antioxidants in an espresso coffee sample. Especially interesting are the high intensity peaks with retention times of approximately 5 min. It can be seen that when using a 500 µl reaction loop, which is typical of traditional DPPH• derivatization methods, a single, broad peak can be observed. However, when the RF-PCD method is used without the need for a reaction loop, it becomes clear that the single peak observed using a 500 µl loop is in fact two peaks. Furthermore, additional detail can be seen after 5.5 min when using the RF-PCD setup. Thus, for the analysis of ROS in samples using DPPH•, the technique of RF-PCD proved to be superior to the conventional methods of ROS analysis using DPPH•.
RF-PCD with fluorescamine reagent has been utilized for the analysis of primary amino acids and compared to the conventional forms of PCD with fluorescamine20. Since the RF column end-fitting also provided a platform for multiplexed detection, the underivatized central flow was monitored via UV-Vis, while the derivatization between effluent and fluorescamine was undertaken in the outer region of the RF end-fitting and detected via UV-Vis. A series of test standards containing four amino acids were analyzed under multiplexed RF-PCD conditions. Figure 6 compares the chromatographic profile for the conventional method of PCD (Figure 6A) and RF-PCD (detection of derivatized (Figure 6B) and underivatized (Figure 6C)) of the series of amino acids. Figure 7 is an overlay of two amino acids signals obtained through conventional PCD and RF-PCD. It can be seen that the more efficient observed separation due to the removal of the reaction loop has led to greater signal response, despite the fact that not all of the column effluent was derivatized. Furthermore, the more efficient derivatization reagent mixing scheme resulted in lower baseline noise, further increasing the signal to noise ratio. This effect is borne out in the lower limits of detection and quantitation calculated for the RF-PCD method compared to the conventional PCD method in Table 1. This trend can also be seen in Figure 5 where the antioxidant response to DPPH• is greater for the RF-PCD method compared to the conventional PCD method. Significant peak deterioration can be observed in the chromatograms where a conventional PCD setup was used which leads to the lower signal response of this method.
Figure 8 compares the peak profile of tryptophan when analyzed by RF-PCD (both derivatized and underivatized streams) and conventional PCD. When the peak profile is plotted against time the peak widths all appear to be broadly similar (Figure 8A). The improvements found in RF-PCD compared to conventional PCD are obvious when the peak profile is plotted against peak volume (Figure 8B). When plotted against peak volume, it is clear that while the RF-PCD peak shows a small amount of degradation compared to the underivatized peak, the degradation, however, is minimal compared to that observed from the conventional PCD method. The improvements in separation efficiency of RF-PCD compared to conventional PCD are also demonstrated in Figure 7 which compares the peak shapes of glycine and leucine after derivatization by both conventional PCD and RF-PCD. It can be seen that in conventional PCD mode the glycine and leucine peaks are barely baseline separated while in RF-PCD mode the signal is at baseline for a much longer period between the two peaks.
An additional benefit of RF-PCD compared to conventional PCD methods is the ability to monitor underivatized effluent from the central port of the RF column enabling multiplexed detection. This is possible as the design of the frit within the RF end fitting does not allow the flow in the radial central region to mix with the flow in the peripheral region of the end fitting, thus enabling monitoring of the derivatized stream from the outer region of the fitting as well as monitoring of the underivatized stream from the central port. This ability is highlighted by the results obtained for tryptophan in Table 1, which is known to have poor signal response after derivatization by fluorescamine20, however, unlike the other amino acids it shows a response to a UV detector when underivatized (at 280 nm). For both derivatization systems the limits of detection and quantitation were relatively high, however the limits of detection and quantitation were much lower for the underivatized stream. Using the ability to monitor both derivatized and underivatized effluent streams the detection parameters may be optimized to give the greatest level of performance for each amino acid.
The multiport design of the RF end-fitting allows for dual derivatization reagent analysis. Selim et al.23 investigated the performance of two reagents (4-aminoantipyrene and potassium ferricyanide) using RF-PCD conditions for the analysis of phenolic compounds compared to the conventional technique of PCD using 4-aminoantipyrene and potassium ferricyanide. This type of PCD technique requires two pumps and reaction loops for each derivatization reagent as opposed to one pump and reaction loop for DPPH•. Various phenolic and alkylbenzene compounds were analyzed under conventional and RF PCD conditions. Interestingly, non-phenolic compounds that were not detected under the conventional method were in fact detected under RF-PCD conditions. Figure 9 shows the UV-Vis chromatographic response and the RF-PCD colorimetric response to a standard test mix. RF-PCD provided a simplified PCD technique in terms of instrumentation, without compromise of separation performance as observed in Figure 10. Figure 10 compares the peak profile of p-cresol when analyzed by RF-PCD and also without derivatization. It can be seen that the peak width of the RF-PCD chromatogram is very similar to that of the underivatized chromatogram. The major difference between the two chromatograms is that the RF-PCD chromatogram is slightly wider at the base. This shows that there is little to no peak dispersion due to the RF-PCD technique. A similar response was observed in Figure 9 which shows that it is not only the p-cresol peak that has similar peak width when derivatized by RF-PCD compared to its underivatized peak, but all the phenols and alkylbenzenes that responded to the derivatization scheme showed this same trend. Although, RF-PCD with the use of two derivatization reagents obtained a similar separation performance to the conventional non-derivatization method, the RF-PCD allowed for the selective detection of phenolic compounds, one of which that was not detected under non-derivatized conditions.
As RF-PCD is a development of conventional HPLC-PCD methods, all of the tuning tools available in general HPLC methods such as mobile phase composition and flow rate, injection volume and analysis wavelength are applicable to RF-PCD methods. Furthermore, tuning tools available in conventional HPLC-PCD methods, such as the mobile phase to PCD reagent flow rate ratio as well as the PCD reagent composition are applicable to RF-PCD methods. An additional tuning tool available when using RF-PCD that is not available in conventional PCD methods is the ratio of flows coming from the central and peripheral ports of the column. The flows are controlled by altering the relative back pressure on each of the lines by controlling the length and/or internal diameter of the post detector (or post column if the flow coming from the central port is not being detected) tubing. The optimal ratio of the central to peripheral flows is dependent on the reaction in question, as well as other factors, such as, whether the central port is being detected or not. A flow ratio of 60% peripheral and 40% central is often a good starting point.
As with the tuning parameters, many of the issues that can arise with the use of the RF-PCD column are also common with conventional PCD methods. One particular parameter that the chromatographer has to be aware of when performing RF-PCD analyses is the stability of the flow and pressure in the system, particularly that of the reagent pump(s). If the flow in the system is not stable, it can cause baseline instability therefore decreasing the signal to noise ratio and subsequently limits of quantitation and detection.
RF-PCD chromatography has been developed to overcome difficulties in adapting PCD reactions to modern HPLC columns and systems. The major advantage of RF-PCD compared with conventional PCD methods is more efficient mixing due to it taking place inside a frit within the end fitting of the RF column, and this mixing is at a slightly higher back pressure. This allows for the minimization or even elimination of the large volume reaction loops that are used in many conventional PCD methods. With this minimization of post column dead volume, more efficient separations with greater chromatographic resolution can be performed.
RF-PCD mode has resulted in improvements in separation efficiency, peak shape and signal to noise compared to conventional PCD methods. However, it is important to note that signal improvements are detector dependent. For example detectors that sample amount dependent may not exhibit an increase in signal response under RF-PCD conditions compared to conventional methods. This is so because under conventional methods 100% of on column sample is detected, where under RF-PCD conditions only a certain percentage of the on column sample is detected depending on the segmentation ratio. It is however, anticipated that RF-PCD reactions will be able to be adapted to any one or two reagent (as long as both reagents are added at the same time) PCD reaction with minimal re-optimization and that the benefits observed for all three reactions so far tested will translate to all other PCD reactions.
Subscription Required. Please recommend JoVE to your librarian.
Disclosures
The authors have nothing to disclose.
Acknowledgments
This work was supported by UWS and ThermoFisher Scientific. One of the authors (DK) acknowledges the receipt of an Australian Postgraduate Award.
Materials
| Name | Company | Catalog Number | Comments |
| HPLC instrument | Agilent | 1290 Series HPLC | |
| Additional Pump(s) for derivatization system | Shimadzu | LC-20A | |
| RF colum | Non-commercial | ||
| PEEK tubing | Sigma Aldrich | Z227307 | |
| Column stoppers | Provided with column | ||
| PEEK tube cutter | Sigma Aldrich | Z290882 | |
| Analytical Scale Balance | 4-point analytical balance | ||
| Stop watch | Non-Scientific equiptment | ||
| Eluent collection vials | Any Small vial with a flat bottom will do, e.g., HPLC vials | ||
| HPLC Vials | Will depend on instrument used | ||
| Vessels for mobile phase and derivatization solution(s) | Sigma Aldrich | Z232211 | |
| General Laboratory glassware | Volumetric Flasks, pippettes, etc. Quantity and volumes will depend on sample preparation method. | ||
| Methanol | Sigma Aldrich | 34860 | |
| DPPH | Sigma Aldrich | D9132 | |
| Ammonium Acetate | Sigma Aldrich | 17836 | |
| Ammonia | Sigma Aldrich | 320145 | Corrosive |
| Acetonitrile | Sigma Aldrich | 34998 | |
| Fluorescamine | Sigma Aldrich | F9015 | |
| 4-aminoantipyrene | Acros Organics BVBA | AC103151000 | |
| Potassium ferricyanide | AnalaR | B10204-30 |
References
- Srijaranai, S., et al. Use of 1-(2-pyridylazo)-2-naphthol as the post column reagent for ion exchange chromatography of heavy metals in environmental samples. Microchem. J. 99, 152-158 (2011).
- Kubickova, A., Kubicek, V., Coufal, P. UV-VIS detection of amino acids in liquid chromatography: online post-column solid-state derivatization with Cu(II) ions. J Sep Sci. 34, 3131-3135 (2011).
- Quinto, M., Spadaccino, G., Palermo, C., Centonze, D. Determination of aflatoxins in cereal flours by solid-phase microextraction coupled with liquid chromatography and post-column photochemical derivatization-fluorescence detection. J. Chromatogr. A. 1216, 8636-8641 (2009).
- Lee, M., Lee, Y., Soltermann, F., von Gunten, U. Analysis of N-nitrosamines and other nitro(so) compounds in water by high-performance liquid chromatography with post-column UV photolysis/Griess reaction. Water Res. 47, 4893-4903 (2013).
- Niu, Y., et al. Identification of isoflavonoids in Radix Puerariae for quality control using on-line high performance liquid chromatography-diode array detector-electrospray ionization-mass spectrometry coupled with post-column derivatization. Food Res Int. 48, 528-537 (2012).
- Zacharis, C. K., Tzanavaras, P. D. Liquid chromatography coupled to on-line post column derivatization for the determination of organic compounds: a review on instrumentation and chemistries. Anal. Chim. Acta. 798, 1-24 (2013).
- Dousa, M., Brichac, J., Gibala, P., Lehnert, P. Rapid hydrophilic interaction chromatography determination of lysine in pharmaceutical preparations with fluorescence detection after postcolumn derivatization with o-phtaldialdehyde. J Pharm Biomed Anal. 54, 972-978 (2011).
- Iijima, S., et al. Optimization of an Online Post-Column Derivatization System for Ultra High-Performance Liquid Chromatography (UHPLC) and Its Applications to Analysis of Biogenic Amines. Anal Sci. 29, 539-545 (2013).
- Cunico, R. L., Schlabach, T. Comparison of Ninhydrin and o-Phthalaldehyde Postcolumn Detection Techniques for High Performance Liquid Chromatography of Free Amino. J. Chromatogr. A. 1983, 461-470 (1983).
- Donahue, E. P., Brown, L. L., Flakoll, P. J., Abumrad, N. N. Rapid Measurement of Leucine-specific Activity in Biological Fluids by Ion-exchange Chromatography and Post-column Ninhydrin Detection. J. Chromatogr. A. 571, 29-36 (1998).
- Udenfriend, S., et al. Fluorescamine: A Reagent for Assay of Amino Acids, Peptides, Proteins and Primary Amines in the Picomole Range. Science. 1972, 871-872 (1972).
- Samejima, K. Separation of Fluorescamine Derivitices of Aliphatic Diamines and Polyamines by High Speed Liquid Chromatography. J. Chromatogr. A. 96, 250-254 (1974).
- Zhang, Y., et al. Evaluation of antioxidant activity of ten compounds in different tea samples by means of an on-line HPLC-DPPH assay. Food Res Int. 53, 847-856 (2013).
- Niu, Y., et al. Identification of the anti-oxidants in Flos Chrysanthemi by HPLC-DAD-ESI/MS(n) and HPLC coupled with a post-column derivatisation system. Phytochem Anal. 24, 59-68 (2013).
- Raudonis, R., Bumblauskiene, L., Jakstas, V., Pukalskas, A., Janulis, V. Optimization and validation of post-column assay for screening of radical scavengers in herbal raw materials and herbal preparations. J. Chromatogr. A. 1217, 7690-7698 (2010).
- Raudonis, R., Raudone, L., Jakstas, V., Janulis, V. Comparative evaluation of post-column free radical scavenging and ferric reducing antioxidant power assays for screening of antioxidants in strawberries. J. Chromatogr. A. 1233, 8-15 (2012).
- Zakrzewski, R. Determination of Methimazole in Pharmaceutical Preparations using an HPLC Method Coupled with an Iodine-Azide Post-Column Reaction. J. Liq. Chrom. Rel. Technol. 32, 383-398 (2008).
- Zakrzewski, R. Development and validation of a reversed-phase HPLC method with post-column iodine-azide reaction for the determination of thioguanine. J. Anal. Chem. 64, 1235-1241 (2009).
- Gritti, F., Guiochon, G. Accurate measurements of the true column efficiency and of the instrument band broadening contributions in the presence of a chromatographic column. J. Chromatogr. A. 1327, 49-56 (2014).
- Stewart, J. T. Post cotumn derivatization methodology in high performance liquid chromatography (HPLC). Trends Anal. Chem. 1, 170-174 (1982).
- Rigas, P. G. Post-column labeling techniques in amino acid analysis by liquid chromatography. Anal. Bioanal. Chem. 405, 7957-7992 (2013).
- Frei, R. W. Reaction Detectors in Modern Liquid Chromatography. Chromatographia. 15, 161-166 (1982).
- Pravadil-Cekic, S., et al. Using Reaction Flow Chromatography for the Analysis of Amino Acid: Derivatisation With Fluorescamine Reagent. Microchem. J. , (Accepted Manuscript) (2015).
- Camenzuli, M., Ritchie, H. J., Dennis, G. R., Shalliker, R. A. Parallel segmented flow chromatography columns with multiplexed detection: An illustration using antioxidant screening of natural products. Microchem. J. 110, 726-730 (2013).
- Koleva, I. I., Niederlander, H. A. G., van Beek, T. A. An On-Line HPLC Method for Detection of Radical Scavenging Compounds in Complex Mixtures. Anal Chem. 72, 2323-2328 (2000).
- Selim, M., et al. A Two-component Post-column Derivatisation Method Utilsing Reaction Flow Chromatography. Microchem. J. 116, 87-91 (2014).
- Bigley, F. P., Grob, R. L. Determination of Phenols in Water and Wastewater by Post-column Reaction Detection High-performance Liquid Chromatography. J. Chromatogr. A. 350, 407-416 (1985).
- Camenzuli, M., Ritchie, H. J., Dennis, G. R., Shalliker, R. A. Reaction flow chromatography for rapid post column derivatisations: The analysis of antioxidants in natural products. J. Chromatogr. A. 1303, 62-65 (2013).
