We describe a histochemical procedure that reveals characteristic laminar and areal zinc staining patterns in different brain regions. The zinc-staining pattern may be used in conjunction with other anatomical markers to reliably distinguish layers and regions in the developing and adult brain.
A subscription to JoVE is required to view this content. Sign in or start your free trial.
Method Article
Use of Synaptic Zinc Histochemistry to Reveal Different Regions and Laminae in the Developing and Adult Brain
In This Article
Summary
Abstract
Characterization of anatomical and functional brain organization and development requires accurate identification of distinct neural circuits and regions in the immature and adult brain. Here we describe a zinc histochemical staining procedure that reveals differences in staining patterns among different layers and brain regions. Others have utilized this procedure not only to reveal the distribution of zinc-containing neurons and circuits in the brain, but also to successfully delineate areal and laminar boundaries in the developing and adult brain in several species. Here we illustrate this staining procedure with images from developing and adult ferret brains. We reveal a zinc-staining pattern that serves as an anatomical marker of areas and layers, and can be reliably used to distinguish visual cortical areas in the developing and adult visual cortex. The main goal of this protocol is to present a histochemical method that allows the accurate identification of layers and regions in the developing and adult brain where other methods fail to do so. Secondarily, in conjunction with densitometric image analysis, this method allows one to assess the distribution of synaptic zinc to reveal potential changes throughout development. This protocol describes in detail the reagents, tools, and steps necessary to successively stain frozen brain sections. Although this protocol is described using ferret brain tissue, it can easily be adapted for use in rodents, cats, or monkeys as well as in other brain regions.
Introduction
Histological stains have traditionally been used to aid in the identification of cortical areas in various species by revealing differences in architectonic features. The combined use of histochemical techniques such as for Nissl substance, cytochrome oxidase (CO) reactivity, or myelin can prove fruitful as they reveal similar areal boundaries in the adult brain. However, these histochemical stains do not always adequately reveal clear boundaries between cortical areas and layers in the immature brain.
In the central nervous system, zinc has several critical functions that include stabilizing DNA structure, acting as an enzyme cofactor, participating in numerous regulatory functions, and acting as a neuromodulator through its presence in synaptic vesicles1. Synaptic zinc is unique as it can be visualized using histological methods, whereas protein-bound zinc cannot be visualized2. This feature has been exploited to reveal the synaptic zinc pattern in different cortical regions, and synaptic zinc histochemistry has been used in a number of studies. A subset of glutamatergic neurons in the cerebral cortex contain zinc in the presynaptic vesicles within their axon terminals3,4. Histochemical studies have revealed a heterogeneous distribution of synaptic zinc in the cerebral cortex5,6,7. There appears to be a different areal and laminar distribution of histochemically reactive zinc in different cortical regions (e.g., visual versus somatosensory cortex), or layers (e.g., zinc levels in the supragranular and infragranular layers of primary visual cortex are substantially higher than in thalamocortical input layer IV with relatively low synaptic zinc levels)5,8,9. The heterogeneity in synaptic zinc staining observed in the cortex is especially advantageous as it facilitates areal and laminar identification.
Here we present a detailed description of a synaptic zinc histochemical procedure, which is a modified version of Danscher's 1982 method10. This method utilizes selenite injected intraperitoneally (IP) into animals as a chelating agent. The selenite travels to the brain to react with pools of free zinc found in vesicles of a subset of glutamatergic synapses in the brain. This reaction yields a precipitate that can be enhanced subsequently by silver development2,10,11.
This procedure reveals laminar and areal patterns of synaptic zinc staining; densitometric analysis may be used to assess these patterns both qualitatively and quantitatively in the adult and immature brain to study effects of other interventions, such as sensory, environmental, pharmacological, or genetic manipulations. Moreover, one may also want to assess potential developmental changes in the distribution of synaptic zinc in other cortical or subcortical structures in other model systems. The quantitative information that densitometric analysis provides in this method can be advantageous for following brain development over time. This protocol provides a companion to other immuno- and histochemical markers to reveal laminar and areal boundaries.
Access restricted. Please log in or start a trial to view this content.
Protocol
The following protocol follows the animal care guidelines established by the Institutional Animal Care and Use Committee (IACUC) at The City College of New York, which conform to all appropriate state and federal guidelines. Anesthesia is appropriate for ferrets, and should be modified according to species studied.
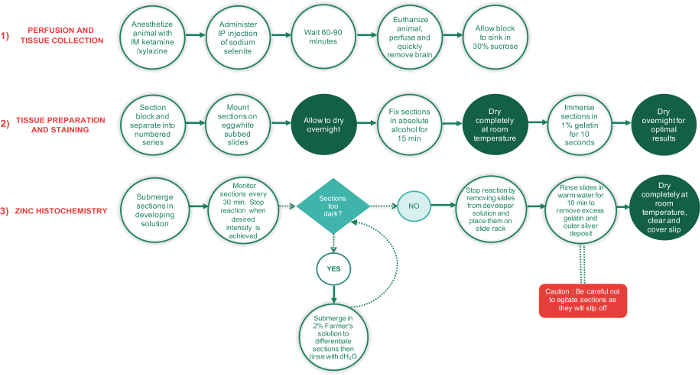
Figure 1: Flowchart outlining the major steps involved in the 3 phases of this protocol and the time required to complete each step. Periods requiring sections to dry completely are shown in green text circles, while all other steps are in white text circles. The green diamond-shaped text box is a decision point, while the red rectangle is a critical step and should be performed with extra care. Please click here to view a larger version of this figure.
1. Preparatory Steps (Slide Subbing and Solution Making)
- Wash unsubbed slides with a detergent in hot water and rinse several times in warm water followed with a distilled water rinse to thoroughly remove any dirt or debris. Allow slides to dry at room temperature or in an oven at 37 °C.
- Once slides are completely dry, layer a thin even coat of egg-white on each slide using fingers or a paintbrush. Allow to dry in the oven at 60 °C for 20 - 30 min. For optimal results and to avoid sections slipping off, add a second coat of egg white and allow to dry once more in the oven at 60 °C.
- Prepare a 1% gelatin solution by dissolving 1 gram of gelatin in 100 mL of hot water (60 °C) and allow it to cool to room temperature.
- Prepare 200 mL of developer solution as described below for use in section 4.
- Prepare gum Arabic solution by slowly adding 40 g in increments to 120 mL of hot water (it dissolves more easily this way). Continue to stir the solution with a glass stirring rod. Once the solution has completely dissolved, remove it from the heat and allow it to cool for a few min, then filter through 6 - 8 layers of gauze cloth in a funnel.
- Prepare citrate buffer by adding 5.04 g citric acid plus 4.7 g sodium citrate in 20 mL dH2O and dissolving the mixture. Ensure that the pH of this solution is 4.0 at 25 °C. Adjust the pH if necessary by adding sodium hydroxide or hydrochloric acid to the solution.
- Prepare the Hydroquinone solution by heating 30 mL dH2O and dissolving 1.7 g of Hydroquinone.
NOTE: Heating up the hydroquinone solution is essential to allow it to dissolve easily in water as hydroquinone is not readily dissolvable in water at room temperature. Be careful to keep the temperature of the water below 60 °C, otherwise hydroquinone may be oxidized. If the solution turns yellow, discard and prepare another fresh solution. - Prepare silver lactate solution by dissolving 0.22 g in 30 mL of dH2O.
- Mix the solutions (1.4.1 - 1.4.4) in the order in which they are described when ready to perform the reactions (i.e., after sectioning, drying, and fixing) (Figure 2). Add the silver lactate solution at the end. Ensure that this step is completed quickly and the developer solution is placed in the dark until it is time to react the sections as silver lactate is photosensitive.
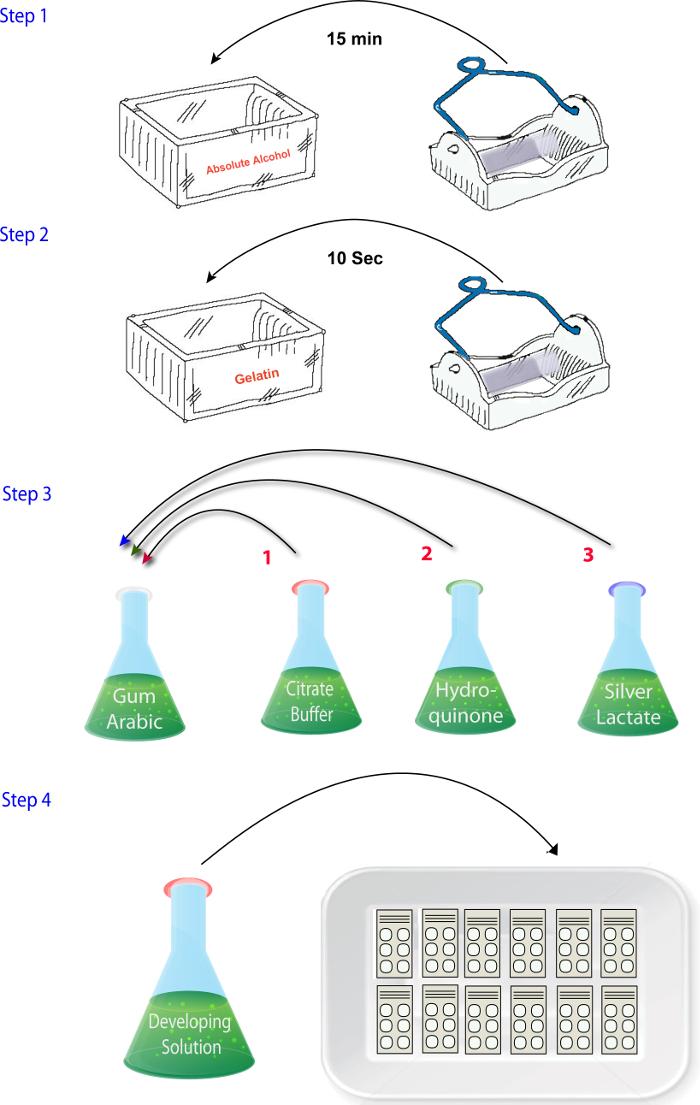
Figure 2: Schematic illustrating the sequence of steps involved in mixing the reagents in the zinc histochemistry phase of the protocol. Please click here to view a larger version of this figure.
2. Animal Treatment and Anesthesia
- Prior to sedating the animal, prepare a 1% sodium selenite (Na2SeO3) solution by dissolving 10 mg of sodium selenite in 1 mL dH2O.
- Anesthetize the animal with an intramuscular injection of ketamine (25 mg/kg) and xylazine (2 mg/kg).
NOTE: Ensure that an appropriate level of anesthesia is achieved by using the pedal reflex response. - Inject zinc chelator sodium selenite solution (15 mg/kg) intraperitoneally (IP).
NOTE: The toxicity of sodium selenite at different ages or in other species could vary. - Allow 60 to 90 min for the sodium selenite to travel to the brain. During this period, it is imperative to ensure that the animal is properly sedated and is unresponsive, so check depth of anesthesia every 5 min.
- During the selenite period, while the animal is anesthetized, ensure that the eyes are closed to prevent dryness, or administer ophthalmic ointment to keep them moist.
3. Tissue Preparation and Staining
- Euthanize the animal by administering an overdose of sodium pentobarbital (100 mg/kg, i.p).
- Perform transcardial perfusion with normal saline solution for 1 min, and with 4% paraformaldehyde for 20 min. Lastly, administer a solution with 4% paraformaldehyde and 10% sucrose (a total fixation period of 1 h).
- Remove the head using a pair of large shears.
- Make a midline incision using a scalpel from the nose to the neck to expose the skull.
- Carefully remove the brain and separate the hemispheres with a blade.
- Block the posterior part of the brain and postfix in 4% paraformaldehyde in 0.1 M phosphate buffer (PB) for several hours.
- Place the blocks into a 30% sucrose solution in 0.1 M PB and allow the brain to sink.
NOTE: Replacing the 4% paraformaldehyde and 30% sucrose solution with 30% sucrose solution in 0.1 M PB to sink the brain limits the brain's exposure to paraformaldehyde as this can affect tissue staining quality. - Once the brain sinks, cut semi-tangential 40 µm thick sections through the visual cortex or region of interest on a freezing, sliding microtome or cryostat. This can be accomplished by placing the block with the medial surface down and gently flattening with a glass slide.
- Collect sections with a paintbrush and store in a tackle box containing phosphate-buffered saline (PBS).
- Separate the sections into separate numbered series. Immediately mount one or two series of brain sections on egg-white subbed slides (section 1), allow to dry overnight at room temperature, and process sections histochemically for synaptic zinc.
NOTE: Other series may be processed for other markers for comparison, such as myelin12 or cytochrome oxidase using the modified protocol13: incubate for 2 - 8 h at 40 °C with 3% sucrose, 0.015% Cytochrome C, 0.015% catalase, and 0.02 % diaminobenzidine in 0.1 M PB. Nissl substance may also be used as a histological marker for distinguishing visual cortical areas. These other histological stains do not require that brain sections are mounted on egg-white subbed slides, so the traditional gelatin coated slides may be used instead.
4. Synaptic Zinc Histochemistry
- Fix slide mounted sections in absolute alcohol for 15 min and allow to dry completely at room temperature for 1 h.
- Briefly immerse sections for 10 s in a 1% gelatin solution (section 1) and allow to dry overnight at room temperature.
NOTE: For optimal results allow sections to dry overnight. Allowing sections to dry overnight yields better tissue staining. - Mix the solutions together as described in step 1.8 as soon as sections are ready to be reacted.
- React the sections by arranging the slides side by side in a glass or plastic tray, and pouring the developing solution onto the slides. Verify that slides are completely submerged in the solution and transfer the tray into a dark space, or cover with a light-tight box.
NOTE: A plastic tray that is approximately 12 inches long by 8 inches wide can be used, which fits exactly 18 slides. A total volume of 200 mL developer solution is sufficient to completely submerge the slides, so ensure that the correct volume is used for the number of slides to be reacted and adjust the recipe accordingly. Use of a plastic or glass tray as opposed to using a metal tray is advisable as there is some degree of cross reactivity between the silver lactate in the developer solution and the iron or other metals found in metal trays.
- React the sections by arranging the slides side by side in a glass or plastic tray, and pouring the developing solution onto the slides. Verify that slides are completely submerged in the solution and transfer the tray into a dark space, or cover with a light-tight box.
- Monitor the development of the reaction by visually inspecting the sections every 30 min. The sections generally require 120 - 180 min for complete development.
- If sections become overstained (see Figure 3a), differentiate in 2% Farmer's solution (9 parts 2% Sodium thiosulfate in dH2O and 1 part 2% Potassium Ferricyanide in dH2O) for 1 - 2 min.
NOTE: Sample section that is poorly stained is shown in Figure 3b. - Once the desired intensity is achieved, terminate the reaction by removing the slide mounted sections from the tray and placing the slides on a slide rack.
- Place the slide rack in a large glass staining dish and wash the slides in warm (40 - 50 °C) running water for 10 min to remove the gelatin coat and the outer silver deposit.
NOTE: Be careful not to agitate the slide rack to prevent sections from slipping off. The desired intensity of the section is achieved when sufficient laminar variation is evident and sections are dark enough but not overreacted (see Figure 4a). - Allow the slides to dry at room temperature, and then dehydrate in 100% EtOH (5 min), clear in xylene (5 min), and cover slip with a mounting medium. Alternatively, place the slides in an ascending series of alcohol, then dehydrate, clear, and coverslip.
- Use sections from animals without previous selenite treatment to serve as a negative control. Silver amplification of these sections should yield no staining.
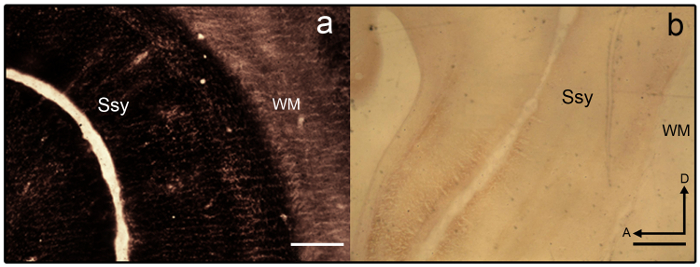
Figure 3: Synaptic zinc staining in the juvenile ferret brain. Photomicrographs of semi-tangential zinc-stained sections that are a) overstained and b) understained in the juvenile ferret brain. Areal boundaries are difficult to discern as laminar variation is lacking. White matter is also heavily stained. Ssy Suprasylvian cortex, WM White matter, A anterior, D dorsal. Scale bar = 500 µm (a-b). Please click here to view a larger version of this figure.
5. Distinguishing Areal Boundaries and Image Acquisition
- Use architectonic features of different brain regions for areal and laminar identification.
NOTE: For example, in the developing rat retrosplenial cortex14, the authors revealed a transient modularity characterized by heavy staining for zinc, which is not present in the adult but could be utilized to describe cortical organization during development in this species. In another study15, the authors revealed specificity in the synaptic zinc distribution of different nuclei found in the macaque monkey amygdala, which facilitate identification of these divisions. Visual cortical areas in the developing and adult ferret brain have been previously described16,17,18, architectonic subdivision of the neocortex in the gray squirrel were described19. Moreover, zinc histochemistry was previously used to distinguish among areas in the adult monkey visual cortex8, developing and adult cat visual cortex5, developing rat somatosensory cortex9,20, and adult mouse somatosensory cortex6,21. If available, compare the staining pattern in myelin stained, cytochrome oxidase (CO) stained, and synaptic zinc stained brain sections, to confirm areal boundaries in the adult. In semi-tangential sections of ferret visual cortex stained for synaptic zinc, there are prominent differences among visual cortical areas that facilitate areal identification. For example, areas 17 and 18 of the adult ferret reveal that synaptic zinc staining is high in layers I-III and V. Layer VI stains less intensely, while layer IV nearly lacks zinc. The conspicuous lack of zinc staining in layer IV or areas 17 and 18 contrasts with the darkly stained band found in layer IV in CO stained sections. However, layer IV of area 17 in CO stained sections maintains a sharp border with layers III and V, but layer IV in area 18 is characterized by a subtle decrease in staining intensity and its upper boundary found in layer III is less distinguishable. - Examine sections using brightfield microscopy with a low power objective (2X or 4X magnification) and photograph areas of interest.
- Enhance contrast and brightness of photomicrographs using image processing software. Images obtained for optical density measurements should not be altered in any way.
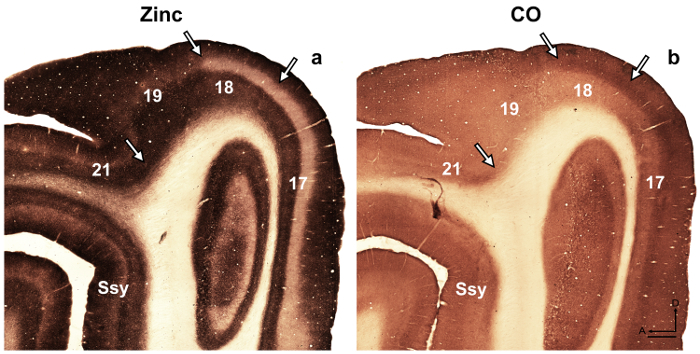
Figure 4: Synaptic zinc staining in the adult ferret brain distinguishes different visual cortical areas. Photomicrographs of adjacent semi-tangential sections stained for (a) synaptic zinc or (b) cytochrome oxidase (CO) in the adult. Arrows mark areal boundaries. Ssy Suprasylvian cortex, A anterior, D dorsal. Scale bar = 500 µm. Please click here to view a larger version of this figure.
6. Densitometry (Optional)
NOTE: Densitometric analysis may be used to assess the distribution of synaptic zinc in the brain by measuring the optical density of representative zinc stained sections in the regions of interest. This method is also useful for tracking potential changes in synaptic zinc levels throughout development.
- Using selected zinc-stained sections, randomly choose cortical columns (columnar photomicrographs) of appropriate width (a 450 µm wide column can be used) from acquired photomicrographs of the region of interest. A cortical column is a region spanning all cortical layers from the pial surface to the white matter.
- Choose an appropriate number of sample columns from several different brain sections in each region of interest.
- Transfer sample images of representative columns into an image processing software.
- Use the rectangular selection tool to encompass the entire cortical column.
- Use the invert tool to create a contrast reversed image similar to a photographic negative of the column.
NOTE: Contrast inversion of the images is performed to yield high optical density values for high synaptic zinc levels and low optical density values for low synaptic zinc levels. This is a more intuitive way to render plot profile graphs similar to the ones seen in Figure 5. - Produce optical density profiles from these images by using the plot profile tool to generate a two-dimensional graph of the pixel intensities along a line.
- Use plot options to convert the plot profile graph to a vertical profile and click on plot profile once more.
NOTE: The x-axis represents distance along the line and the y-axis represents the pixel intensity. Therefore, each plot profile value reflects the average gray scale value at each depth across the width of the column. - Open plot profile values as text files in spreadsheet, normalize, and plot as graphs (see Figure 5).
NOTE: It is advisable to use the relative density of synaptic zinc for comparison of quantitative measurements as results can be confounded by variation in overall staining intensity as a result of different reaction times, stainability of tissue, as well as other variables. - Calculate relative zinc density by first performing a boxcar average of the plot profile values to smooth the data.
NOTE: This is accomplished by averaging, for example, every successive 20 or 30 pixels (1 pixel = 2.5 µm) in depth, and then normalizing to maximum intensity for each sample. Therefore, each average plot profile value reflects the average gray scale value at that depth (gray scale values range from 0 to 255). A different normalization method may be used by first acquiring white matter (WM) optical density values from sample regions which include the underlying white matter in the areas of interest. Ideally, choose several regions that are as lightly stained as possible to obtain a mean WM value. Average optical density values are then divided by mean WM values to obtain WM normalized values. - Determine mean optical density values in specific layers of regions of interest for quantitative comparisons.
NOTE: For example, the mean minimum optical density value in layer IV of visual cortical areas of the ferret are determined by encompassing the least stained region by ±5 pixels. - Calculate mean optical density values in the supragranular and infragranular layers of visual cortical areas of the ferret by encompassing the darkest stained region by ±5 pixels to determine the mean maximum value.
- Ensure that mean optical density values are obtained from within particular layers.
NOTE: It is imperative to verify the limits of these layers in the contrast inverted images by comparing them to the original photomicrographs as well as the adjacent CO section. This guarantees that one does not intrude on adjacent layers.
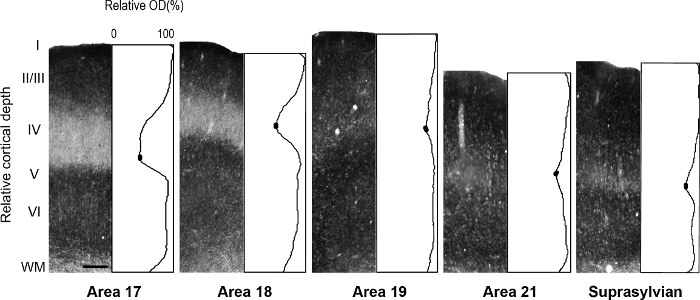
Figure 5: Laminar distribution of synaptic zinc in different visual cortical areas in the adult ferret. Representative photomicrographs of columns through all cortical layers with corresponding normalized optical density profiles in an adult. Low synaptic zinc density in layer IV of adult areas 17 and 18 is indicated by the trough in the profile plot. In each plot profile, filled ovals in the trough of layer IV indicate the values used to determine the average minimum pixel intensity value. Scale bar = 200 µm. Please click here to view a larger version of this figure.
Access restricted. Please log in or start a trial to view this content.
Results
The major steps involved in this protocol to stain brain sections for synaptic zinc are presented in a flowchart in Figure 1. The protocol can be divided into three phases: 1) Perfusion and tissue collection, 2) Tissue preparation and staining, and 3) Zinc histochemistry. Briefly, during the first phase of the protocol, the animal is anesthetized and injected IP with the appropriate dose of sodium selenite. After a sufficient time period (ideally 60 - 90 min)...
Access restricted. Please log in or start a trial to view this content.
Discussion
The current study employs a histochemical technique based on a modified version of the Danscher (1982) method10, whereby synaptic zinc localization may be detected and visualized in the brain. This method essentially works by injecting the animal with the zinc chelator sodium selenite (Na2SeO3) (15 mg/kg). Following injection, the selenite travels to the brain and binds to free zinc that is localized to presynaptic vesicles of zinc containing neurons. Zinc ions bound to molec...
Access restricted. Please log in or start a trial to view this content.
Disclosures
The authors have nothing to disclose.
Acknowledgements
This work was supported by grants from the National Center for Research Resources (2G12RR03060-26A1); The National Institute on Minority Health and Health Disparities (8G12MD007603-27) from the National Institutes of Health; Professional Staff Congress-City University of New York (PSC-CUNY); and Faculty Research Grant (FRG II) American University of Sharjah. We thank Vidyasagar Sriramoju for introducing us to these methods.
Access restricted. Please log in or start a trial to view this content.
Materials
| Name | Company | Catalog Number | Comments |
|---|---|---|---|
| Euthasol (Euthanasia solution) | Henry Schein | 710101 | |
| Sodium selenite | Sigma-Aldrich | 214485 | |
| Ketamine (Ketaved) | Henry Schein | 48858 | 100 mg/ml injectables |
| Xylazine (Anased) | Henry Schein | 33198 | 100 mg/ml injectables |
| Paraformaldehyde | Sigma-Aldrich | F8775 | Dilute to 4% |
| Gum arabic | Sigma-Aldrich | G9752-500G | |
| Citric acid | Sigma-Aldrich | C1909 | |
| Sodium citrate | Sigma-Aldrich | W302600 | |
| Hydroquinone | Sigma-Aldrich | H9003 | |
| Silver lactate | Sigma-Aldrich | 85210 | |
| Fish gelatine | Sigma-Aldrich | G7765 | |
| Cytochrome c | Sigma-Aldrich | C2506 | (Type III, from equine heart) |
| Catalse | Sigma-Aldrich | C10 | |
| Sucrose | Domino | ||
| Xylene | Fisher Scientific | X5P-1GAL | |
| Permount | Fisher Scientific | SP15-500 | |
| 100% Ethanol | Fisher Scientific | A406-20 | Used for dehydration prior to slide mounting |
| Coverslips | Brain Research Laboratories | #3660-1 | |
| Frosted unsubbed slides | Brain Research Laboratories | #3875-FR | |
| Microtome | American Optical Company | 860 | |
| Microscope | Olympus | BX-60 | |
| Adope Photoshop | Adobe Systems, San Jose, CA | To assemble images | |
| ImageJ | Free software can be downloaded at http://rsb.info.nih.gov/ij/ | For densometric measurements | |
| Plastic tray | Any standard plastic tray may be used | to immerse slides in developer solution | |
| Hot plate | Any standard hotplate may be used |
References
- Nakashima, A., Dyck, R. H. Zinc and cortical plasticity. Brain Res. Rev. 59, 347-373 (2009).
- Frederickson, C. J. Neurobiology of zinc and zinc-containing neurons. Int Rev Neurobiol. 31, 145-238 (1989).
- Beaulieu, C., Dyck, R., Cynader, M. Enrichment of glutamate in zinc-containing terminals of the cat visual cortex. NeuroReport. 3 (10), 861-864 (1992).
- Martinez-Guijarro, F. J., Soriano, E., Del Rio, J. A., Lopez-Garcia, C. Zinc-positive boutons in the cerebral cortex of lizards show glutamate immunoreactivity. J Neurocytol. 20 (10), 834-843 (1991).
- Dyck, R., Beaulieu, C., Cynader, M. Histochemical localization of synaptic zinc in the developing cat visual cortex. J Comp Neurol. 329 (1), 53-67 (1993).
- Garrett, B., Geneser, F. A., Slomianka, L. Distribution of acetylcholinesterase and zinc in the visual cortex of the mouse. Anat Embryol. (Berl). 184 (5), 461-468 (1991).
- Garrett, B., Osterballe, R., Slomianka, L., Geneser, F. A. Cytoarchitecture and staining for acetylcholinesterase and zinc in the visual cortex of the Parma wallaby (Macropus parma). Brain Behav Evol. 43 (3), 162-172 (1994).
- Dyck, R., Cynader, M. An interdigitated columnar mosaic of cytochrome oxidase, zinc, and neurotransmitter-related molecules in cat and monkey visual cortex. Proc. Natl. Acad. Sci. (90), 9066-9069 (1993).
- Land, P. W., Akhtar, N. D. Experience-dependent alteration of synaptic zinc in rat somatosensory barrel cortex. Somatosens Mot Res. 16 (2), 139-150 (1999).
- Danscher, G. Exogenous selenium in the brain: a histochemical technique for light and electron microscopic localization of catalytic selenium bonds. Histochemistry. 76, 281-293 (1982).
- Danscher, G., Howell, G., Perez-Clausell, J., Hertel, N. The dithizone, Timm's sulphide silver and the selenium methods demonstrate a chelatable pool of zinc in CNS: a proton activation (PIXE) analysis of carbon tetrachloride extracts from rat brains and spinal cords intravitall treated with dithizone. Histochemistry. 83, 419-422 (1985).
- Gallyas, F. Silver staining of myelin by means of physical development. Neurol Res. 1 (2), 203-209 (1979).
- Wong-Riley, M. Changes in the visual system of monocularly sutured or enucleated cats demonstrable with cytochrome oxidase histochemistry. Brain Res. 171 (1), 11-28 (1979).
- Miró-Bernié, N., Ichinohe, N., Perez-Clausell, J., Rockland, K. S. Zinc-rich transient vertical modules in the rat retrosplenial cortex during postnatal development. J Neurosci. 138 (2), 523-535 (2006).
- Ichinohe, N., Rockland, K. S. Distribution of synaptic zinc in the macaque monkey amygdala. J Comp Neurol. 489 (2), 135-147 (2005).
- Innocenti, G. M., Manger, P. R., Masiello, I., Colin, I., Tettoni, L. Architecture and callosal connections of visual areas 17, 18, 19 and 21 in the ferret (Mustela putorius). Cereb Cortex. 12 (4), 411-422 (2002).
- Khalil, R., Levitt, J. B. Zinc histochemistry reveals circuit refinement and distinguishes visual areas in the developing ferret cerebral cortex. Brain Struct Funct. 218, 1293-1306 (2013).
- Manger, P. R., Masiello, I., Innocenti, G. M. Areal organization of the posterior parietal cortex of the ferret (Mustela putorius). Cereb Cortex. 12, 1280-1297 (2002).
- Wong, P., Kaas, J. H. Architectonic subdivisions of neocortex in the gray squirrel (Sciurus carolinensis.). The anatomical record. 291, 1301-1333 (2008).
- Land, P. W., Shamalla-Hannah, L. Experience-dependent plasticity of zinc-containing cortical circuits during a critical period of postnatal development. J Comp Neurol. 447 (1), 43-56 (2002).
- Czupryn, A., Skangiel-Kramska, J. Distribution of synaptic zinc in the developing mouse somatosensory barrel cortex. J Comp Neurol. 386, 652-660 (1997).
- Timm, F. Zur Histochemie der Schwermetalle. Das Sulfid-Silber-Verfahren. Dtsch Z ges gerichtl Med. 46, 706-711 (1958).
Access restricted. Please log in or start a trial to view this content.
Reprints and Permissions
