Microbial biofilms form complex architectures at interphases and develop into highly scale-dependent spatial patterns. Here, we introduce an experimental system (hard- and software) for the automated acquisition of 3D optical coherence tomography (OCT) datasets. This toolset allows the non-invasive and multi-scale characterization of biofilm morphogenesis in space and time.
A subscription to JoVE is required to view this content. Sign in or start your free trial.
Method Article
Automated 3D Optical Coherence Tomography to Elucidate Biofilm Morphogenesis Over Large Spatial Scales
In This Article
Summary
Abstract
Biofilms are a most successful microbial lifestyle and prevail in a multitude of environmental and engineered settings. Understanding biofilm morphogenesis, that is the structural diversification of biofilms during community assembly, represents a remarkable challenge across spatial and temporal scales. Here, we present an automated biofilm imaging system based on optical coherence tomography (OCT). OCT is an emerging imaging technique in biofilm research. However, the amount of data that currently can be acquired and processed hampers the statistical inference of large scale patterns in biofilm morphology. The automated OCT imaging system allows covering large spatial and extended temporal scales of biofilm growth. It combines a commercially available OCT system with a robotic positioning platform and a suite of software solutions to control the positioning of the OCT scanning probe, as well as the acquisition and processing of 3D biofilm imaging datasets. This setup allows the in situ and non-invasive automated monitoring of biofilm development and may be further developed to couple OCT imaging with macrophotography and microsensor profiling.
Introduction
Biofilms are a highly successful microbial lifestyle adaptation and these interphase-associated and matrix-enclosed communities of microorganisms dominate microbial life in natural and industrial settings1,2. There, biofilms form complex architectures, such as elongated streamers3, ripples4 or mushroom-like caps5 with important consequences for biofilm growth, structural stability and resistance to stress6. While much about biofilm structural differentiation has been learned from work on mono-species cultures grown in miniature flow chambers, most biofilms are highly complex communities often including members of all domains of life6. Appreciating these complex biofilms as microbial landscapes7 and understanding how biofilm structure and function interact in complex communities is thus at the forefront of biofilm research.
A mechanistic understanding of the morphogenesis of complex biofilms in response to environmental cues requires carefully designed experiments in conjunction with spatially and temporally resolved observations of biofilm physical structure across relevant scales8. However, the non-destructive observation of biofilm growth in experimental systems has been severely limited by logistic constraints such as the need to move samples (e.g., to a microscope) often damaging the delicate biofilm structure.
The protocol presented here introduces a fully automated system based on optical coherence tomography (OCT), which allows the in situ, non-invasive monitoring of biofilm morphogenesis at the mesoscale (mm range). OCT is an emerging imaging technique in biofilm research with applications in water treatment and biofouling research, medicine9 and stream ecology10. In OCT, a low coherence light source is split into a sample and reference arm; the interference of the light reflected and scattered by the biofilm (sample arm) and the light of the reference arm is analyzed. A series of axial intensity profiles (A-scans) which contains depth-resolved structural information is acquired and merged into a B-scan (a cross section). A series of adjacent B-scans composes the final 3D volume scan10. OCT provides a lateral optical resolution in the range of approximately 10 µm and is therefore well suited to study mesoscopic structural differentiation of biofilms10,12. For a more detailed description of OCT, refer to Drexler and Fujimoto13and Fercher and colleagues14. Although the field-of-view of a single OCT xy-scan reaches up to hundreds of square micrometers, larger-scale patterns cannot be quantified by means of OCT in a single scan. With respect to biofilms in natural habitats such as streams and rivers, this currently limits our ability to assess biofilm morphogenesis at scales matching the physical and hydraulic template of the habitat.
In order to surpass these spatial limits and to acquire OCT scans automatically, a spectral-domain OCT imaging probe was mounted on a 3-axis positioning system. The installation permits the acquisition of several OCT scans in an overlapping mosaic pattern (tile scan), effectively achieving the tomographic imaging of surface areas up to 100 cm2. Furthermore, the high positioning precision of this system enables to reliably monitor the growth and development of biofilm features in specific sites during long-term experiments. The system is modular and individual components (i.e., positioning device and OCT) of the installation can be used as standalone solutions or flexibly combined. Figure 1 provides an overview of the hard- and software components of the installation.
The system was tested with a commercially available GRBL-controlled CNC positioning device (Table of Materials). The operating distances of this specific positioning platform are 600×840×140 mm, with a manufacturer-indicated accuracy of +/- 0.05 mm and a programmable resolution of 0.005 mm. GRBL is an open-source (GPLv3 License), high-performance motion control for CNC devices. Therefore, every GRBL-based (version > 1.1) positioning device should be compatible with the guidelines and software packages presented here. Moreover, the software could be adapted to other stepmotor controllers with STEP-DIR input type with few modifications.
The OCT device used to assess the performance of the system (Table of Materials) features a low coherence light source with a center wavelength of 930 nm (bandwidth = 160 nm) and adjustable reference arm length and intensity. In the example presented here, an immersion adapter for dipping the OCT probe into flowing water was also used (Table of Materials). The software package developed here for automated OCT scan acquisition critically depends on the SDK provided together with the specific OCT system, however, OCT systems from the same manufacturer with different scan lenses and central wavelengths should be readily compatible.
The GRBL device is controlled by a web server installed on a single-board computer (Figure 1). This grants remote control of the device from any computer with local network or internet access. The OCT device is controlled by a separate computer, allowing the operation of the OCT system aside the automated experimental setup. Finally, the software packages include libraries to synchronize OCT probe positioning and OCT scan acquisition (i.e., to automatically acquire 3D imaging datasets in a mosaic pattern or in a set of defined positions). Defining the position of the OCT probe in 3D effectively allows to adjust the focal plane specifically for (regional) sets of scans. Specifically, on uneven surfaces, different focal planes (i.e., different positions in z direction) can be specified for each OCT scan.
A set of software packages was developed to process raw OCT scans (Table 1). Navigation of the positioning device, OCT scan acquisition and dataset processing are performed with Python-coded Jupyter notebooks, which allow remarkable flexibility in the development and optimization of the software. Two worked and annotated examples of such notebooks (for image acquisition and processing, respectively) are available from https://gitlab.com/FlumeAutomation/automated-oct-scans-acquisition.git They are intended as starting points for customization of the method. A Jupyter notebook is a web browser based application which contain cells with annotated Python code. Each step is contained in a cell of the notebook, which can be executed separately. Due to the different length of the light path through the scan lens (spherical aberration)15, the raw OCT scans appear distorted (Figure 2A). We developed an algorithm to automatically correct for this distortion in acquired OCT scans (contained in ImageProcessing.ipynb, Supplementary File 1). Furthermore, biofilm morphology can be visualized as a 2D elevation map, as was previously used in membrane systems16, and we illustrate how elevation maps obtained from scans taken in a tiling array can be stitched.
Finally, the functionality of the described laboratory installation is illustrated using a flume experiment in which phototrophic stream biofilm is exposed to a gradient of flow velocity.
Access restricted. Please log in or start a trial to view this content.
Protocol
1. Setup of the Positioning Device
- Wire the positioning device to a microcontroller board, following the instruction in https://github.com/grbl/grbl/wiki/Connecting-Grbl.
- Connect the microcontroller to a single-board computer with internet connection via a USB cable and install the GRBL server as described in https://gitlab.com/FlumeAutomation/GRBL_Server.git. Now the positioning device should be navigable from a webpage hosted at http://IP:5020/. Alternatively, the positioning device can be navigated with a Python script, as demonstrated in the first part of the worked example ImagesAcquisition.ipynb (Supplementary File 2).
2. OCT Setup
- Mount the OCT probe to the positioning device using a compatible dove-tail holder. If required, install an immersion adapter on the objective lens.
- Position the computer and OCT base unit on a bench next to the experiment (e.g., microfluidic devices, flow chambers, flumes, filtration systems). Make sure that the optical cord (maximum length of approx. 1.8 m) is freely moving, long enough to reach all intended locations and not interfering with the experimental setup.
- Install the OCT system together with the available software as described by the manufacturer.
- Install the software packages for automated OCT scan acquisition as described in https://gitlab.com/FlumeAutomation/automated-oct-scans-acquisition.git.
3. Image Acquisition
- Power on the OCT system and the positioning device. Make sure the device can move freely.
- Open the file config.json in a text editor. Edit the config.json file to adjust default image acquisition parameter (Table 2), such as the refractive index (1.33 for water at 20 °C, 1.00 for air) and the destination folder for acquired data and metadata.
- Define the size of the field-of-view (FOV) and the number of A-scans per B-scan in config.json.
NOTE: These two parameters determine the size of the voxels of the final dataset and the size of the output file and should match the optical resolution of the probe (x-y voxel size should not be smaller than half of the optical resolution). The number of A- and B-scans affects the spatial extent to be covered which trades-off against available disk space and processing power. - Define the signal boundaries of the output OCT scan in config.json. These depend on the type of sample. It is thus recommended to determine these parameters based on intensity histograms of a set of preliminary scans. Save the changes in config.json.
- Navigate the OCT probe to a site of interest. Focus the sample and adjust the reference arm and light source intensity for optimal image quality. Repeat this procedure for a number of positions and note the coordinates.
NOTE: This will allow the subsequent automatic OCT scan acquisition around these reference points. Note that the reference arm length and intensity cannot be changed during automated image acquisition. - Open the ImageAcquisition.ipynb file (Supplementary File 2) in Juypter Notebook. Each cell contains code to perform specific tasks and can be run separately via pressing Cell | Run, or Ctrl + Enter or Shift + Enter.
- Set the path to the required libraries and the default configuration parameters. Alternatively, define a new set of temporary parameters.
- Connect to the positioning device and initialize the OCT.
- Calibrate the positioning device (i.e., perform a “homing”).
- Acquire the datasets covering the positions of interests in single-scan or mosaic pattern, specifying the number and the overlap (e.g., 30%) of neighboring tiles.
NOTE: The memory is allocated prior to the scan, which optimizes computer resource use. Data is saved in 8 bits *.raw format to save storage space, into the destination folder defined in config.json, using the time stamp and the position as naming convention (i.e., %Y%m%d_%H%M%S_). Metadata including the OCT settings and coordinates are saved in the same folder in a *.srm file with the same naming convention. Depending on settings such as FOV and resolution, file size may reach up to 1.5 GB per OCT scan.
- To avoid abortion of data acquisition, make sure that there is sufficient free disk space or continuously move OCT datasets to an external hard drive.
4. Image Correction and Display
- Open the Jupyter notebook ImageProcessing.ipynb (Supplementary File 1) for a worked example of OCT image processing (correction of distortion, background subtraction, calculation of elevation maps, elevation map stitching).
- If required, crop OCT scans in order to exclude spurious signals and reoriented the dataset (biofilm should appear above the substratum).
- Correct for spherical aberration. This is accomplished by a correction algorithm that utilizes a highly reflective reference surface known to be flat (e.g., bottom of the flume, substratum). First, the algorithm defines a grid of 20×20 vertical lines regularly spaced across the xy-plane of the OCT scan. Then, it selects a circular area around each point and averages signal intensities along the vertical profile (Figure 2B). The vertical profiles are processed with a modified Gaussian filter:

where x is the input signal, and σ its standard deviation, while C is determined such as:
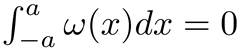
The reference surface is localized as local maxima in each of these profiles. Misidentified points are filtered based on the positions of their neighbors in three dimensions (Figure 2C). Finally, a 2nd order polynomial surface reflecting the distortion introduced by the scan lens is fitted across these points (Figure 2C). The fitted surface is then used to shift each pixel in z-direction, thus obtaining a flattened image. The parameters of this algorithm should be adjusted to the characteristics of the OCT scan. - Correct for background noise. Identify an empty area of the image (typically above the biofilm) and use the correction algorithm to subtract the average background intensity from the intensity values of the image to produce a final corrected OCT image (Figure 2D).
- Compute an elevation map from the 3D OCT dataset. In this step, define a reference surface of interest for the specific experiment (e.g., the substratum) and an appropriate threshold intensity. Then, use the elevation map calculation algorithm to calculate the thickness of the biofilm for each coordinate (x,y) of the binary mask and assign it to a new 2D matrix (Figure 3A). Thickness values are then assigned to a 2D matrix of the size of the original image in x and y directions. An image is rendered in which the elevation of the surface is reported as grayscale value (Figure 3B).
- In case several OCT scans are taken in a mosaic pattern, define the number of rows and columns and stitch the respective elevation maps. Figure 5 presents examples of stitched elevation maps, covering the broad range of spatial scales and resolutions achievable with the described setup.
Access restricted. Please log in or start a trial to view this content.
Results
We demonstrate the functionality of the automated OCT imaging system using a flume experiment designed to study the spatio-temporal morphogenesis of phototrophic stream biofilms. A gradually narrowing geometry of the flumes induced gradients in flow velocity along the center of the flume (see reference17). The temporal development and structural differentiation of biofilm was monitored over 18 days with the aim to better understand the effects of hydrodynamic conditions on biofilm morphogenesis.
Access restricted. Please log in or start a trial to view this content.
Discussion
OCT imaging is well suited to resolve structures in the micrometer range with a FOV of several square millimeters. It is thus a powerful tool for biofilm research10,18. However, OCT is currently limited to a maximum scan area of 100 - 256 mm2, while biofilm structural patterns often exceed this spatial scale19, especially when morphological differentiation is driven by large scale environmental gradients20
Access restricted. Please log in or start a trial to view this content.
Disclosures
Sebastian Schäfer is employed at Thorlabs Inc.
Acknowledgements
We thank Mauricio Aguirre Morales for his contribution to the development of this system. Financial support came from the Swiss National Science Foundation to T.J.B.
Access restricted. Please log in or start a trial to view this content.
Materials
| Name | Company | Catalog Number | Comments |
|---|---|---|---|
| OCT Probe | Thorlabs | GAN210C1 | OCT imaging device |
| OCT scan lens | Thorlabs | OCT-LK3-BB | |
| Immersion adapter | Thorlabs | OCT-IMM3-SP1 | |
| Stepcraft 840 CK | STEPCRAFT | NA | positioning device |
| microcontroller | Arduino Uno R3 | NA | |
| Single-board computer | Raspberry PI | NA | |
| camera | Canon EOS 7D Mark II | NA | |
| camera lens | Canon MACRO EFS 35 mm | NA |
References
- Flemming, H. C., Wingender, J. The biofilm matrix. Nature reviews. Microbiology. 8, 623-633 (2010).
- Flemming, H. -C., et al. Biofilms: an emergent form of bacterial life. Nature reviews. Microbiology. 14, 563(2016).
- Stoodley, P., Lewandowski, Z., Boyle, J. D., Lappin-Scott, H. M. Oscillation characteristics of biofilm streamers in turbulent flowing water as related to drag and pressure drop. Biotechnology and Bioengineering. 57, 536-544 (1998).
- Stoodley, P., Lewandowski, Z., Boyle, J. D., Lappin-Scott, H. M. The formation of migratory ripples in a mixed species bacterial biofilm growing in turbulent flow. Environmental microbiology. 1, 447-455 (1999).
- Banin, E., Vasil, M. L., Greenberg, E. P. Iron and Pseudomonas aeruginosa biofilm formation. Proceedings of the Natural Academy of Sciences U.S.A. 102, 11076-11081 (2005).
- Battin, T. J., Besemer, K., Bengtsson, M. M., Romani, A. M., Packmann, A. I. The ecology and biogeochemistry of stream biofilms. Microbiology. 14, 251-263 (2016).
- Battin, T. J., et al. Microbial landscapes: new paths to biofilm research. Nature Reviews. Microbiology. 5, 76-81 (2007).
- Neu, T. R., Lawrence, J. R. Innovative techniques, sensors, and approaches for imaging biofilms at different scales. Trends in Microbiology. 23, 233-242 (2015).
- Meleppat, R. K., Shearwood, C., Seah, L. K., Matham, M. V. Quantitative optical coherence microscopy for the in situ investigation of the biofilm. J. of Biomedical Optics. 21 (12), 127002(2016).
- Wagner, M., Horn, H. Optical coherence tomography in biofilm research: A comprehensive review. Biotechnology and Bioengineering. 114, 1386-1402 (2017).
- Huang, D., et al. Optical coherence tomography. Science. 254, 1178-1181 (1991).
- Haisch, C., Niessner, R. Visualisation of transient processes in biofilms by optical coherence tomography. Water Resources. 41, 2467-2472 (2007).
- Drexler, W., Fujimoto, J. G. Optical Coherence Tomography: Technology and Applications. , Springer Verlag. (2008).
- Fercher, A. F. Optical coherence tomography – development, principles, applications. Zeitschrift für Medizinische Physik. 20, 251-276 (2010).
- Lee, H. -C., Liu, J. J., Sheikine, Y., Aguirre, A. D., Connolly, J. L., Fujimoto, J. G. Ultrahigh speed spectral-domain optical coherence microscopy. Biomedical Optics Express. , 41236-41254 (2013).
- Fortunato, L., Leiknes, T. In-situ biofouling assessment in spacer filled channels using optical coherence tomography (OCT): 3D biofilm thickness mapping. Bioresource Technology. 229, 231-235 (2017).
- Niederdorfer, R., Peter, H., Battin, T. J. Attached biofilms and suspended aggregates are distinct microbial lifestyles emanating from differing hydraulics. Nature Microbiology. 1, 16178(2016).
- Roche, K. R., et al. Benthic biofilm controls on fine particle dynamics in streams. Water Resources. 53, 222-236 (2016).
- Fortunato, L., Jeong, S., Wang, Y., Behzad, A. R., Leiknes, T. Integrated approach to characterize fouling on a flat sheet membrane gravity driven submerged membrane bioreactor. Bioresource Technology. 222, 335-343 (2016).
- Morgenroth, E., Milferstedt, K. Biofilm engineering: linking biofilm development at different length and time scales. Reviews in Environmental Science and Bio/Technology. 8, 203-208 (2009).
Access restricted. Please log in or start a trial to view this content.
Reprints and Permissions
