This protocol allows for the differentiation of human pluripotent cells into intestinal organoids. The protocol mimics normal human development by differentiating cells into a population of definitive endoderm, hindgut endoderm and then intestinal epithelium. This makes the protocol suitable for studying both intestinal development as well as disease modelling applications.
Method Article
Generation of hiPSC-Derived Intestinal Organoids for Developmental and Disease Modelling Applications
* These authors contributed equally
In This Article
Summary
Abstract
hiPSC-derived intestinal organoids are epithelial structures that self-assemble from differentiated cells into complex 3D structures, representative of the human intestinal epithelium, in which they exhibit crypt/villus-like structures. Here, we describe the generation of hiPSC-derived intestinal organoids by the stepwise differentiation of hiPSCs into definitive endoderm, which is then posteriorized to form hindgut epithelium before being transferred into 3D culture conditions. The 3D culture environment consists of extracellular matrix (ECM) (e.g., Matrigel or other compatible ECM) supplemented with SB202190, A83-01, Gastrin, Noggin, EGF, R-spondin-1 and CHIR99021. Organoids undergo passaging every 7 days, where they are mechanically disrupted before transfer to fresh extracellular matrix and allowed to expand. QPCR and immunocytochemistry confirm that hiPSC-derived intestinal organoids contain mature intestinal epithelial cell types including goblet cells, Paneth cells and enterocytes. Additionally, organoids show evidence of polarization by expression of villin localized on the apical surface of epithelial cells.
The resulting organoids can be used to model human intestinal development as well as numerous human intestinal diseases including inflammatory bowel disease. To model intestinal inflammation, organoids can be exposed to inflammatory mediators such as TNF-α, TGF-β, and bacterial LPS. Organoids exposed to proinflammatory cytokines display an inflammatory and fibrotic phenotype in response. Pairing of healthy versus hiPSCs derived from patients with IBD may be useful in understanding mechanisms driving IBD. This may reveal novel therapeutic targets and novel biomarkers to assist in early disease diagnosis.
Introduction
The properties of pluripotent stem cells (PSCs), such as self-renewal and the ability to differentiate to any cell type of the human body, make them valuable tools in the study of development, disease pathology and drug testing1. Human induced pluripotent stem cells (hiPSC) are particularly useful for disease modelling studies as they can be derived from patients, directly capturing the genome responsible for the disease phenotype2,3. Such hiPSCs can be differentiated to the cell type affected by the genetic defect allowing careful examination of molecular mechanism of the disease4.
Differentiation protocols for human PSCs aim to direct differentiation of cells via the main developmental stages by activation or inhibition of specific signaling pathways governing lineage commitment and specification. Maintenance of hiPSC in a pluripotent state requires moderate levels of Activin A (Act-A) signaling, while a high dosage of Act-A for 3 days commits hiPSC to a definitive endoderm (DE) fate5,6. Act-A and Wnt pathways direct anterior-posterior identity of the DE. Signaling by Act-A induces foregut (FG) markers such as HHEX, HNF4α and GATA4, while blocking expression of hindgut (HG) genes such as CDX2. Wnt signaling induces posteriorization of the DE, which then adopts a HG gene expression profile7,8. Once HG cell identity is established, differentiation can be moved from 2D to 3D and directed towards the formation of intestinal organoids.
Intestinal organoids are typically cultured in a 3D extracellular matrix (e.g., Matrigel or other compatible ECMs) based culture system9, comprised of laminin, collagen IV and entactin and enriched with growth factors such as EGF, FGF, PDGF and IGF-1 to contribute to the support survival and proliferation. The organoids are cultured in a defined medium containing Gastrin, Noggin and CHIR to stimulate and support intestinal stem cell growth and proliferation during long-term culture.
After intestinal epithelial cells are embedded into the extracellular matrix, intestinal crypts begin to form and expand eventually forming spheroids. These mature into organoid structures that mimic physiological functioning of intestinal epithelium. Organoids can typically be cultured for more than 1 year without significant loss of functional and gene expression profiles. Passaging is required on a weekly basis using enzymatic digestion of the organoids into smaller fragments which then self-reassemble into complete organoids.
Established organoid lines can be used as a reliable model of numerous disorders linked to the intestine, including Crohn’s Disease, Ulcerative Colitis and colorectal cancers10,11,12,13. This is a preferred model to animal cells as they express human genes linked to these disorders and respond to external stimuli more closely resembling that which occurs in human tissue in vivo.
Protocol
NOTE: All tissue culture work detailed below should be done in a Class II laminar flow hood.
1. Human induced pluripotent stem cell (hiPSCs) differentiation to the hindgut endoderm
- To coat a cell culture flask with extracellular matrix, first calculate the amount of the matrix needed. Here is an example of a 12-well plate being coated with Matrigel. Calculate the required amount of extracellular matrix to coat a 12 well plate. Use the following formula:

NOTE: Coat cell culture dishes with extracellular matrix of choice. If using Matrigel, use a concentration of 0.035 mg/cm2 24 h prior to seeding for differentiation. Check batch concentration of extracellular matrix on product sheet and prepare smaller aliquots ahead of experiments according to manufacturer’s instructions. - Dilute the required amount of extracellular matrix in cold DMEM media using a p1000 pipette.
- Mix well using a 5 mL stripette.
- Add 500μL of diluted matrix to each well plate. Shake the plate gently to evenly distribute the diluted extracellular matrix and incubate for a minimum of 12 h at 37 °C.
- Before seeding cells to the plate, wash each well with 500 µL of PBS to remove excess extracellular matrix. This will prevent cell detachment during the differentiation.
- Leave the last wash in the wells until ready to seed to prevent the drying of extracellular matrix.
- To seed for hiPSCs differentiation towards definitive endoderm (DE) or hindgut (HG), take a flask of hiPSCs cultured in a maintenence media of choice (e.g.: essential 8 media) and aspirate the media. (Here, we seed cells at 25,000 cells/cm2).
NOTE: Seeding density is crucial for successful differentiation and needs to be optimized for each individual hiPSC cell line. - Wash the cells in the flask with 5 mL of PBS. Aspirate the PBS.
- Add 2.5 mL of cell dissociation solution (e.g., TrypLE) and leave at RT for 4 min. Aspirate the cell dissociation solution and tap the flask gently to detach the cells.
- Wash the flask with 5 mL of DMEM media warmed to 37 °C and collect all the cells into a 15 mL tube.
- Take 10 µL of resuspended cell solution and measure the cell density with a hemocytometer.
- Take enough of the cell suspension to collect 1.05 x 10⁶ cells and place in a 15 mL tube.
- Spin at 160 x g for 3 min. While the cells are being centrifuged, aspirate PBS from the extracellular matrix coated 12 well plate.
- Following centrifugation, aspirate the supernatant and resuspend the cell pellet in 12 mL of maintenance media with ROCK inhibitor (10 µM).
- Using a p1000 pipette, add 1 mL of cell suspension to each well of the 12 well plate. Resuspend the cells well to ensure equal distribution between the wells.
- Shake the plate gently to distribute the cells within the wells of the plate but avoid swirling of the media as it will concentrate the cells in the middle of the wells.
- Place in a 37 °C, 5% CO2 incubator.
- Change media to maintenance media (e.g., essential 8 media) only (no ROCK inhibitor) 24 h post seeding.
- To begin differentiation to DE, prepare endoderm basal media according to Table 1.
NOTE: At the start of the differentiation cells should be at between 60-80% confluence. - Prepare 12 mL of DE media by adding Activin A (100 ng/mL) and Wnt3 (50 ng/mL) to the endoderm basal media.
- Warm up the media to 37 °C.
- Aspirate media from each well of the tissue culture plate or flask.
- Start the DE differentiation by adding 1 mL of DE media to each well of the 12 well plate.
- At 24 h after starting DE differentiation (D1 DE), prepare fresh DE media and perform media change.
- Repeat step 1.24 at 48 h (D2 DE). If a lot of cell death is present at this stage, wash all wells with 500 µL of PBS before media change.
NOTE: To confirm successful endoderm differentiation, perform flow cytometry to assess expression of SOX17. We normally expect >80% of cells to be SOX17 positive by D3 DE. If expression of SOX17 is suboptimal cell seeding density should be optimized as well as concentrations of Act-A. - Start HG differentiation at this point, i.e. 72 h post start of DE differentiation. Prepare 12 mL of HG media by adding CHIR99021 (3 µM) and RA (1 μM) to endoderm basal media (Table 1).
NOTE: At D3 DE the cell should have formed a uniform monolayer. Optimal DE differentiation is crucial for further stages of differentiation. - Aspirate DE media.
- Start HG differentiation by adding 1 mL of HG media to each well of the 12 well plate.
- Continue the differentiation for 4 days with daily media changes.
NOTE: To determine success of DE posteriorization, perform flow cytometry to assess expression of CDX2. By D4 of HG differentiation we normally expect >80% of cells to be CDX2 positive. If posteriorization is suboptimal, concentration of CHIR99021 should be optimized. - To collect a sample for RNA extraction, aspirate differentiation media and wash the well with 500 ul of PBS.
- Aspirate PBS and add a suitable volume of cell lysis buffer from an RNA extraction kit.
- Using a p1000 pipette, scrape the bottom of the well to ensure lysis of all the cells.
- Aspirate the cell lysate and place in a clean tube.
- Proceed to RNA extraction or freeze the lysate at -20 °C until ready for RNA extraction.
- For immunostaining, aspirate differentiation media and wash wells with 500 µL of PBS.
- Aspirate the PBS and add 500 µL of 4% PFA.
NOTE: PFA is toxic. Use appropriate PPE and follow local laboratory procedures for PFA disposal. - Incubate at 4 °C for 20 min.
- Remove PFA and wash the wells with 500 µL of PBS three times.
- Leave the last PBS wash on the cells until ready to perform immunostaining.
2. Passaging of intestinal organoids
- Prepare intestinal basal media according to Table 2.
- To transfer from 2D to 3D cell culture, use a 6 well plate to generate DE cells form hiPSCS. Detach the monolayer of cells form the 6 cell plate using a 5 mL stripette.
- Collect cells into a 15 mL centrifuge tube, before centrifuging at 400 x g for 1 min to produce a cell pellet.
- Resuspend the cell pellet in intestinal growth media containing growth factors: SB202190 (10 µM), A83-01 (500 nM), Gastrin (10 nM), Noggin (100 ng/µL), EGF (500 ng/µL), R-Spondin1 (100 ng/mL), CHIR99021 (6 µM), ROCK inhibitor (10 µM).
- Add appropriate volume of extracellular matrix dependent on the number of wells being plated into. This can be calculated using the equations below.
[1] Total volume of extracellular matrix/media (µL) = 30 µL * number of wells of 48-well plate
[2] Required volume of extracellular matrix (µL) = Answer from [1] * 2/3
[3] Required volume of media (µL) = Answer from [1] * 1/3 - Add 30 µL of cell suspension to the center of each well of a 48-well plate.
- Incubate the plate in a 37 °C incubator for a minimum of 5 min to allow the extracellular matrix to set.
- Once the extracellular matrix domes have set, add 300 µL of intestinal growth media containing all growth factors to each well.
- Return the plate to a 37 °C incubator with 5% CO2.
NOTE: If after 48 h no organoids can be observed and/or there is significant cell death ROCKi and NOGGIN concentrations may need to be optimized. - To passage the organoids, observe the cells under a light microscope to assess density and size of organoids and determine whether they need passaging.
- Replace cell culture media with ice cold PBS.
NOTE: Organoid cultures will need splitting approximately every 5-7 days. Passaging of intestinal organoid cultures is required once there is an accumulation of cell debris evident within the organoid lumen and a yellowing of the surrounding intestinal growth medium. - Mechanically detach organoids and extracellular matrix sphere from the plate using a scraping motion with a 5 mL stripette.
- Collect the organoids from each well into a 15 mL centrifuge tube.
- Centrifuge organoid suspension at 400 x g for 1 min to pellet the organoids. Aspirate the supernatant until reaching the top of the cell pellet, being careful when having reached the visible extracellular matrix layer.
- Resuspend the pellet in 15 mL of ice cold PBS.
NOTE: This step serves to wash any remaining extracellular matrix that was not removed in the initial spin. - Centrifuge at 400 x g for 1 min. Aspirate the media until the pellet, containing the organoids.
- Resuspend in 1 mL of ice cold PBS. Using a p200 pipette, manually disrupt the intact organoids by pipetting up and down several times.
NOTE: Observe the size of the organoids using light microscope to determine whether they need to be further dissociated. - Add 9 mL of media without growth factors.
- Centrifuge at 400 x g for 1 min. Aspirate the supernatant until the organoids pellet.
- Calculate the required amount of extracellular matrix and media using the equations below:
[1] Total volume of extracellular matrix/media (µL) = 30 µL * number of wells of 48-well plate
[2] Required volume of extracellular matrix (µL) = Answer from [1] * 2/3
[3] Required volume of media (µL) = Answer from [1] * 1/3 - Resuspend the organoid pellet in the calculated volume of intestinal media with growth factors (including Noggin & ROCK inhibitor).
- Add the required volume of extracellular matrix into this cell suspension and resuspend to ensure even distribution of organoids.
- Pipette 30 µL of this suspension into the center of each well of a 48 well plate (preferably pre-heated in a 37 °C incubator).
- Return the plate to a 37 °C incubator for 5 min until the extracellular matrix has set.
- Prepare intestinal media with growth factors (+ ROCK inhibitor) (approximately 17 mL per 48 well plate).
- Add 300 µL to each well.
- Incubate at 37 °C at 5% CO2.
- Following passaging, aspirate the media for the intestinal organoids and replace with fresh intestinal media with growth factors (without Noggin & ROCK inhibitor) every 2-4 days.
NOTE: If after 48 hours no organoids can be observed and/or there is significant cell death ROCKi and NOGGIN concentrations may need to be optimized.
NOTE: Intestinal organoids respond to a range of inflammatory mediators in vivo. TNFα is a cell signaling protein involved in several inflammatory processes. - To trigger an inflammatory response in intestinal organoids, prepare TNFα at a concentration of 40 ng/mL in basal media only.
- Aspirate media from 48 well plate.
- Add 300 µL of prepared basal media containing 40 ng/mL TNFα.
- Incubate plate at 37 °C for 48 hours to replicate a pro-inflammatory environment.
NOTE: Intestinal organoids respond to a range of inflammatory mediators in vivo. TNFα is a cell signaling protein involved in several inflammatory processes. - Dispose of any remaining cells by aspiration into a vacuum trap containing 5% Trigene.
Results
A schematic of the differentiation protocol is shown in Figure 1A. On day 1 of the protocol, hiPSCs should be compact and forming small colonies with total confluence approximately 50-60%. 24 hours following induction of differentiation towards DE cells begin to migrate away from the stem cell colonies to form a monolayer of cells. This continues over the following 3 days and should form a complete monolayer on D3 of DE differentiation (Figure 1). Gene expression should be monitored over the course of differentiation with pluripotency markers (OCT4, NANOG, SOX2) highly expressed on D0 and rapidly downregulated during DE differentiation. During DE differentiation T expression should peak on D1, followed by EOMES and MIXL on D2. On D2 DE genes (SOX17, FOXA2, GATA4, CXCR4) should begin to be expressed and peak at D3 (Figure 2 and Figure 3). Cells should be a monolayer by DE D3 and can then be posteriorized into hindgut endoderm. During the posteriorization event 3D structures will start to form as early as D2. However, sometimes they will only start to appear at D4 or not at all; this is not always indicative of whether or not the cells will proceed and form intestinal organoids (Figure 1). During HG specification CDX2 and HNF4a expression should be induced and increase over time (Figure 3).
Following transfer of 2D sheets of cells into extracellular matrix, clumps of 2D cells will be observed for the first 24 h. After 48 h sheets of cells should begin to auto organize into more compacted 3D spheroid structures that are initially small (Figure 4A) then gradually increase in size and complexity over 7-10 days of culture (Figure 4B & Figure 4C). Organoids should not be passaged until they have achieved a clear organoid/spheroid morphology with obvious epithelium with the lumen facing towards the center of the organoid/spheroid (Figure 4D). At this stage immunocytochemistry can be used to confirm expression of intestinal markers such as villin and CDX2 (Figure 5). Not all clumps of 2D cells will develop into organoids and there will be some contaminating dead cells within the extracellular matrix. These dead sheets of cells should be ignored until the surviving cells have formed large organoids and are ready for passaging.
To model inflammation, TNFα can be added to the tissue culture medium for 24-48 h. Following incubation with proinflammatory molecules, organoids are harvested using the same technique used for their isolation and passaging and then lysed using a cell buffer compatible application such as QPCR or western blotting. If shorter exposures are required, organoids should first be removed from the extracellular matrix and exposed to TNFα in suspension using a 1.5 mL tube. Treatment of intestinal organoids with TNFα for 48 h typically induces expression of pro-inflammatory markers (TNFα, IL1B, IL8, IL23) while negatively affecting expression of intestinal epithelial markers (LGR5, VIL) (Figure 6).
| Endoderm basal media | 50 mL | |
| RPMI 1640 | 48.5 mL | |
| B27 Supplement | 1 mL | |
| 1% NEAA | 0.5 mL | |
Table 1: Composition of endodermal basal media for endoderm differentiation.
| Intestinal Basal Media | 50 mL | |
| Advanced DMEM/F12 | 46.5 mL | |
| HEPES Buffer | 0.5 mL | |
| GlutaMAX | 0.5 mL | |
| Nicotinamide | 0.5 mL | |
| N2 Supplement | 0.5 mL | |
| B27 Supplement | 1.0 mL | |
| Pen/Strep | 0.5 mL | |
Table 2: Composition of intestinal basal media for culture of intestinal organoids
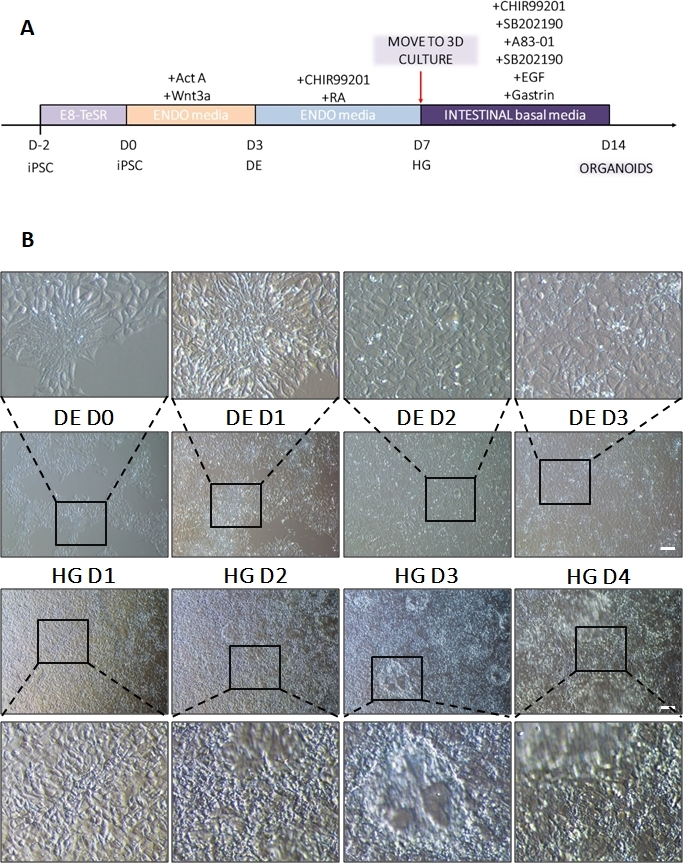
Figure 1: Morphological changes during differentiation of hiPSC via definitive endoderm to the hindgut lineage.
(A) Schematic overview of intestinal differentiation protocol. This cell line of hiPSC forms loose colonies of small cells with a high nucleus to cytoplasm ratio. As the differentiation proceeds, the cells undergo changes consistent with transition from the epithelial to the mesenchymal phenotype and by DE D3 form a uniform monolayer. Once appropriate signals are delivered, DE cells elongate and form a more densely packed monolayer with 3D spheroids appearing as soon as HD D3 but this is dependent upon cell line used and is not a requirement for transition to 3D culture (B). Scale bar: 100 µm. Please click here to view a larger version of this figure.
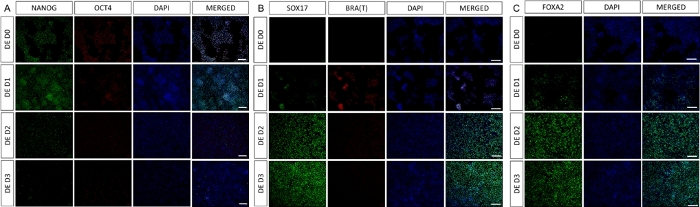
Figure 2: Differentiation of hiPSCs to HG endoderm induces expression of endodermal genes.
Immunostaining of hiPSC differentiating to definitive endoderm shows changes in expression of TFs at protein level. Pluripotency markers (NANOG and OCT4) are downregulated by DE D3 (A). Expression of mesendoderm marker BRA(T) is present at D1 of the protocol (B) and DE specific TFs SOX17 and FOXA2 appear on D2 (B & C). Scale bar: 200 mm. Please click here to view a larger version of this figure.
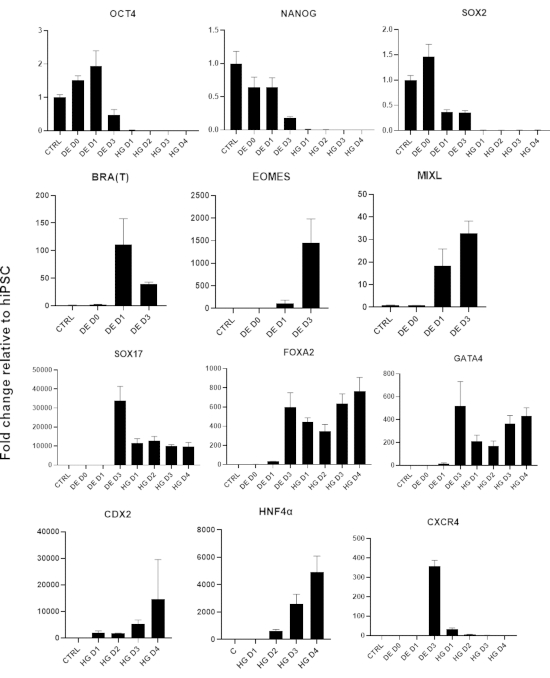
Figure 3: Gene expression changes by qPCR during hiPSC differentiation to hindgut endoderm (HG).
Genes associated with pluripotency are downregulated (OCT4, NANOG, SOX2) followed by transient expression of mesendoderm genes (T, EOMES, MIXL1), and finally expression of DE genes (SOX17, FOXA2, CXCR4) and hindgut genes (CDX2, GATA4, HNF4a). Data presented as mean ±SD. Please click here to view a larger version of this figure.
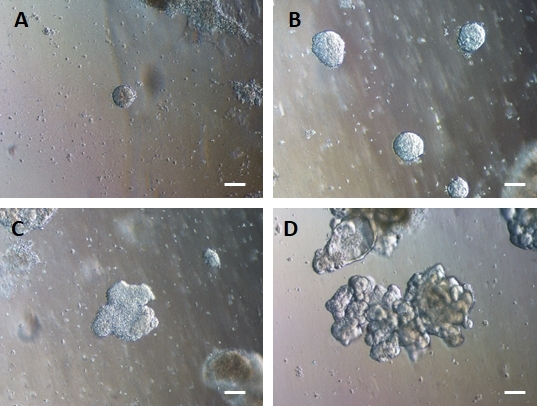
Figure 4: HG endoderm self-assembles to form 3D intestinal organoids in 3D extracellular matrix culture.
HG endoderm is transferred into a suitable 3D extracellular matrix culture and initially forms small solid clumps of cells (A). Clumps of HG endoderm expand over 7-10 days of culture (B) and then become asymmetrical and begin to form a more complex epithelium (C) eventually giving rise to organoids with clear epithelial morphology and a luminal surface facing towards the centre of the organoid (D). Scale bars = 50 µm Please click here to view a larger version of this figure.
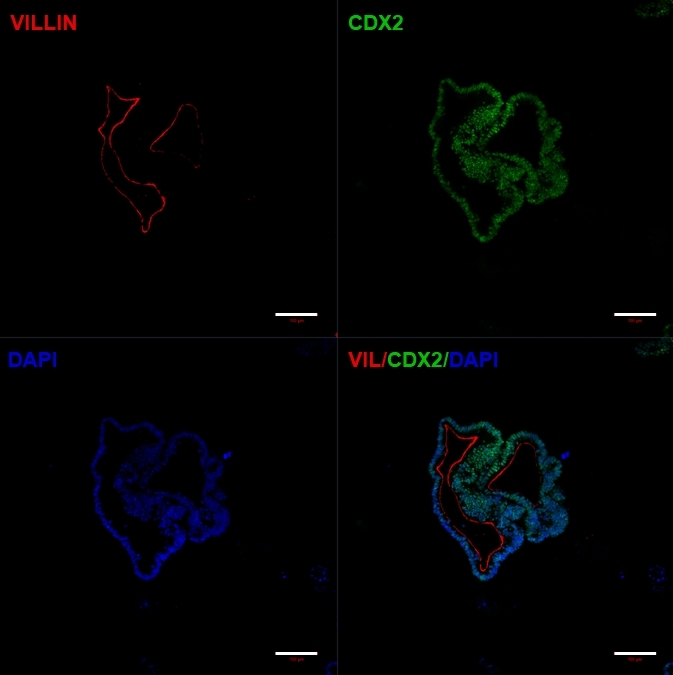
Figure 5: Established hiPSC-derived intestinal organoids express intestinal markers.
Immunocytochemistry showing expression of CDX2 and Villin. Scale bars = 100 µm Please click here to view a larger version of this figure.
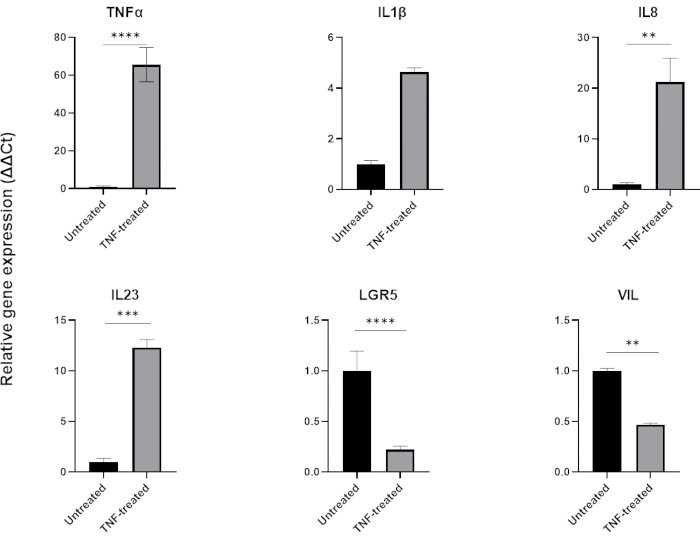
Figure 6: Effect of TNFα on the inflammatory profile & intestinal cell expression of healthy intestinal organoids.
Inflammatory profile of healthy colonic organoids following 48 hour treatment with TNFα (40 ng/mL). Expression of pro-inflammatory markers (TNFα, IL-8 & IL-23) increases following exposure to TNFα, while at the same time expression of intestinal epithelial markers (LGR5, VIL) are downregulated. Statistical analyses were performed by two-sided student’s t-test. Data are expressed as mean ± SD of each group. *P < .01; **P < .001; ***P < .0001. (n=3). Please click here to view a larger version of this figure.
Discussion
Here, we describe a protocol for the differentiation of human pluripotent cells into human intestinal organoids. We demonstrate their use to study inflammation; however, this can be applied to various contexts, and coupled with CRISPR/Cas9 gene editing approaches14, on any genetic background. Once differentiated, following the natural developmental differentiation sequence of definitive endoderm, hindgut endoderm and then intestinal epithelium, the resulting organoids can be continually cultured and passaged for more than 12 months.
A critical aspect of this protocol is the initial plating density of undifferentiated stem cells prior to endoderm differentiation. If this is not optimized sufficiently cells will likely die during the initial DE differentiation step (if cells are too sparse) or reduce the efficiency of the DE differentiation (if the cells are too dense). The correct starting density needs to be optimized for the cell line being used, and the correct density should generate a monolayer by the end of DE D3. Flow cytometry should be used to determine efficiency of DE specification and we typically see >80% of cells positive for SOX17 and/or CXCR4. When the number of SOX17 positive cells is less than 60%, the efficiency of HG patterning is impacted, which results in fewer organoids forming when transferred to the extracellular matrix. This will ultimately cause the resulting organoid cultures to fail. To determine if patterning DE to HG has been successful, we assess the number of CDX2 positive cells by flow cytometry and typically expect to see >80% positive cells. Again, if the number of CDX2 positive cells falls below 50% this will have an adverse effect on the number of intestinal organoids that are generated when transferred to 3D extracellular matrix culture.
Following transfer of 2D monolayers into 3D culture, small compact spheres should appear 24-48 h following transfer. Large sheets of dead cells can appear depending on the differentiation efficiency for the cell line used. Instead of immediately passaging cultures to remove these debris, we allow the organoids to fully form and develop their more complex, folded structure. Waiting 7-10 days before attempting the first passing ensures that sufficient dividing cells are present to generate many new intestinal organoids. Any debris that are still present in the culture can be easily removed during the passaging process by slowly spinning the dissociated organoid/debris mixtures in a tube with sufficient speed to pellet the organoids but leave sheet of cells floating in the media. Media and cellular debris can then be aspirated so that only the pellet of organoids remains.
The limitation of this approach is that hiPSC-derived cell types are not often fully mature in terms of gene expression and functional profiles. To determine if hiPSC-derived intestinal tissue is suitable for specific applications the organoids should be characterized for different cell types including enterocytes (VIL), enteroendocrine cells (neurog3), goblet cells (MUC2), transient amplifying cells (CD133), paneth cells (FZD5) and LGR5+ stem cells (LGR5) to determine the organoid cellular composition.
Overall, the major advantage of this protocol over many other organoid differentiation protocols is that this culture platform is very cost-effective due to replacement of several recombinant proteins and conditioned media preparations with small molecules15,16. The differentiation into HG is very simple and fast and can be applied to both human embryonic and induced pluripotent stem cells with identical outcomes. When followed rigorously, and optimized for the cell lines being used it provides a relatively simple model platform free of contaminating mesenchymal cells that can then be applied to study intestinal epithelium in a variety of context including inflammation, host pathogen interactions7. Intestinal fibrosis modeling could be investigated by providing pro-fibrotic stimuli and then assessing expression of extracellular matrix proteins such as collagen, laminin and fibronectin by QPCR, western blot and ELISA. Using CRISPR/Cas9 gene editing techniques on undifferentiated stem cell lines prior to differentiation allows for the creation of gene knockout or protein overexpression organoids that could be used to create disease specific organoids and more complex disease models14,17,18.
Disclosures
The authors have nothing to disclose.
Acknowledgements
NH is funded by the MRC (MR/S009930/1) and the Wellcome Trust (204267/Z/16/Z), PD is funded by the MRC PhD DTP, KLF is funded by the BBSRC iCASE.
Materials
| Name | Company | Catalog Number | Comments |
|---|---|---|---|
| A83-01 | Tocris | 2939 | |
| Activin A | R&D | 338-AC | |
| Advanced DMEM/F12 (1X) | Life Technologies | 12654-010 | |
| B27 supplement | Gibco | 17504044 | |
| CHIR99021 | Sigma | SML1046-5MG | |
| Epidermal Growth Factor | R&D Systems | 236-EG-01M | |
| Gastrin | Sigma Aldrich | G9145 | |
| GlutaMAX (100X) | Life Technologies | 15630-056 | |
| Growth Factor reduced Matrigel | BD | ||
| HEPES Buffer solution (1M) | Life Technologies | 15630-080 | |
| N2 Supplement (100X) | Gibco | 17502-048 | |
| N-acetyl-cysteine | Sigma Aldrich | A7250 | |
| Nicotinamide | Sigma Aldrich | N0636 | |
| Noggin | R&D Systems | 6057-NG | |
| Non-essential amino acids | Gibco | 11140-050 | |
| Paraformaldehyde | VWR | 9713.5 | |
| Penicillin/Streptomycin | Gibco | 15140122 | |
| Phosphate Buffered Saline | Gibco | 14190-094 | |
| Retinoic Acid | Sigma | 302-79-4 | |
| ROCK inhibitor | Tocris | 1254/1 | |
| ROCK inhibitor Y-27632 | Tocris | 1254 | |
| RPMI | Sigma | R8758-500ml | |
| R-Spondin-1 | Peprotech | 120-38 | |
| SB202190 | Tocris | 1264 | |
| TrypLe Express | Gibco | 12604-021 | |
| Wnt 3a | R&D | 5036-WN |
References
- Thomson, J. A., et al. Embryonic stem cell lines derived from human blastocysts. Science. 282, 1145-1147 (1998).
- Takahashi, K., Yamanaka, S. Induction of pluripotent stem cells from mouse embryonic and adult fibroblast cultures by defined factors. Cell. 126, 663-676 (2006).
- Takahashi, K., et al. Induction of pluripotent stem cells from adult human fibroblasts by defined factors. Cell. 131, 861-872 (2007).
- Rashid, S. T., et al. Modeling inherited metabolic disorders of the liver using human induced pluripotent stem cells. Journal of Clinical Investigation. 120, 3127-3136 (2010).
- Vallier, L., Alexander, M., Pedersen, R. A. Activin/Nodal and FGF pathways cooperate to maintain pluripotency of human embryonic stem cells. Journal of Cell Science. 118, 4495-4509 (2005).
- Jaremko, K. L., Marikawa, Y. Regulation of developmental competence and commitment towards the definitive endoderm lineage in human embryonic stem cells. Stem Cell Research. 10, 489-502 (2013).
- Forbester, J. L., et al. Interaction of Salmonella enterica Serovar Typhimurium with Intestinal Organoids Derived from Human Induced Pluripotent Stem Cells. Infection and Immunity. 83, 2926-2934 (2015).
- Hannan, N. R., et al. Generation of multipotent foregut stem cells from human pluripotent stem cells. Stem Cell Reports. 1, 293-306 (2013).
- Sato, T., et al. Single Lgr5 stem cells build crypt-villus structures in vitro without a mesenchymal niche. Nature. 459, 262-265 (2009).
- de Souza, H. S., Fiocchi, C. Immunopathogenesis of IBD: current state of the art. Nature Reviews Gastroenterology & Hepatology. 13, 13-27 (2016).
- Tripathi, K., Feuerstein, J. D. New developments in ulcerative colitis: latest evidence on management, treatment, and maintenance. Drugs in Context. 8, 212572(2019).
- Ganesh, K., et al. A rectal cancer organoid platform to study individual responses to chemoradiation. Nature Medicine. 25, 1607-1614 (2019).
- Fair, K. L., Colquhoun, J., Hannan, N. R. F. Intestinal organoids for modelling intestinal development and disease. Philosophical Transactions of the Royal Society B: Biological Sciences. 373, (2018).
- Cuevas-Ocaña, S., Yang, J. Y., Aushev, M., Schlossmacher, G., Bear, C. E., Hannan, N. R. F., Perkins, N. D., Rossant, J., Wong, A. P., Gray, M. A. A Cell- Based Optimised Approach for Rapid and Efficient Gene Editing of Human Pluripotent Stem Cells. Int. J. Mol. Sci. 24, 10266(2023).
- Spence, J. R., et al. Directed differentiation of human pluripotent stem cells into intestinal tissue in vitro. Nature. 470, 105-109 (2011).
- Sato, T., et al. Long-term Expansion of Epithelial Organoids From Human Colon, Adenoma, Adenocarcinoma, and Barrett's Epithelium. Gastroenterology. 141, 1762-1772 (2011).
- Giacalone, J. C., et al. CRISPR-Cas9-Based Genome Editing of Human Induced Pluripotent Stem Cells. Current Protocols in Stem Cell Biology. 44, 1-22 (2018).
- Bruntraeger, M., Byrne, M., Long, K., Bassett, A. R. CRISPR Gene Editing: Methods and Protocols. Luo, Y. , Springer. New York. 153-183 (2019).
Reprints and Permissions
