This protocol presents a 3D biomimetic model with accompanying fibrotic stromal compartment. Prepared with physiologically relevant hydrogels in ratios mimicking the bio-physical properties of the stromal extracellular matrix, an active mediator of cellular interactions, tumor growth and metastasis.
Method Article
A Biomimetic Model for Liver Cancer to Study Tumor-Stroma Interactions in a 3D Environment with Tunable Bio-Physical Properties
In This Article
Summary
Abstract
Hepatocellular carcinoma (HCC) is a primary liver tumor developing in the wake of chronic liver disease. Chronic liver disease and inflammation leads to a fibrotic environment actively supporting and driving hepatocarcinogenesis. Insight into hepatocarcinogenesis in terms of the interplay between the tumor stroma micro-environment and tumor cells is thus of considerable importance. Three-dimensional (3D) cell culture models are proposed as the missing link between current in vitro 2D cell culture models and in vivo animal models. Our aim was to design a novel 3D biomimetic HCC model with accompanying fibrotic stromal compartment and vasculature. Physiologically relevant hydrogels such as collagen and fibrinogen were incorporated to mimic the bio-physical properties of the tumor ECM. In this model LX2 and HepG2 cells embedded in a hydrogel matrix were seeded onto the inverted transmembrane insert. HUVEC cells were then seeded onto the opposite side of the membrane. Three formulations consisting of ECM-hydrogels embedded with cells were prepared and the bio-physical properties were determined by rheology. Cell viability was determined by a cell viability assay over 21 days. The effect of the chemotherapeutic drug doxorubicin was evaluated in both 2D co-culture and our 3D model for a period of 72h. Rheology results show that bio-physical properties of a fibrotic, cirrhotic and HCC liver can be successfully mimicked. Overall, results indicate that this 3D model is more representative of the in vivo situation compared to traditional 2D cultures. Our 3D tumor model showed a decreased response to chemotherapeutics, mimicking drug resistance typically seen in HCC patients.
Introduction
Hepatocellular carcinoma (HCC) comprises 90% of all primary liver cancers1,2. With 810,000 deaths and 854,000 new cases reported annually it is currently ranked as the fifth most common cancer worldwide with one of the highest incidences of mortality1. The development of HCC is predominantly attributed to inflammation associated with chronic liver diseases namely, viral hepatitis, chronic excessive alcohol intake, metabolic syndrome, obesity and diabetes1,3,4. The inflammation associated with these pathological conditions results in hepatocyte injury and secretion of various cytokines that activate and recruit hepatic stellate cells and inflammatory cells to initiate fibrosis5. Hepatic stellate cells are known for their key role in the initiation, progression, and regression of hepatic fibrosis. Upon activation they differentiate into myofibroblast like cells with contractile, pro-inflammatory and pro-fibrinogenic properties6,7,8. The resulting fibrosis in turn causes the dysregulation of extracellular matrix remodeling enzyme activity, creating an environment characterized by an overall increased stiffness accompanied by the secretion of growth factors, which further contributes to HCC pathogenesis9,10. It is this continuous pathogenic feedback loop between hepatocytes and the stromal environment, which fuels cancer initiation, epithelial to mesenchymal transitions (EMT), angiogenesis, metastatic potential, and altered drug response11,12,13. Insight into hepatocarcinogenesis in terms of the interplay between the tumor and the tumor micro-environment is, therefore, of considerable importance not only from a mechanistic but also from a treatment perspective.
Two-dimensional (2D) in vitro cell culture models are predominantly used by 80% of cancer cell biologists14. However, these models are not representative of the true tumor micro-environment, which affects chemotherapeutic responses14,15,16. Currently 96% of chemotherapeutic drugs fail during clinical trials14. This high incidence in drug attrition rates can be attributed to the fact that available in vitro pre-screening models do not fully represent our current insight and understanding of HCC complexity and the microenvironment16. Conversely in vivo animal models present with compromised immune systems and discrepancies in interactions between the tumor and the microenvironment when compared to humans16,17. On an average only 8% of results obtained from animal studies can be reliably translated from the pre-clinical to the clinical setting16,17. Therefore, it is clear that the evaluation of HCC requires the development of an in vitro platform that effectively recapitulates the complexity of not only the tumor but also the microenvironment. The platforms would supplement the currently available in vitro pre-clinical screening models and reduce the amount of animal studies in the future7,14.
One such platform is advanced three-dimensional (3D) cell culture models. A multitude of these advanced 3D models to study HCC have emerged over the last decade and various reviews have been published. Available 3D models to study HCC include multicellular spheroids, organoids, scaffold-based models, hydrogels, microfluidics, and bio-printing. Of these, multicellular spheroids are one of the best-known models used in the study of tumor development. Spheroids are an inexpensive model with low technical difficulty while at the same time effectively mimicking in vivo tumor architecture18,19,20. Multicellular spheroids have contributed to a wealth of information on HCC17,21,22. However, standardized culture time is lacking as multicellular spheroids are kept in culture between 7 to 48 days. Increased culture time is of considerable importance. Eilenberger found that the differences in spheroid age profoundly influences Sorafenib (a kinase inhibitor used for the treatment of liver cancers) diffusivity and toxicity23. While Wrzesinski and Fey found that 3D hepatocyte spheroids require 18 days to re-establish key physiological liver functions after trypsinization and continues to exhibit the stable functionality for up to 24 days after this recovery24,25.
Some of the more advanced 3D HCC models includes the use of human decellularized liver scaffolds and bio-printed scaffolds. Mazza and colleagues created a natural 3D scaffold for HCC modeling using decellularized human livers not suitable for transplantation26. These natural scaffolds could successfully be repopulated for 21 days with a co-culture of hepatic stellate and hepatoblastoma cells, while maintaining the expression of key extracellular matrix components such as collagen type I, III, IV and fibronectin. Other than disease modeling, this model also offers the advantage of functional organ transplantation and pre-clinical drug and toxicity screening26. With the advances in 3D bio-printing, 3D extracellular matrix scaffolds can now also be bio-printed. Ma and colleagues, bio-printed extracellular matrix scaffolds with variable mechanical properties and biomimetic microarchitecture using hydrogels engineer from decellularized extracellular matrix27. Undoubtedly these are all excellent 3D HCC models. However, unavailability of human livers and the cost involved in acquiring the necessary equipment and materials places these models at a disadvantage. Additionally, these methods are all technically advanced requiring extensive training that may not be readily available to all researchers.
Based on the complexity of HCC and currently available 3D models, we endeavored to develop an all-encompassing 3D HCC model. We aimed for a model capable of recapitulating both the premalignant and tumor microenvironment by incorporating adjustable hydrogel stiffness values. Furthermore, we also included hepatocellular and stroma associated cell lines, that play a key role in the pathogenesis of HCC. These include endothelial cells, hepatic stellate cells and malignant hepatocytes, grown in a microenvironment composed of physiologically relevant hydrogels. With the chosen hydrogels, collagen type I and fibrinogen, incorporated in ratios comparable to bio-physical changes seen in liver stiffness during the initiation and progression of HCC. Additionally, we aimed for a model that could be kept in culture for a prolonged time-period. We envisioned a modular, cost effective model that can be setup with basic equipment, minimal training and experience, and readily available materials.
Protocol
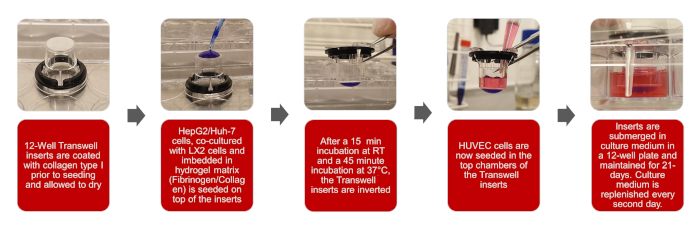
Figure 1: Graphical depictions of the creation of the 3D biomimetic HCC model Please click here to view a larger version of this figure.
NOTE: The overall workflow of this protocol is set out in the illustrations of Figure 1
1. Preparation of fibrinogen stock solution
- Prepare a 1 M calcium chloride (CaCl2) stock solution, by weighing 2.21 g CaCl2 and adding it to 20 mL distilled water (dH2O). Stock solution can be stored at room temperature (RT).
- Prepare a 20 mL aprotinin stock solution (1218.75 KIU/mL) by weighing 5 mg of aprotinin and adding it to 20 mL dH2O. Aliquot stock solution into 1 mL aliquots and store at -20 °C.
- Prepare a 10 mL of 80 mg/mL fibrinogen stock solution.
- In a 50 mL tube add 7.849 mL phosphate buffered saline (PBS), 2.051 mL aprotinin stock (1218.75 KIU/mL) for a final aprotinin concentration of 250 KIU/mL and 100 µL CaCl2 (1M) for a final CaCl2 concentration of 10 mM.
- Weigh 800 mg of fibrinogen.
- Weigh 200 mg sodium chloride (NaCl) for the stock solution to contain 2% w/v NaCl.
- Add the fibrinogen and NaCl in increments to the 50 mL tube containing the PBS, aprotinin and CaCl2. Do not stir or shake vigorously as this will result in fibrinogen gelling and lumps forming in the solution.
- Place the 50 mL tube of the fibrinogen stock solution horizontally on a shaker and shake at a low setting of 300 rpm.
- Once the solution has dissolved, filter it using a 0.22 µm syringe filter or a bottle top filter depending on the volume. Importantly, do not autoclave the fibrinogen solution as this will destroy the fibrinogen.
NOTE: This part of the protocol can take between 2 to 5 h depending on the amount of stock solution, this time should be taken into consideration during the experimental setup.
2. Coating inserts with collagen prior to seeding the hydrogels onto the inserts
- In a laminar flow hood or a tissue culture hood, using sterilized tweezers, remove inserts from the plate and place inverted onto the lid of the plate.
- Prepare a 100 mL of 20 mM glacial acetic acid stock solution by adding 115 µL of glacial acetic acid to 25 mL of dH2O and adjust to a final volume of 100 mL with dH2O. Filter the solution using a 0.22 µm syringe filter. Stock solution can be stored at RT.
- Prepare 2 mL of a 100 µg/mL collagen solution from a 5 mg/mL collagen solution by adding 40 µL of the 5 mg/mL collagen solution to 1.960 mL of the 20 mM glacial acetic acid stock solution prepared in 2.2.
- Coat the inserts with the 100 µg/mL collagen solution prepared in 2.3 by pipetting 100 µL of the solution onto each insert. Let inserts air dry within the laminar flow hood or tissue culture hood for 2 to 3 h.
- Once inserts have dried wash each insert 3x with PBS. Add 1 mL of PBS to each well of a 12 well plate, place the inserts with collagen coating facing down into the wells, remove PBS from the well and repeat the procedure. Let inserts air dry within the laminar flow hood 1 to 2 h.
CAUTION: Acetic acid is toxic to cells and inserts should be washed thoroughly with PBS. - Add a custom 3D printed spacer over the inserts, this will be necessary once the gels are hanging from the insert to prevent them from touching the bottom well of the plate (Figure 2).
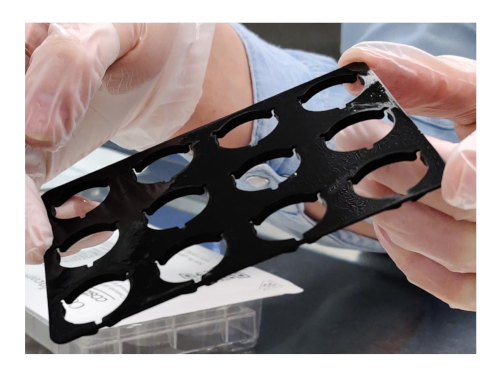
Figure 2: Custom 3D printed spacer Please click here to view a larger version of this figure.
- Cover the inverted inserts with the bottom part of the plate and place into the incubator until cells are embedded in the hydrogels and ready to be seeded.
3. Seeding cells embedded in hydrogels onto inserts
NOTE: Table 1 provides a description of 3 formulations with varying concentrations fibrinogen that will be prepared. Formulation one corresponds to the liver during the onset of fibrosis, two cirrhosis and three HCC, the stiffness values for each of these formulations were determined with rheology during the protocol optimization.
| Formulation | Final Fibrinogen concentration (mg/mL) | Final Collagen concentration (mg/mL) | Cells (LX2 + HepG2 Co-culture 1:1) | Stage of the liver | Literature liver stiffness values (kPa) | Model Stiffness value from Rheology (kPa) | Formulation | Fibrinogen to add (mL) | Collagen to add (mL) | 10 % DMEM (mL) | Thrombin (µL) | References |
| 1 | 10 | 2 | 2 x 10⁶ cells/mL | Fibrosis | ≥2 | 3 | 1 | 1 | 0.8 | 0.2 | 4 | 28; 29; 30 |
| 2 | 30 | 2 | 2 x 10⁶ cells/mL | Cirrhosis | 6 | 2 | 0.75 | 0.8 | 0.45 | 3 | ||
| 3 | 40 | 2 | 2 x 10⁶ cells/mL | HCC | ≥10 | 10 | 3 | 0.25 | 0.8 | 0.95 | 1 | 28; 31; 32 |
Table 1: Description of formulations for seeding cells embedded in hydrogels onto inserts
- Prepare 1 M sodium hydroxide stock solution by adding 3.99 g of NaOH to 100 mL of dH2O. The solution can then be filtered using a 0.22 µm syringe filter. Store the stock solution at RT.
- Place the 5 mg/mL collagen and 10 mL of 1 M NaOH on ice.
- Preheat 50 mL PBS, 15 mL trypsin, 70 mL 10% DMEM, and fibrinogen stock solution, prepared in section 1, to 37 °C for 20 min in a water bath.
- Prepare the cell suspensions.
- Wash hepatic stellate cells (LX2) and liver carcinoma (HepG2) cells in T175 culture flasks twice with 10 mL of PBS.
- Trypsinize cells with 6 mL trypsin for 4 min at 37 °C.
- Inactivate trypsin with 6 mL of 10% DMEM.
- Collect the cell suspension in 15 mL tube and centrifuge for 3 min at 300 x g.
- After centrifugation, aspirate the supernatant and resuspend each cell line in 5 mL of 10% DMEM.
- Count the cells using an automated cell counter: Add 10 µL of each cell suspension to the counting chamber slide and insert the slide into the cell counter. Cell count is displayed as cells/mL.
- Dilute the cells from each cell line to 1 x 10⁶ cells per mL using the cell count in step 3.4.6 into clearly marked 15 mL tubes. Centrifuge the dilutions for 3 min at 300 x g.
- After centrifugation, aspirate the supernatant and add 10% DMEM to each 15 mL tube according to Table 1, values provided in the Table is for 2 mL of each formulation.
- Neutralize the amount of collagen with 10 µL/mL NaOH (1 M), and add the neutralized collagen to the cell suspension, the 10% DMEM present will turn yellow, once the suspension is mixed thoroughly by pipetting with a cut tip it will turn a bright pink.
- Add fibrinogen to the collagen cell suspension according to Table 1, using a cut pipette tip, mix the suspension thoroughly.
- Finally add thrombin to collagen-fibrinogen cell suspension, 0.1 KIU thrombin for each 10 mg of fibrinogen.
- Remove the pre-coated inverted inserts prepared in section 2 from the incubator and using a cut 200 µL pipette tip, pipette 200 µL of the prepared suspension onto the designated inserts. Allow the gels to crosslink for 15 min within the laminar flow hood.
- After 15 min, gently place the bottom section of the plate over the gels and move them to the incubator to allow the gels to crosslink at 37 °C for 45 min.
- Once the gels have crosslinked, invert the inserts again and add 2 mL of 10% DMEM to each of the bottom wells of the plate.
4. Seeding endothelial cells
- Preheat 25 mL hanks balanced salt solution (HBSS), 10 mL trypsin, 10 mL trypsin inhibitor and 50 mL endothelial growth medium, to 37°C for 20 min in a water bath .
- Prepare the endothelial (HUVEC) cell suspension.
- Wash HUVEC cells in T175 culture flasks twice with 10 mL HBSS.
- Trypsinize cells with 6 mL trypsin for 4 min at 37 °C. Inactivate trypsin with 6 mL trypsin inhibitor. Collect the cell suspension in 15 mL of tube and centrifuge for 3 min at 200 x g.
- After centrifugation aspirate the supernatant and suspend the cells in 5 mL endothelial growth medium.
- Count the cells as previously described in 3.4.6 using an automated cell counter.
- Using the cell count from the cell counter, prepare seeding density of 1.0 x 10⁴ cells/mL in endothelial growth medium.
- Seed 500 µL of the HUVEC cell suspension into each well of the top part of the insert to have a final volume of 5.0 x 10³ cells per insert.
5. Maintenance
- Replace the growth medium every second day, aspirate spent growth medium from both the well and the insert. Add 2 mL 10% DMEM to the wells containing the gel and 0.5 mL endothelial growth medium to the inserts containing the HUVEC cells.
- Maintain the model for 21 days prior to experimentation.
6. Rheology
- Measure storage moduli of gel formulations to indicate stiffness values using a rheometer, by performing frequency sweeps from 0.1-20 Hz at 0.267% and 37°C, with a constant axial force of 0.1N using an 8 mm diameter parallel plate stainless steel geometry.
7. Viability and drug response
- Determine the drug response and viability in 2D co-cultures and 3D model.
- Seed HepG2 (5.0 x 10³ cells/mL) and LX2 (5.0 x 10³ cells/mL) cells in a 1:1 ratio for the 2D co-culture into a black clear bottom 96-well plates at a seeding density of 1.0 x 10⁴ cells/mL. Allow cells to attach overnight.
- Setup the 3D model to correspond to a cirrhotic environment with a stiffness value of 6 kPa. Maintain the model for 21 days prior to Doxorubicin treatment.
- Two hours prior to doxorubicin treatment, aspirate the culture medium from both the 2D and 3D model. Wash both models twice with PBS. Add the starvation medium (DMEM supplemented with 1% v/v antimycotic antibiotic solution) to the 2D co-culture (200 µL per well) and to the 3D model (2 mL to the wells containing the hydrogel and 500 µL to the insert).
- Administer doxorubicin to the both the 2D and the 3D model. Dosages are as follows: 0.5, 1 and 1.5 mM corresponding to the IC25, 50 and 75 values, respectively. Treat both models for 72 h.
NOTE: Doxorubicin, a topoisomerase II inhibitor, is one of the first chemotherapeutic drugs used for HCC and is also one of the most active chemotherapeutic agents in the treatment of HCC33,34. - After 72 h, aspirated culture medium from both the 2D and 3D model. Ensure that any remaining culture medium is removed by washing both models twice with PBS.
- Prepare AlamarBlue according to the manufacturer recommendations and add to the wells of the 2D and 3D model. Add 150 µL per well for the 2D culture and 2 mL per well and 500 µL per insert for 3D culture. Incubated overnight at 37°C.
- Following incubation transfer 150 µL of the AlamarBlue from each well of the 3D setup into a black clear bottom 96-well plate. AlamarBlue can be read directly from the plate for the the 2D model.
- Read the fluorescence with a microplate reader at excitation wavelength and emission wavelength of 485 and 550 nm, respectively.
- Calculate the percentage cell viability in both models using the following formula:

Results
Concentration ranges and seeding volume
Protocol optimization to obtain the final functioning protocol occurred according to the schematic diagram presented in Figure 3. Two physiologically relevant hydrogels, Collagen type I and Fibrinogen, was identified by means of a literature search35,36. Starting with rat tail collagen type I, a range of concentrations (4, 3, 2 and 1 mg/mL) was seeded onto inverted inserts to determine their ability to successfully adhere to the insert once inverted again. All concentrations within this range were able to form gels, however collagen gels appeared flattened and had various air bubbles trapped within them because of handling and pipetting, see Figure 4 and Figure 5. To determine the optimal seeding volume to improve the quality of the collagen gel, a range of seeding volumes (100, 150 and 200 µL), was seeded onto inverted inserts, see Figure 5. The seeding volume had no influence on the appearance of the gel or the presence of bubbles within the gel. Accordingly, it was decided that 200 µL was the optimal seeding volume producing the fullest gels. Fibrinogen was also evaluated for its ability to produce a gel that could adhere to an insert for a prolonged time period. A concentration range (70, 50, 40, 30, 20, 10, 5, 1 mg/mL) was prepared and seeded at a volume of 200 µL onto the lid of a 12-well plate, see Figure 6. Within 20 min after seeding all the concentrations were able to successfully form a gel. However, the concentrations 5 and 1 mg/mL was excluded as the gels formed had a fluid like consistency and had started to detach from the lid after being kept overnight at 37 °C.
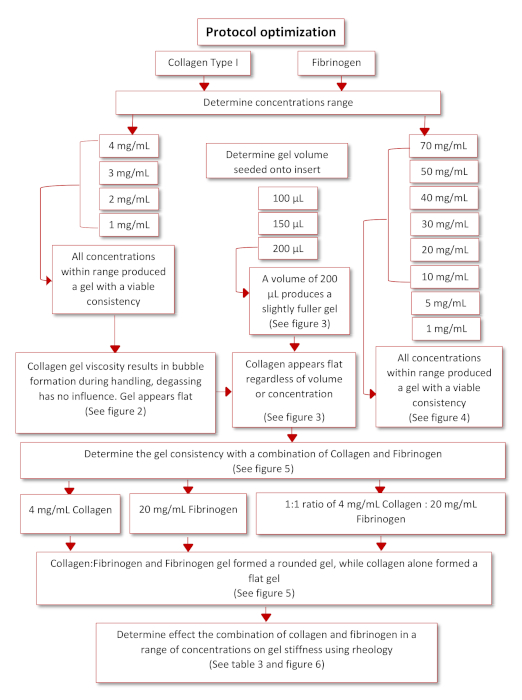
Figure 3: Schematic diagram of protocol optimization. Please click here to view a larger version of this figure.
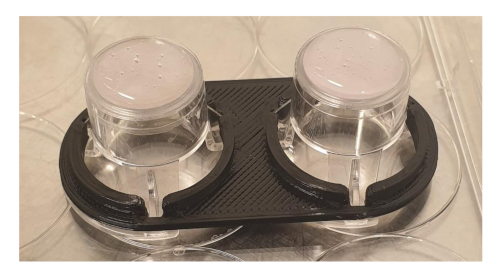
Figure 4: Collagen gels 4 mg/mL containing 1.0 x 10⁵ cells/mL seeded onto inserts showing bubbles present in the gel. Insert on the left been degassed on ice for 15 min, while insert on the right has not been degassed. Degassing did not have any effect on the bubbles present in the gels. Please click here to view a larger version of this figure.
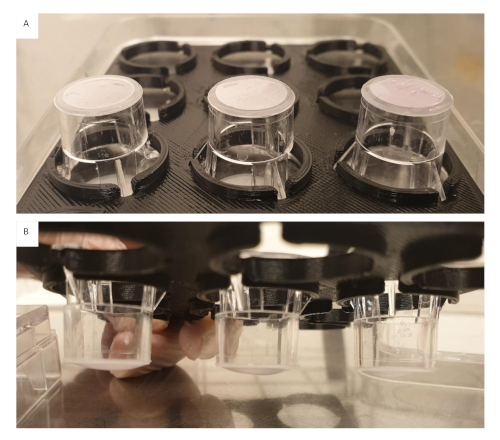
Figure 5: Collagen gels 4 mg/mL containing 1.0 x 10⁵ cells/mL seeded onto inserts in varying volumes. (A) Insert on the left 100 µL, middle 150 µL and right 200 µL, directly after seeding. Bubbles in the gels were still present. (B) Insert on the left 200 µL, middle 150 µL and right 100 µL, after 60 min crosslinking. All gels regardless of volume still appear flat. Please click here to view a larger version of this figure.
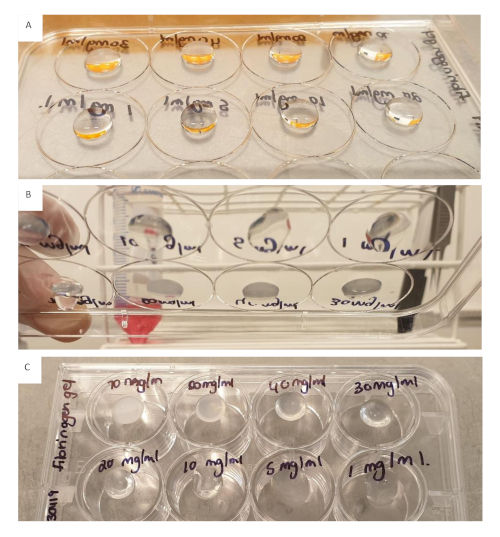
Figure 6: Fibrinogen (200 µL) in a concentration range from 70 to 1 mg/mL seeded onto the lid of a 12-well plate. (A) Gels directly after seeding. (B) Gels 20 min after seeding. (C) Gels kept overnight. All gels appear well rounded, the 5 mg/mL and 1 mg/mL gels were excluded as they appeared to have a more fluid consistency 20 min after seeding and had started to detach from the lid after being kept overnight. Please click here to view a larger version of this figure.
Combination collagen and fibrinogen
Based on the results from the collagen and fibrinogen concentration ranges the effect of combining the collagen and fibrinogen was evaluated. Three inserts were setup with the following, 4 mg/mL collagen, 20 mg/mL fibrinogen and a 1:1 ration of collagen (4 mg/mL) and fibrinogen (20 mg/mL), see Figure 7. Directly after seeding the hydrogels, we observed that the insert with collagen alone still had a flat appearance combined with the occurrence of bubbles within the gel. The inserts with fibrinogen produced a full and rounded gel, so did the insert with the combination of collagen and fibrinogen. After cross linking at 37 °C for 60 min, all gels had attached to the insert and remained attached following overnight incubation at 37 °C.
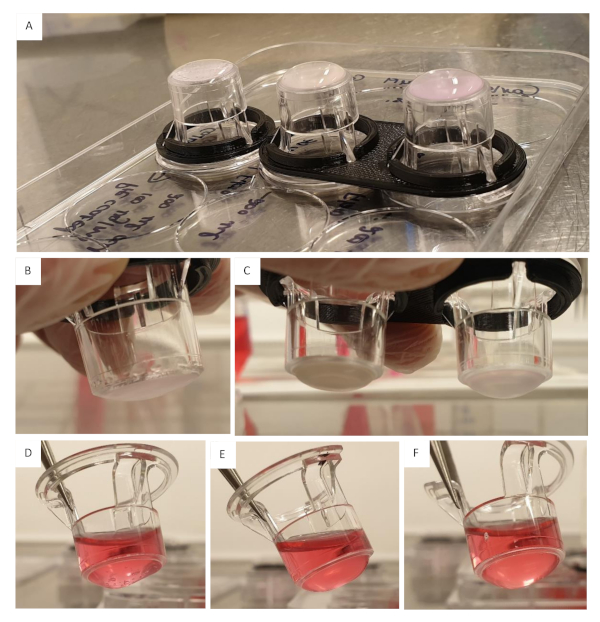
Figure 7: Effect of the combination of collagen and fibrinogen. (A) Collagen 4 mg/mL seeded onto insert on the left, fibrinogen 20 mg/mL seeded onto insert in the middle and collagen 4 mg/mL, fibrinogen 20 mg/mL (1:1 ration) seeded onto insert on the right. All gels seeded at a volume of 200 µL containing 1.0 x 10⁵ cells/mL, all gels were crosslinked for 60 min at 37 °C. (B) Collagen 4 mg/mL 60 min after crosslinking, gel appeared flat and had bubbles. (C) Insert on the left fibrinogen 20 mg/mL, gel appear rounded, no bubbles present, insert on the right collagen 4 mg/mL, fibrinogen 20 mg/mL gel, gel is well rounded with no bubbles. (D) Collagen 4 mg/mL gel after being kept overnight at 37 °C, gel still contained a large amount of bubbles, some swelling of the gel has occurred. (E) Fibrinogen 20 mg/mL kept overnight at 37 °C. (F) Collagen 4 mg/mL, fibrinogen 20 mg/mL gel kept overnight at 37 °C. Please click here to view a larger version of this figure.
Determining cell seeding density
Based on the previous experience of working with hydrogels an experiment was setup to determine the optimal cell seeding density (data not shown)37. Cells were embedded into a combination of collagen and fibrinogen in the following concentration range (7.5 x 10⁵, 8.5 x 10⁵, 9.5 x 10⁵, 1.0 x 10⁶, 1.5 x 10⁶ and 2.0 x 10⁶ cells/mL), 2.0 x 10⁶ cells/mL was found to be the optimal seeding density.
Rheology
Ten formulations of the fibrinogen and collagen hydrogel combinations were evaluated by means of rheology, see Table 2. The aim was to determine which of these formulations could mimic liver stiffness seen during the development of HCC. Literature provided known liver stiffness values for rats, mice and humans during fibrosis, cirrhosis and HCC and the aim was to get as close as possible to these values28,29,30,31,32. The ten formulations as set out in Table 2 was prepared in triplicate and the storage modulus of each were determined using a rheometer, results shown in Figure 8.
| Formulation | Fibrinogen (mg/ml) | Collagen (mg/ml) |
| 1 | 60 | 2 |
| 2 | 50 | 2 |
| 3 | 40 | 2 |
| 4 | 30 | 2 |
| 5 | 20 | 2 |
| 6 | 10 | 2 |
| 7 | 20 | 5 |
| 8 | 20 | 4 |
| 9 | 20 | 3 |
| 10 | 20 | 1 |
Table 2: Collagen and fibrinogen combinations in various concentrations evaluated with Rheology to determine stiffness values
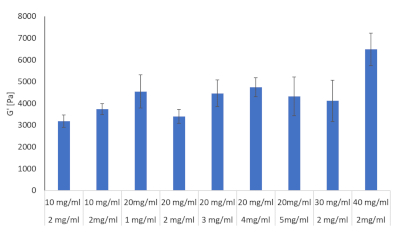
Figure 8: Hydrogel stiffness values for Collagen and fibrinogen combinations in various concentrations evaluated with Rheology. Storage modulus and loss modulus were determined at 37 °C and 1Hz by means of a Discovery HR-2 Hybrid Rheometer (n = 3, Error bars = SD). Please click here to view a larger version of this figure.
From these ten formulas three was chosen to proceed with. These included 2 mg/mL collagen type I and 10 mg/mL fibrinogen corresponding to liver stiffness values at the onset of fibrosis, 2 mg/mL collagen type I and 30 mg/mL fibrinogen corresponding to cirrhosis and 2 mg/mL collagen type I and 40 mg/mL fibrinogen corresponding to HCC, see Figure 9.
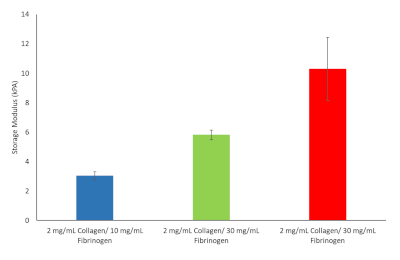
Figure 9: Hydrogel stiffness values for various Fibrinogen/Collagen hydrogel formulations chosen to continue with. Storage modulus and loss modulus were determined at 37 °C and 1 Hz (n = 3, Error bars = SD). Please click here to view a larger version of this figure.
Viability, drug response and metastatic potential
The results from the AlamarBlue assay showed an overall reduced cell viability within the 2D co-culture, lower than expected based on the known reported IC 25, 50 and 75 values, when compared to the untreated control, see Figure 10. This may be attributed to the LX2 cells in our co-culture that are more sensitive to Doxorubicin treatment. However, in our 3D model we noticed and increase in doxorubicin resistance, confirming the decrease in chemotherapeutic potential often seen in 3D model systems. Statistical significance compared to controls was assessed using the Student T test (two-tailed), with P<0.05 considered significant.
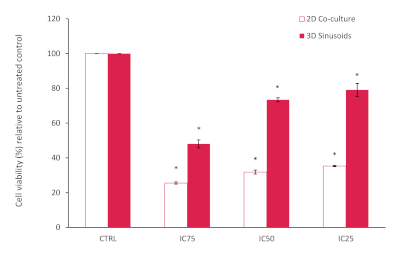
Figure 10: Percentage cell viability of a 2D co-culture model compared to the 3D model after treatment with Doxorubicin at various concentrations for a period of 72h. Results normalized relative to the untreated control (n=3, error bars = SD) (* = p<0.0001). Please click here to view a larger version of this figure.
The gel constructs were visually inspected daily using a light microscope to follow cell growth within different concentrations of the hydrogels. Cells filled up the hydrogels in a homogeneous and compact way, from day 7 spheroids started to assemble within the matrix.
Discussion
This protocol describes the development of a method to create a biomimetic model for HCC. A clear workflow has been established and the critical steps involved identified. These critical steps include, preparation of the fibrinogen stock solution, coating the inserts with collagen and seeding the cells imbedded into the hydrogel. During the preparation of the fibrinogen stock solution it is important to add the fibrinogen in smaller increments at higher concentrations. This will not only reduce the time it takes for the fibrinogen to dissolve but will also prevent the fibrinogen from gelling inconsistently and prematurely as seen in Figure 11. The preparation of the fibrinogen gel takes a considerable amount of time and this may influence the overall experimental success. Results indicates that once the fibrinogen gel starts to gel inconsistently it is best to discard it. The inserts should be coated with collagen, washed with PBS and dried within the laminar flow hood prior to seeding the cells embedded in hydrogels. Failure to ensure that the inserts are dry will result in the hydrogels spilling over the edges of the insert, resulting in an uneven gel. Unevenness of the gel will ultimately influence results where diffusion is a factor.
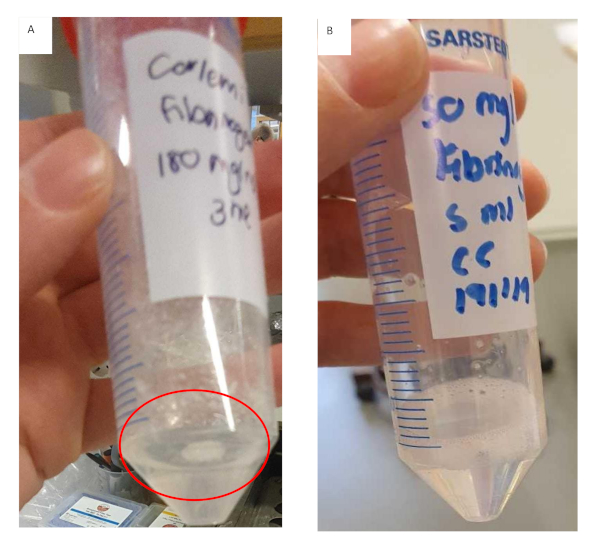
Figure 11: Preparation of fibrinogen gel for fibrinogen/collagen hydrogel formulations. (A) Fibrinogen gel solution that has formed clumps and started to gel prematurely with undissolved fibrinogen adhering to the tube. (B) Fibrinogen gel solution that has dissolved completely, solution is clear and slightly more viscous. Please click here to view a larger version of this figure.
It is recommended to work as fast as possible while seeding the hydrogel cell suspension onto the inserts, as the fibrinogen component will start to crosslink with the addition of thrombin. Prepare smaller working volumes at a time when working with gel suspensions at higher concentrations to prevent the gel from crosslinking while seeding. The latter will have an effect on the distribution and the amount of gel seeded onto each well. The order of adding the components is critical, in this protocol we provided a streamlined workflow to prevent gels from crosslinking prematurely. Due to the viscosity of the hydrogel gel suspension working with a cut pipette tip is advised during mixing and measuring. When mixing the suspension ensure that this is done quickly and evenly to create a homogenous suspension. Uneven mixing will result in a heterogeneous gel which will negatively affect results, see Figure 12.
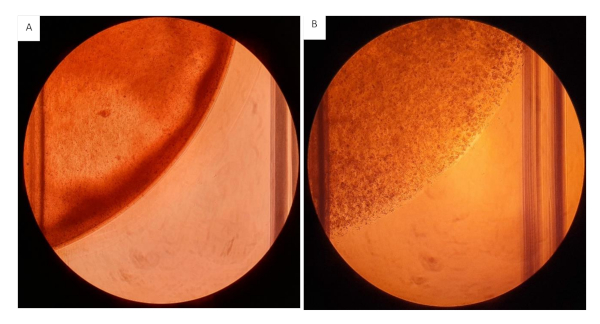
Figure 12: Collagen/fibrinogen gels seeded onto 12 well plates. All gels seeded at a volume of 200 µL containing 2mg/mL Collagen and 20 mg/mL Fibrinogen with 2.0 x 10⁶ cells/mL. (A) Hydrogel gel with heterogeneous consistency, visible uneven distribution of the hydrogels. (B) Hydrogels homogenously mixed. Please click here to view a larger version of this figure.
Following the protocol optimization, the model was evaluated to determine the models bio-physical properties. Rheology data showed that our model, composed of physiologically relevant extracellular matrix components namely collagen type I and fibrinogen, was able to mimic the bio-physical properties of a fibrotic, cirrhotic and HCC liver28,29,30,31,32. Recapitulating liver stiffness in 3D models for HCC is of considerable importance and is often overlooked during model development. Increased liver stiffness is related to chemotherapeutic resistance, proliferation, migration, and dormancy within in HCC38. While the activation of hepatic stellate cells in HCC is associated with increased extracellular matrix rigidity, with several signaling pathways associated with these hepatic stellate cells showing mechanosensitivity39.
The inclusion of stroma associated cells such as hepatic stellate cells and endothelial cell in the development of 3D models for HCC has become increasingly relevant. Studies show that multicellular spheroids composed of hepatic stellate and HCC cells resulted in increased chemotherapeutic resistance and invasive migration, while mimicking HCC tumor appearance in vivo, when compared to a PXT mice model and human HCC tissue samples17. A similar study by Jung et al., 2017 found multicellular spheroid consisting of hepatocellular carcinoma (Huh-7) and endothelial (HUVEC) cells promoted vascularization and aggressiveness22. These spheroids showed viability at significantly higher concentrations of doxorubicin and sorafenib when compared to Huh-7 monoculture spheroids22. The evaluation of our model’s viability and response to doxorubicin, with stiffness values corresponding to that of HCC and the inclusion of stroma associated cells (LX2 and HUVEC), showed a similar decreased in response to chemotherapeutics when compared to a 2D co-culture model. Thus, effectively mimicking drug resistance typically seen in patients and other 3D HCC models.
As this is a modular system the model can be fortified by the addition of other extracellular matrix components namely, laminin and hyaluronic acid. Alternatively, the current hydrogels used within this model can be replace by synthetic hydrogels such as sodium alginate or chitosan. Further modifications to the current model can be the substitution of the cell lines with primary cell cultures to produce an even more physiologically relevant model or using combinations of other tumor and stromal cell lines.
We have thus successfully developed a 3D model with tunable bio-physical properties for studying tumor-stroma interactions in HCC. We have found our model to be more representative of the in vivo situation when compared to traditional 2D cultures in response to doxorubicin. However, there is still much to be done, we hope to extensively characterize this model and explore the model as a possible metastatic platform to answer more complex and pressing questions that remain in the study HCC.
Disclosures
The authors have nothing to disclose.
Acknowledgements
This research was funded through grants obtained from the Swedish Cancer Foundation (Cancerfonden, CAN2017/518), the Swedish society for medical research (SSMF, S17-0092), the O.E. och Edla Johanssons foundation and the Olga Jönssons foundation. These funding sources were not involved in the study design; collection, analysis and interpretation of data; writing of the report; and in the decision to submit the article for publication. 3D printing of custom designed spacers used in this protocol was performed at U-PRINT: Uppsala University’s 3D-printing facility at the Disciplinary Domain of Medicine and Pharmacy, U-PRINT@mcb.uu.se. We would like to thank Paul O´Callaghan for his valuable input on our project.
Materials
| Name | Company | Catalog Number | Comments |
|---|---|---|---|
| AlamarBlue (Resazurin sodium salt) | Sigma | 211-500 | Prepare according to manufacturesr recommendations |
| Antibiotic Antimycotic Solution (100×), Stabilized | Sigma | A5955-100ML | |
| Aprotinin Protease Inhibitor | Thermo Fisher Scientific | 78432 | |
| Calcium chloride (CaCl2) | Sigma | C1016-2.5KG | Anhydrous, granular, ≤7.0 mm, ≥93.0% |
| CO2 Incubator | Kebo Biomed Sweden | ||
| Corning Black, clear flat bottom 96-well plate | Sigma | CLS3904-100EA | |
| Corning HTS Transwell-24 well permeable supports | Sigma | CLS3396-2EA | HTS Transwell-24 units w/ 0.4 μm pore polycarbonate membrane and 6.5 mm inserts, TC-treated, sterile, 2/cs |
| Discovery Hybrid Rheometer 2 | TA instruments, Sollentuna, Sweden | ||
| DMEM, high glucose, GlutaMAX supplement (LX2 and HepG2 cells) | Thermo Fisher Scientific | 61965059 | Supplemented with 10% v/v FBS and 1% v/v antibiotic antimycotic solution |
| Endothelial Cell Growth Medium (500 ml) (HUVEC) | Cell Applications, Inc | 211-500 | |
| Fetal Bovine Serum, qualified, One Shot format, New Zealand | Thermo Fisher Scientific | A3160902 | |
| Fibrinogen type I-S from bovine plasma | Sigma | F8630-10G | |
| FLUOstar Omega plate reader | BMG Labtech | ||
| Hanks' balanced salt solution | Sigma | H9394-500ML | Modified, with sodium bicarbonate, without calcium chloride and magnesium sulfate |
| Labogene scanspeed 416 centrifuge | Labogene, Sweden | ||
| Laminar flow hood | Kebo Biomed Sweden | ||
| Mettler Toledo AG245 Analytical Balance | Mettler Toledo | ||
| Nikon TMS Light microscope | Nikon, Japan | ||
| Phosphate buffered saline tablet | Sigma | P4417-100TAB | Prepare according to manufacturers recommendation |
| Rat tail Collagen Type I 5 mg/mL | Ibidi | 50201 | |
| Sodium chloride (NaCl) | Sigma | S7653-1KG | |
| Sodium Hydroxide (NaOH) | Merck | B619298 | |
| TC20 Automated cell counter | BioRad | ||
| TC20 cell counter counting slides | BioRad | ||
| Thrombin from bovine plasma | Sigma | T9549 | Powder, suitable for cell culture, ≥1,500 NIH units/mg protein (E1%/280 = 19.5) |
| Trypsin (2.5%) 10x | Thermo Fisher Scientific | Dilute to 1x in PBS | |
| Trypsin inhibitor from Glycine max (soybean) | Sigma | T6414-100ML | Solution, sterile-filtered |
References
- Galle, P. R., et al. EASL Clinical practice guidelines: Management of hepatocellular carcinoma. Journal of Hepatology. 69, 182-236 (2018).
- Marquardt, J. U., Andersen, J. B., Thorgeirsson, S. S. Functional and genetic deconstruction of the cellular origin in liver cancer. Nature Reviews Cancer. 15, 653-667 (2015).
- Balogh, J., et al. Hepatocellular Carcinoma: A review. Journal of Hepatocellular Carcinoma. 3, 41-53 (2016).
- Perumpail, R. B., Womg, R. J., Ahmed, A., Harrison, S. A. Hepatocellular carcinoma in the setting of non-cirrhotic non-alcoholic fatty liver disease and the metabolic syndrome: US experience. Digestive Diseases and Science. 60, 3142-3148 (2016).
- Baglieri, J., Brenner, D. A., Kisseleva, T. The role of fibrosis and liver associated fibroblasts in the pathogenesis of hepatocellular carcinoma. International Journal of Molecular Sciences. 20, 1723(2019).
- Arriazu, E., et al. Extracellular matrix and liver disease. Antioxidants & Redox Signaling. 21 (7), 1078-1097 (2014).
- Malarkey, D. E., Johnson, K., Ryan, L., Boorman, G., Maronpot, R. R. New insight into functional aspects of liver morphology. Toxicologic Pathology. 33, 27-34 (2005).
- Moreira, R. K. Hepatic stellate cells and liver fibrosis. Archive of Pathology and Lab Medicine. 131, 1728-1734 (2007).
- Hernandez-Gea, V., Toffanin, S., Friedman, S. L., Llovet, J. M. Role of the microenvironment in the pathogenesis and treatment of hepatocellular carcinoma. Gastroenteroloy. 144, 512-527 (2013).
- Amicone, L., Marchetti, A. Microenvironment and tumor cells: two targets for new molecular therapies of hepatocellular carcinoma. Translational Gastroenterology and Hepatology. 3, 24(2018).
- Rawal, P., et al. Endothelial cell-derived TGF-B promotes epithelial-mesenchymal transition via CD133 in Hbx-Infected Hepatoma cells. Frontiers in Oncology. 9 (308), 1-9 (2019).
- Yoo, J. E., et al. Progressive enrichment of stemness features and tumour stromal alterations in multistep hepatocarcinogenesis. PLoS One. 12 (3), 0170465(2017).
- Landry, B. D., et al. Tumor-stroma interactions differentially alter drug sensitivity based on the origin of stromal cells. Molecular Systems Biology. 14, 8332(2018).
- Le, B. D., et al. Three-dimensional hepatocellular carcinoma/fibroblast model on a nanofibrous membrane mimics tumor cell phenotypic changes and anticancer drug resistance. Nanomaterials. 8 (64), 1-11 (2018).
- Lv, D., Hu, Z., Lu, L., Lu, H., Xu, X. Three-dimensional cell culture: A powerful tool in tumor research and drug discovery (Review). Oncology Letters. 14, 6999-7010 (2017).
- Hoarau-Véchot, J., Rafii, A., Touboul, C., Pasquier, J. Halfway between 2D and animal models: Are 3D cultures the ideal tool to study cancer-microenvironment interactions. International Journal of Molecular Sciences. 19 (181), 1-24 (2018).
- Khawar, I. A., et al. Three Dimensional Mixed-Cell Spheroids Mimic Stroma-Mediated Chemoresistance and Invasive Migration in hepatocellular carcinoma. Neoplasia. 20, 800-812 (2018).
- Elliott, N. T., Yuan, F. A review of three-dimensional in vitro tissue models for drug discovery and transport studies. Journal of Pharmaceutical Sciences. 100 (1), 59-74 (2010).
- Nath, S., Devi, G. R. Three-dimensional culture systems in cancer research: focus on tumor spheroid model. Pharmacology Therapy. 163, 94-108 (2016).
- Zanoni, M., et al. 3D tumor spheroid models for in vitro therapeutic screening: a systematic approach to enhance the biological relevance of data obtained. Scientific Reports. 6, 19103(2016).
- Bell, C. C., et al. Characterization of primary human hepatocyte spheroids as a model system for drug-induced liver injury, liver function and disease. Scientific Reports. 6, 25187(2016).
- Jung, H. R., et al. Cell spheroids with enhanced aggressiveness to mimic human liver cancer in vitro and in vivo. Scientific Reports. 7, 10499(2017).
- Eilenberger, C., Rothbauer, M., Ehmoser, E. -K., Ertl, P., Küpcü, S. Effect of spheroidal age on sorafenib diffusivity and toxicity in a 3D hepg2 spheroid model. Scientific Reports. 9, 4863(2019).
- Wrzesinski, K., Fey, S. J. After trypsinisation, 3D spheroids of C3A hepatocytes need 18 days to re-establish similar levels of key physiological functions to those seen in the liver. Toxicology Research. 2 (2), 123-135 (2013).
- Wrzesinski, K., et al. Human liver spheroids exhibit stable physiological functionality for at least 24 days after recovering from trypsinisation. Toxicology Research. 2 (3), 163-172 (2013).
- Mazza, G., et al. Decellularized human liver as a natural 3D-scaffold of liver bioengineering and transplantation. Scientific Reports. 5, 13079(2015).
- Ma, X., et al. Rapid 3D bioprinting of decellularized extracellular matrix with regionally varied mechanical properties and biomimetic microarchitecture. Biomaterials. 185, 310-321 (2018).
- Mueller, S., Sandrin, L. Liver stiffness: a novel parameter for the diagnosis of liver disease. Hepatic Medicine: Evidence and Research. 2, 49-67 (2010).
- Wang, M. H., et al. In vivo quantification of liver stiffness in a rat model of hepatic fibrosis with acoustic radiation force. Ultrasound in Medicine & Biology. 35 (10), 1709-1721 (2009).
- Georges, P. C., et al. Increased liver stiffness of the rat liver precedes matrix deposition: implications for fibrosis. American Journal of Physiology - Gastrointestinal and Liver Physiology. 293, 1147-1154 (2007).
- Massironi, S., et al. et al. Liver stiffness and hepatocellular carcinoma: is it really useful. Journal of Hepatology. 58, 293(2013).
- Singh, S., et al. Liver stiffness is associated with risk of decompensation, liver cancer, and death in patients with chronic liver diseases: A systematic review. Clinical Gastroenterology and Hepatology. 11, 1573-1584 (2013).
- Yang, T. S., Wang, C. H., Hsieh, R. K., Chen, J. S., Fung, M. C. Gemcitabine and doxorubicin for the treatment of patients with advanced hepatocellular carcinoma: a phase I-II trail. Annals of Oncology. 13, 1771-1778 (2002).
- Le Grazie, M., Biagini, M. R., Tarocchi, M., Polvani, S., Galli, A. Chemotherapy for hepatocellular carcinoma: the present and the future. World Journal of Hepatology. 9 (21), 907-920 (2017).
- Saneyasu, T., Akhtar, R., Sakai, T. Molecular cues guiding matrix stiffness in liver fibrosis. BioMed Research International. 2016, 1-11 (2016).
- Zuliani-Alvarez, L., Midwood, K. S. Fibrinogen-related proteins in tissue repair: how a unique domain with common structure controls diverse aspects of wound healing. Advances in Wound Care. 4 (5), 273-285 (2015).
- Smit, T., et al. Characterization of an alginated encapsulated LS180 spheroid model for anti-colorectal cancer compound screening. ACS Medicinal Chemistry Letters. 11 (5), 1014-1021 (2020).
- Schrader, J., et al. Matrix stiffness modulates proliferation, chemotherapeutic response, and dormancy in hepatocellular carcinoma cells. Hepatology. 53 (4), 1192-1205 (2011).
- Lachowski, D., et al. Matrix stiffness modulates the activity of MMP-9 and TIMP-1 in hepatic stellate cells to perpetuate fibrosis. Scientific Reports. 9, 7299(2018).
Reprints and Permissions
