The neuron-glial interactions in neurodegeneration are not well understood due to inadequate tools and methods. Here, we describe optimized protocols to obtain induced neurons, oligodendrocyte precursor cells, and oligodendrocytes from human pluripotent stem cells and provide examples of the values of these methods in understanding cell-type-specific contributions in Alzheimer’s disease.
A subscription to JoVE is required to view this content. Sign in or start your free trial.
Method Article
Generation of Human Neurons and Oligodendrocytes from Pluripotent Stem Cells for Modeling Neuron-Oligodendrocyte Interactions
* These authors contributed equally
In This Article
Erratum Notice
Important: There has been an erratum issued for this article. View Erratum Notice
Summary
Abstract
In Alzheimer’s disease (AD) and other neurodegenerative disorders, oligodendroglial failure is a common early pathological feature, but how it contributes to disease development and progression, particularly in the gray matter of the brain, remains largely unknown. The dysfunction of oligodendrocyte lineage cells is hallmarked by deficiencies in myelination and impaired self-renewal of oligodendrocyte precursor cells (OPCs). These two defects are caused at least in part by the disruption of interactions between neuron and oligodendrocytes along the buildup of pathology. OPCs give rise to myelinating oligodendrocytes during CNS development. In the mature brain cortex, OPCs are the major proliferative cells (comprising ~5% of total brain cells) and control new myelin formation in a neural activity-dependent manner. Such neuron-to-oligodendrocyte communications are significantly understudied, especially in the context of neurodegenerative conditions such as AD, due to the lack of appropriate tools. In recent years, our group and others have made significant progress to improve currently available protocols to generate functional neurons and oligodendrocytes individually from human pluripotent stem cells. In this manuscript, we describe our optimized procedures, including the establishment of a co-culture system to model the neuron-oligodendrocyte connections. Our illustrative results suggest an unexpected contribution from OPCs/oligodendrocytes to the brain amyloidosis and synapse integrity and highlight the utility of this methodology for AD research. This reductionist approach is a powerful tool to dissect the specific hetero-cellular interactions out of the inherent complexity inside the brain. The protocols we describe here are expected to facilitate future studies on oligodendroglial defects in the pathogenesis of neurodegeneration.
Introduction
Oligodendrocyte lineage cells—including oligodendrocyte precursor cells (OPCs), myelinating oligodendrocytes, and transitional types in between—constitute a major group of human brain cells1 that actively participate in many critical functions for the proper operation and maintenance of our central nervous system throughout neural development and aging2,3,4. While oligodendrocytes are well known for producing myelin to facilitate neuronal activity transmission and support axonal health in white matter, OPCs are abundant (~5%) in gray matter....
Access restricted. Please log in or start a trial to view this content.
Protocol
1. Human neuron induction from human pluripotent stem cells
- Lentivirus preparation (~5 days, detailed protocol as described previously16)
- Plate ~1 million HEK293T cells each T75 flask, to have them ~40% confluent when performing transfection. Transfect them with plasmids expressing tetracycline-inducible Ngn2 and puromycin-resistant gene (PuroR; under the same TetO promoter control), rtTA and the three helper plasmids pRSV-REV, pMDLg/pRRE, and VSV-G (12 µg of lentiviral vector DNA and 6 µg of each of the helper plasmid DNA). Prepare at least three flasks per lentivirus preparation. Use PEI for transfection foll....
Access restricted. Please log in or start a trial to view this content.
Results
Direct generation of human induced neurons from human pluripotent stem cells
It is very important that the starting human pluripotent stem cells exhibit a high degree of pluripotency for successful generation of iNs or iOPCs/iOLs. Therefore, cells should be stained for specific markers, such as Oct4 and SOX2, before starting either of the induction protocols described in the present manuscript (Figure 1A). Human H1 cells were used to obtain induced excitatory forebrain n.......
Access restricted. Please log in or start a trial to view this content.
Discussion
In addition to the physical and metabolic support to stabilize the synapse structures and to facilitate the saltatory signal conduction by myelination, oligodendrocyte lineage cells can shape neuronal activity pattern via rapid and dynamic cross-talks with neurons5,6,7. While in AD pathology the oligodendroglial responses were initially regarded as merely secondary to inflammation and oxidative stresses, there is now promising e.......
Access restricted. Please log in or start a trial to view this content.
Disclosures
The authors have nothing to disclose.
Acknowledgements
This work was supported by the grants from National Institutes of Health (R00 AG054616 to Y.A.H. and T32 GM136566 to K.C.), Stanford University School of Medicine and a Siebel Fellowship (awarded to S.C.). Y.A.H. is a GFL Translational Professor from the Center for Translational Neuroscience in the Brown Institute for Translational Sciences.
....Access restricted. Please log in or start a trial to view this content.
Materials
| Name | Company | Catalog Number | Comments |
|---|---|---|---|
| Accutase | STEMCELL Technologies | 7920 | |
| B27 supplement | ThermoFisher | 17504044 | |
| bFGF | ThermoFisher | PHG 0266 | |
| cAMP | MilliporeSigma | A9501 | |
| Clemastine | MilliporeSigma | SML0445 | |
| DMEM/F12 medium | STEMCELL Technologies | 36254 | |
| DMSO | ThermoFisher | D12345 | |
| Doxycycline | MilliporeSigma | D3072 | |
| Fetal Bovine Serum | ScienCell | 10 | |
| H1 human ES cells | WiCell | WA01 | |
| Matrigel | Corning | 354234 | |
| mTeSR plus | STEMCELL Technologies | 5825 | |
| N2 supplement | ThermoFisher | 17502001 | |
| Neurobasal A medium | ThermoFisher | 10888-022 | |
| Non Essential Amino Acids | ThermoFisher | 11140-050 | |
| PDGF-AA | R&D Systems | 221-AA-010 | |
| PEI | VWR | 71002-812 | |
| pMDLg/pRRE | Addgene | 12251 | |
| Polybrene | MilliporeSigma | TR-1003-G | |
| pRSV-REV | Addgene | 12253 | |
| Puromycin | ThermoFisher | A1113803 | |
| ROCK Inhibitor Y-27632 | STEMCELL Technologies | 72302 | |
| SAG | Tocris | 4366 | |
| STEMdiff Neural Progenitor Freezing Media | STEMCELL Technologies | 5838 | |
| STEMdiff SMADi Neural Induction Kit | STEMCELL Technologies | 8581 | |
| T3 triiodothyronine | MilliporeSigma | T6397 | |
| Tempo-iOlogo: Human iPSC-derived OPCs | Tempo BioScience | SKU102 | |
| TetO-Ng2-Puro | Addgene | 52047 | |
| VSV-G | Addgene | 12259 |
References
- Pelvig, D. P., Pakkenberg, H., Stark, A. K., Pakkenberg, B. Neocortical glial cell numbers in human brains. Neurobiology of Aging. 29 (11), 1754-1762 (2008).
- Barres, B. A. The mystery and magic of glia: a perspective on their roles in health and disease. Neuron. 6....
Access restricted. Please log in or start a trial to view this content.
Reprints and Permissions
Erratum
Formal Correction: Erratum: Generation of Human Neurons and Oligodendrocytes from Pluripotent Stem Cells for Modeling Neuron-Oligodendrocyte Interactions
Posted by JoVE Editors on 12/29/2020. Citeable Link.
An erratum was issued for: Generation of Human Neurons and Oligodendrocytes from Pluripotent Stem Cells for Modeling Neuron-Oligodendrocyte Interactions. The Representative Results section has been updated.
Figure 3 was updated from:
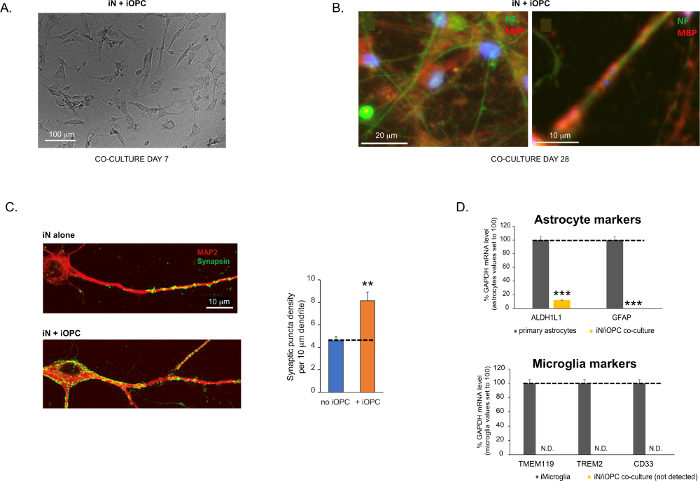
Figure 3: Co-culture of iNs and iOPCs. (A) Representative bright field image of co-cultured iNs and iOPCs at Day 7, showing a proper density for further maturation. (B) Representative immunofluorescence image of iNs and iOPCs co-cultured for 28 days. Axonal marker neurofilament NF is shown in green and oligodendrocytic marker MBP in red. Right, a segment of iN axon ensheathed by iOL process (MBP+). (C) Synapse formation assayed in 4-week-old co-cultures. Cells were stained for Synapsin 1 (Syn1, green) and MAP2 (red), and synaptic puncta were quantified by confocal analysis of density along the dendritic segments as described17,18. (D) In our co-cultures of iNs and iOPCs (7 days of co-culturing), the expression of astrocyte markers, ALDHL1 and GFAP, is minimal (top), and the expression of microglia markers, TMEM119, TREM2, and CD33, is not detected (N.D.) by qPCR. The contamination from these two glial cell types is thus excluded. Please click here to view a larger version of this figure.
to:
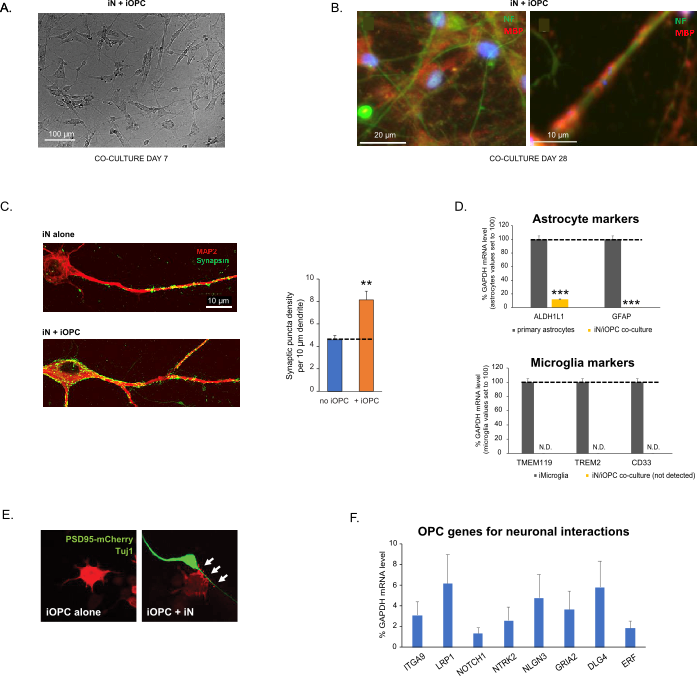
Figure 3: Co-culture of iNs and iOPCs. (A) Representative bright field image of co-cultured iNs and iOPCs at Day 7, showing a proper density for further maturation. (B) Representative immunofluorescence image of iNs and iOPCs co-cultured for 28 days. Axonal marker neurofilament NF is shown in green and oligodendrocytic marker MBP in red. Right, a segment of iN axon ensheathed by iOL process (MBP+). (C) Synapse formation assayed in 4-week-old co-cultures. Cells were stained for Synapsin 1 (Syn1, green) and MAP2 (red), and synaptic puncta were quantified by confocal analysis of density along the dendritic segments as described17,18. (D) In our co-cultures of iNs and iOPCs (7 days of co-culturing), the expression of astrocyte markers, ALDHL1 and GFAP, is minimal (top), and the expression of microglia markers, TMEM119, TREM2, and CD33, is not detected (N.D.) by qPCR. The contamination from these two glial cell types is thus excluded. (E) Coculturing iOPC with iN leads to the formation of neuron-OPC synapses. The fluorescence-tagged post-synaptic marker PSD95-mCherry is expressed only in OPCs, and display a diffuse pattern in single cultures (left) but aggregate to form puncta in cocultures (right, indicated by arrows; Tuj1, neuronal marker). (F) The expression of well-characterized oligodendroglial genes that can sense and respond to neuronal activities in the pure cultures of iOPCs at Day 14. Please click here to view a larger version of this figure.
The fourth paragraph was updated from:
Co-culturing of iNs and iOPCs
This protocol is optimized specifically for co-culturing iNs and iOPCs and allow our real-time monitoring of the inter-cellular communications between these two cell types along the course of neural development. The ideal plating densities for both cell types need to be decided with a series of cell number titration to achieve proper differentiation (Figure 3A). After 4 weeks in co-cultures, the iOPCs are expected to be adequately differentiated into OLs that are positive for specific markers such as MBP and extend processes to ensheath axons (Figure 3B). The co-culture system can robustly boost up the number of synapses, indicating that the iOPCs provide a neuronal support through physical contacts or release of trophic factors (Figure 3C). We can maintain the co-cultures in acceptable health condition for up to 6 weeks and observe that the synapse number and other neuronal attributes plateau around the fifth week. Of note, astrocytes and microglia are not present in our preparations and their absence can be documented by checking the expression of specific markers (Figure 3D).
to:
Co-culturing of iNs and iOPCs
This protocol is optimized specifically for co-culturing iNs and iOPCs and allow our real-time monitoring of the inter-cellular communications between these two cell types along the course of neural development. The ideal plating densities for both cell types need to be decided with a series of cell number titration to achieve proper differentiation (Figure 3A). After 4 weeks in co-cultures, the iOPCs are expected to be adequately differentiated into OLs that are positive for specific markers such as MBP and extend processes to ensheath axons (Figure 3B). The co-culture system can robustly boost up the number of synapses, indicating that the iOPCs provide a neuronal support through physical contacts or release of trophic factors (Figure 3C). We can maintain the co-cultures in acceptable health condition for up to 6 weeks and observe that the synapse number and other neuronal attributes plateau around the fifth week. Of note, astrocytes and microglia are not present in our preparations and their absence can be documented by checking the expression of specific markers (Figure 3D). The iOPCs express a good number of well-characterized genes that can potentially respond to and mediate the activity-dependent signals from neighboring neurons, in a paracrine (e.g. neurotrophins and metabolites) and/or a synaptic manner (Figure 3E and 3F).
