Waiting
Login processing...

Trial ends in Request Full Access Tell Your Colleague About Jove

Biology

Field-Based Thermal Physiology Assay: Cold Shock Recovery under Ambient Conditions

Published: March 9, 2021 doi: 10.3791/62218

Summary

Here, a low-cost, accessible protocol is described to evaluate cold shock recovery of butterflies under ambient environmental conditions.

Abstract

Ecological physiology, particularly of ectotherms, is increasingly important in this changing world as it uses measures of species and environmental traits to explore the interactions between organisms and their surroundings to better understand their survival and fitness. Traditional thermal assays are costly in terms of time, money, and equipment and are therefore often limited to small sample sizes and few species. Presented here is a novel protocol that generates detailed data on individual behavior and physiology of large, volant, terrestrial insects, using the example of butterflies. This paper describes the methods of a cold shock recovery assay that can be performed in the field under ambient environmental conditions and does not require costly laboratory equipment. This method has been used to understand the response and recovery strategy to cold shock of tropical butterflies, generating individual level data across entire butterfly communities. These methods can be employed in both remote field settings and classrooms and can be used to generate ecologically relevant physiological data and as a teaching tool.

Introduction

The integration of thermal physiology and ecology in the late 1970s and early 1980s1,2 launched the field of ecological physiology. Extensive thermal studies conducted on ectotherms highlight ecological-physiological synergies across diverse eco-evolutionary contexts3,4,5. Research on thermal physiology of ectothermic organisms has regained attention recently in the face of climate change and altered thermal landscapes across the world6,7. In addition to informing studies in the academic field of ecological physiology, thermal physiology assays can be broadly accessible to researchers and can serve as a hands-on teaching approach for all levels. Components of thermal performance, including thermal limits and effects of temperature shocks, are fundamental to the ecology, behavior, and life history of animals8,9.

Specifically, ecototherms are used to address questions of physiology, as endothermy dictates an inextricable link between ambient and organismal temperature. The temperature range that organisms can withstand (their critical thermal minimum to maximum-thermal range) and the temperatures at which their behaviors and fitness are maximized (thermal optima) are often rooted in ecological and evolutionary processes. These physiological traits are of increasing importance as temperatures, both means and extremes, are increasing10. For example, the abiotic changes, including temperature increases, that accompany habitat destruction and fragmentation has affected communities of ectotherms, including anurans, limiting physiologically fragile species (with narrow thermal tolerance) to small remnant habitat patches11,12.

Assessing key components of thermal performance can be expensive both in terms of time and resources and traditionally requires laboratory equipment and standardized conditions. Moreover, conventional assays often do not reflect the breadth of ambient conditions experienced in nature by a given animal13 as temperature in similar physiology experiments is carefully controlled and often unrelated to ambient conditions experienced by an animal. This temperature control can diminish the understanding of variation in individual responses2,14. Physiologists have relied on laboratory-based heating and cooling experiments, using programmable water baths to steadily heat or cool an animal's environment to inform thermal performance curves15.

Typically, animals are placed in vials with a thermocouple, and their ambient temperature is changed steadily by controlling the temperature of the surrounding water bath. Researchers measure the time it takes to achieve an altered physiological state (e.g., chill coma, knockdown) and the temperature at which the status change occurred16,17. Starting at a minimum of USD $500, these tools are large, heavy, and require additional technical equipment (e.g., computer, thermocouples). Consequently, the basic tools to carry out classic methods of assessing thermal performance are 1) not economically accessible to all, 2) not suitable for assaying animals too large to be contained in customary vials used for small dipterans, and 3) not portable for use in remote field settings. Adherence to common practice has resulted in limited representation across taxonomy and experimental conditions18,19,20.

While complete thermal performance curves can inform species distribution, life history traits, and behavior, among other traits, the quantification of fewer and simpler thermal metrics can be more efficient and still extremely informative. Physiological assays, measuring chill coma onset and subsequent cold shock recovery, cold-hardening, and righting behavior, are effective and executable proxies for the critical thermal minimum of an organism8. Described here is a cold shock assay useful for eliciting physiological data from large terrestrial ectothermic insects. The assay is affordable, accessible, and easy to execute under field conditions or in the classroom. Data on cold shock recovery generated by this protocol can be coupled with species or individual-level trait data to pursue questions regarding ecological physiology and/or used to teach students about physiological principles.

Protocol

1. Identification of species of interest

  1. Identify species of interest to determine cold shock recovery time. Keep in mind that each group will differ in the time it takes to induce a chill coma (i.e., the point at which the insect is still alive, but is not moving and not responsive). Likewise, based on the organism and use of data, choose different cutoff points at which to stop the experiment if the focal individual(s) do not fly (see section 4).
    ​NOTE: This protocol was designed and developed for use on Lepidoptera. However, it is applicable to large, volant, terrestrial insects, in particular, those that can be stored flat in glassine envelopes restricting movement and damage (e.g., butterflies and dragonflies/damselflies).

2. Conducting a pretrial

  1. Conduct a pretrial on a small sample of individuals to determine the key parameters. Follow sections 3 through 5 of the protocol below with 5-10 individuals for a pretrial.
    1. Test the time required on ice to induce a chill coma (not moving), but not kill the focal species by following step 5.1 using treatments of 30 min, 60 min, and 90 min.
      NOTE: The time required to induce a chill coma will depend on the size, location, and natural history/behavior of the individuals.
    2. Based on results from steps 4.1-4.4 and using knowledge of the ecology of the focal insects, choose a time at which to conclude the trial if a given individual does not make a full recovery. Base this time cutoff on ecology of the species as well, keeping in mind that after many minutes of being incapable of flight, many insects are predated.
      ​NOTE: For example, if most preliminary trials end in flight after 15 min, one could decide to end trials after 25 min to ensure that even outliers have a chance to fully recover (i.e., fly). This protocol is based on a 30 min cutoff time (step 5.4).
  2. Use parameters from pretrial data to inform data collection for the experiments. Modify the protocol described below based on the needs of the focal organisms, including time in the ice slurry, time at which to call trials to an end, and behaviors documented on the data sheet (e.g., shiver may be an inappropriate behavior for the insect of choice).
    1. Define specific research questions to be answered with these data while refining the parameters.
      ​NOTE: For example, if the researcher is interested in the effect of prolonged exposure on recovery, the time in ice is a key variable to modify. If researchers are interested in differences in physiology between light and dark colored species, they can choose either two distinctly colored species or modify the insect's wing color to measure the effect of wing color on recovery time. Importantly, this method is highly customizable to the needs and research questions posed (see the discussion section).

3. Collection of insects

  1. Collect insects using appropriate methods such as baited traps and entomological nets, (Supplementary Figure 1). Upon collection, place each individual in a separate glassine envelope with a unique ID.
  2. Store animals in a shaded, cool place after being captured and before exposure to the cold shock experiment. Always expose the animal to the experimental treatment within 24 h of being captured, and standardize this time as much as possible across trials.
    1. Although storage conditions may vary, keep the insects out of direct sun. If possible, place them indoors in a cool, dark room.
    2. In the field, ensure that they will be shaded while stored and are protected from wind (blowing away) and other insect predators that may enter the envelopes.

4. Set up the cold shock experiment

  1. Fill a cooler with ice and water. Ensure that there is sufficient ice to persist for at least one hour, and add ice periodically as needed with the goal to maintain the environment in the water at 0 °C.
  2. Choose between 1 and 4 focal individuals for a round of experimentation, making sure that each individual is identifiable.
    1. If using multiple species, use only one of each to avoid confusing individuals on the datasheet. If experimenting with only one species, only use individuals that can easily be distinguished, for example by a broken wing or distinct marking.
    2. If the goal of the experiment is unrelated with wing coloration, mark the wings with unique IDs (e.g., numbers) with a fine felt-tipped marker to distinguish individuals.
    3. If the experiments meet neither of the above criteria, conduct the experiment on one individual at a time.
  3. Populate the rows of the data sheet with the information pertinent to each insect assayed including their unique ID and a useful identifier in the notes such as species name or distinguishing character (Supplementary Table 1).
  4. Place all focal individuals (still in their individually marked envelopes) in a sealed plastic bag with a weight (Table of Materials), and place the bag in ice water for 60 min (or until chill coma has been induced; see discussion) (Supplementary Figure 2).
    1. Ensure the weight is heavy (e.g., large coins, large washers, or smooth rocks) and large enough to keep the bag of insects submerged in the ice water and perpendicular to the surface of the water. Use a weight that does not cause leaks in the sealed plastic bag.
      ​NOTE: While insects are still able to recover if they are exposed directly to the water while submerged, wet envelopes complicate removal of each individual. It is best to maintain the insects dry in their bag.
  5. Record temperature and light data.
    1. Use a data logger (see the Table of Materials) to record ambient temperature and light data using either step 5.1 or 5.2.
      1. Program the data logger to collect temperature and light data at 10 s intervals, starting at the time that the insects will be released.
      2. Base the start time of the data logger on when the insects were placed in the ice water. Ensure that the data logger information (date, time) is synchronized so that data on ambient conditions may later be matched with each individual focal insect.
    2. Use a simple thermometer to record temperature and light data at short intervals by hand (by a second researcher).
      1. Decide on the experimental parameters to associate with recovery time that can be measured without a data logger. Use distinct treatments: shade/sun; twilight/mid-day.
  6. Place a mesh cage for the insects in an appropriate location so that the temperature and light environments are as homogenous as possible within the cage, and so that the base of the cage is elevated and can be tapped by the observer.
  7. Place the data logger just outside of the cage, or inside the cage so that it will not be knocked over or otherwise affected by small movements inside the cage. If not using a data logger, position a thermometer appropriately and/or set up the cages in the appropriate configuration.
    ​NOTE: The data logger must be placed so that the ambient conditions recorded are as close as possible to those that the insect is experiencing.

5. Start cold shock experiment

  1. Remove the animals from the ice water bath after 60 min (or time determined appropriate; see above). Immediately remove the insects from the plastic bag, and remove each individual from its envelope as quickly as possible while minimizing handling (Supplementary Figure 3).
  2. Start the stopwatch as soon as the animals are in the mesh cages (see example data, Supplementary Table 1).
  3. Tap the base of the cage with a pencil to agitate the recovering insects.
    NOTE: Providing stimuli during recovery ensures that the focal insects demonstrate recovery status and behaviors as soon as they are physiologically capable (Supplemental Video).
    1. Tap frequently and strongly enough to ensure that an animal will respond if possible, but not cause a response.
      ​NOTE: For example, when tapping the cage, if an animal is catapulted into the air and lands upright, but does not move to stand on its own, that is not considered a "stand" behavior, as the organism did not indeed stand on its own.
  4. Mark the trial as complete once an individual has flown (i.e., shown a full recover). End the trial and consider the insect to have achieved a full recovery if it does not move after 30 min.
  5. Remove the insects from the mesh cage, and place the individuals back into their labeled glassine envelopes. Liberate the animals or keep them for further data collection (e.g., individual traits of size, weight).
  6. If using a data logger, stop data logger data collection, and save the file of temperature and light data during the experiment with appropriate date/time information.

6. Data processing

  1. Enter the data presented from the datasheet into a spreadsheet (e.g., MS Excel).
  2. If using a data logger, add temperature and light data for each response of each individual assayed.
    1. Calculate the mean and standard deviation of the temperature and light for each behavior of each individual.
      ​NOTE: As the data logger logs data every 10 s, if the stand behavior for one animal took 48 s to occur, use the first 5 entries from the data logger for that trial.
    2. Associate each recovery behavior of each individual with abiotic data recorded by the datalogger, rounding up or down to 10 s intervals as necessary.
  3. Plot and analyze data. Figure 1, for example, visualizes the effect of temperature and light on cold shock recovery time. Compile other relevant data (species traits, regional habitat characteristics) to examine the ecological and evolutionary patterns in physiological traits of the groups tested.
    NOTE: Figure 1 was plotted using the ggplot2 package in R. The level of detail of data on ambient conditions will differ based on the instruments used to measure ambient conditions. If a data logger is used, figures with detail comparable to Figure 2 can be generated. If a thermometer is used, the researcher will not be able to create a plot informed by ambient light. Likewise, if researchers use categories of light or temperature, these scatterplots can be modified into boxplots or another appropriate template to illustrate these phenomena.

Representative Results

The data collected in this protocol allow for examination and partitioning of variables important to organismal physiology. For example, both temperature and light conditions contribute to the recovery of butterflies from cold shock (Figure 1). The plot is intended to explore the interaction between ambient conditions and cold shock recover. Using wild-caught butterflies from both traps and netting, 181 species of butterflies demonstrated distinct recovery from chill coma induced by cold shock (Figure 2). Data presented in Figure 2 were collected by three observers over approximately five months (January, February, May-July 2020) in the Colombian Andes. Experiments were always conducted on the morning after butterfly collection. At maximum efficiency, it was possible for two observers to simultaneously observe four butterflies each, repeated seven times (minimum 7.37 hours), resulting in the testing of 56 individuals on a single morning. This allowed for a great deal of data collection across entire butterfly communities while including and considering data on individual variation. As assays can occur under ambient environmental conditions, recovery conditions are representative of their habitats and reflect the natural variation experienced by organisms in nature. Figure 3 illustrates the overlap between temperature and light conditions of the cold shock recovery experiment and conditions in a pasture from which some tested butterflies were collected.

Figure 1
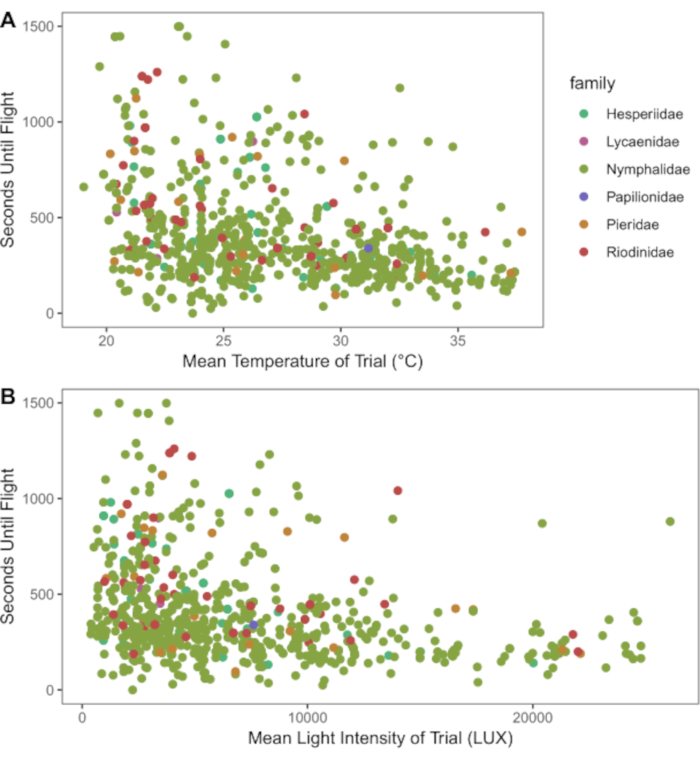
Figure 1: Scatterplots of recovery time (in seconds) of butterflies after cold shock. (A) Mean temperature and (B) mean LUX (light intensity) during their recovery. Species are organized and colored by Family. Overall, as light and temperature increase, cold shock recovery time decreases, showing variability across taxa. Please click here to view a larger version of this figure.

Figure 2
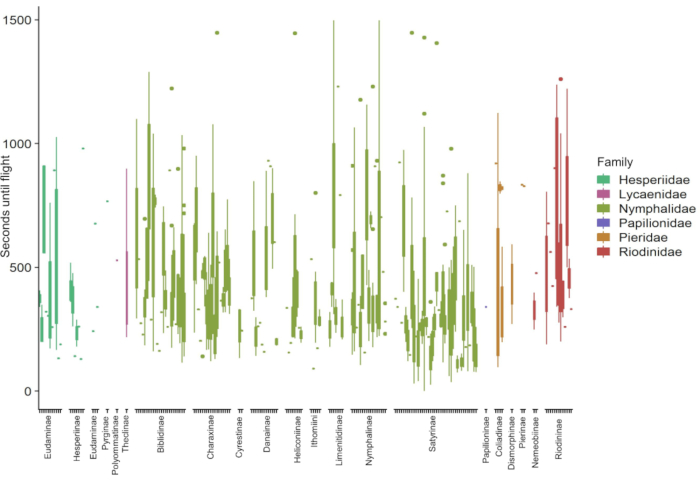
Figure 2: Example of results from the cold shock recovery assay on 181 species of butterfly from the Colombian Andes. The data represent the number of seconds that elapsed from removing the butterfly from cold and when it was able to fly. Species are organized and colored by Family. This figure demonstrates the taxonomic breadth across which this experiment can be successfully applied, and the variety of cold shock recovery responses across species. Please click here to view a larger version of this figure.

Figure 3
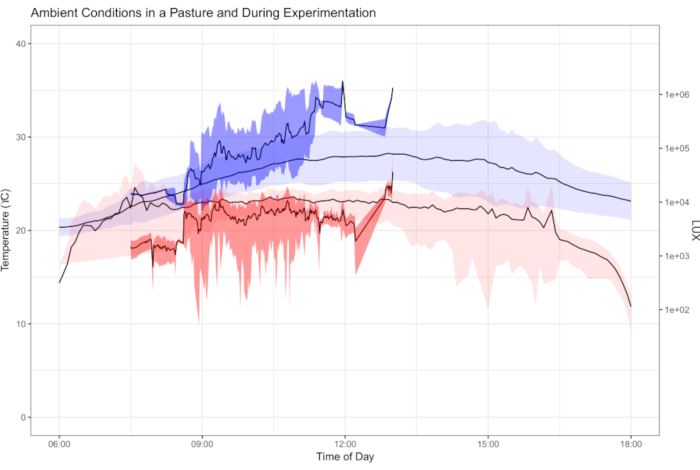
Figure 3: Ambient temperature and LUX during cold shock recovery trials. Plot of ambient temperature (blue) and LUX (light intensity, red) as recorded by data loggers placed in the pastures where butterfly collection took place (light colors, conditions span entire day) and conditions during cold shock recovery trials (dark colors, only morning hours). The ambient field conditions and experimental conditions plotted show the range of and average conditions experienced by butterflies over one week of field sampling and experimentation. Experiments were only conducted in early hours (07:00-13:00 h), while the dataloggers were deployed in the field for one week (daylight hours, 06:00-18:00 h shown). Shown here is the overlap between experimental conditions and ambient conditions experienced by butterflies, demonstrating the ecological relevancy of conducting physiology assays under ambient conditions. Please click here to view a larger version of this figure.

Supplementary Figure 1Procedure for collecting focal insects-in this case, butterflies-using baited Van-Someren traps and active netting. Traps were baited with both rotting fish and rotting fruit baits. Trap (without bait) in background, in the foreground is a specimen in its unique envelope against a blue plastic collection box. Please click here to download this File.

Supplementary Figure 2: Bags with up to four individual butterflies submerged in ice water in a cooler. Plastic bags were marked with the time they were placed in the ice water, so that cold shock experiments could be staggered through the morning. Plastic bags should be sealed to prevent specimens from getting wet; however, flooding of the bags and envelope in this case had no measurable effect on the recovery of the butterflies. Please click here to download this File.

Supplementary Figure 3: Two observers collect data in the field. Each mesh cage contains four unique butterflies recovering from cold shock. The polyvinyl chloride T-joint in the cage houses the data logger to prevent direct sun or rain exposure. Each observer has a stopwatch that was started immediately upon butterfly release into the cage. The cages are elevated by benches, permitting observers to agitate the base of the cage to ensure that the butterflies responded behaviorally as quickly as physiologically possible. Please click here to download this File.

Supplementary Table 1: Example data sheet. The sheet shows each butterfly's unique ID as assigned in the field and distinguishing characters (species name, key colors) in notes. Also recorded is the dominant position of the butterfly (i.e., which side of the wing was exposed to the sun) during the recovery period, noted as D (dorsal) or V (ventral). Please click here to download this Table.

Supplemental Video 1: Tapping of the cage for cold shock recovery. As butterflies recover, the observer taps the base of the cage gently to induce behaviors as soon as the butterflies are capable. Please click here to download this Video.

Discussion

The study of thermal physiology incorporates measures of species and environmental traits to better understand the interactions between organisms and their surroundings that are key to survival and fitness. While always integral to understanding the natural history and ecology of plants and animals, thermal traits are of increasing importance in the face of landscape and climate change11,21. Several groups of ectothermic terrestrial insects, in particular, lepidoptera and odonatan, are relatively large and abundant, exhibit distinct behaviors, and are amenable to manipulation. Outlined here is an efficient and low-cost assay to effectively measure physiological responses of such insects. This protocol requires a source of healthy organisms to assay, whose handling time prior to the experiment is limited. While flexible in the number of organisms assayed at one time, the number of focal individuals per experiment will vary based on the purpose of data collection and/or number of observers.

For example, this protocol was developed to collect detailed individual data on butterflies across entire communities. As such, the representative results illustrate an effort to maximize the data collection for individuals of as many species as possible and under a variety of conditions relevant to the local environment. Regardless of the number of focal species, it is crucial for the observer to be able to identify each individual in the cage experiencing the recovery. If the goal is to collect data from only one species, then only one or two individuals (if identifiable based on different wing wear or if individually marked) should be assayed at once. The study subjects must be chosen in accordance with a specific research question or plan of study. Based on the question posed and the purpose of data collection (research or classroom, for example), sample size and collection of other traits will differ.

To illustrate the fundamental components of physiology elucidated by this protocol (induction of chill coma, steps of recovery, role of ambient conditions), a classroom instructor may choose two distinct species or morphs of a single species. If the focal individuals differ only in one key trait (e.g., color), a smaller sample size will be necessary, and students can closely study the relationship of that trait and organismal physiology. Researchers interested in ecological physiology may use their experimental data to explore complex ecological and evolutionary questions. Researchers must be sure to carefully choose focal insects that directly address their questions (e.g., based on life stage, age, sex, location), and, based on the number of variables involved, determine the appropriate sample size. Sample sizes for complex models will be larger than those described above.

While collecting behavioral recovery data, it is key that the cage rest above the ground because the observer must be able to tap the bottom of the cage to elicit recovery behaviors. This ensures that the organism responds (stands, flies) as soon as it is physiologically capable of doing so, and the terminal recovery behavior (flight) is documented. Recording ambient conditions during the cold shock recovery is integral to the study of thermal physiology, as this protocol is designed to study and disentangle the role of environment in organismal physiology. Data loggers (see the Table of Materials) are useful to record standardized measures of relevant conditions (e.g., temperature, light, and even humidity). However, if these tools are unavailable, relevant conditions can be measured in other ways like with a digital thermometer or by simplifying the variable of environmental conditions and using distinct environments such as shade and sun. This protocol gives the researcher options to measure the conditions during cold shock recovery based on the purpose and scope of the study.

Although this method can be modified to better suit specific taxonomic groups, it is recommended that large, volant insects be used. Flying insects that regain their ability to fly independently may be considered to have accomplished a full recovery. The method, as described, was successfully used on butterflies in the tropics and subtropics. Based on the thermal trends of a given area (i.e., the range of temperatures experienced at a site that will vary, thus influencing expectations based on elevation, latitude, canopy cover), an organism may require more or less than one hour in an ice water bath to enter a chill coma. The size of the organism may also affect the time necessary to enter a chill coma. It is key to find the time of cold exposure necessary to induce a chill coma (not moving), but not kill focal species. The time required to induce a chill coma will depend on the size, location, and natural history/behavior of the individuals. Based on results from the cold shock experiment described herein and using knowledge of the ecology of the focal insects, choose a time at which to conclude the trial if a given individual does not make a full recovery.

Based on the specific questions of the researcher, this method can be employed either in the field or the laboratory to allow for both natural environmental variation and control for important variables, respectively. This assay is simple and inexpensive and helps to fill existing gaps in the field of thermal physiology. The ease of this protocol makes it accessible to employ for a diverse array of taxa, opening the field to more than lab-friendly organisms. The novelty of performing a standardized yet ambient thermal assay fills the gap between laboratory and field results22. Leveraging ambient conditions for organism recovery will help researchers partition the role of environmental and species factors in physiology14,22. Finally, because of its low cost and lack of required materials, this protocol can be used in remote locations in the field with little equipment-ideal for many field biologists-as well as in classrooms to allow young students a hands-on learning experience.

Disclosures

The author has no competing financial interests or other conflicts of interests.

Acknowledgments

Thanks to Jaret Daniels, Isabella Plummer, Brett Scheffers, and Dan Hahn for input on the protocol as it was first developed. Additional gratitude to Jaime Haggard, Sebastián Durán, and Indiana Cristóbal Róis-Málaver for implementing several iterations of this protocol and for input on key components. Thanks also to an anonymous reviewer for feedback on the manuscript as a whole. Support was provided by the McGuire Center for Lepidoptera and Biodiversity's publication fund, the College of Agricultural and Life Sciences, School of Natural Resources and Environment, and Wildlife Ecology and Conservation department at UF. 

Materials

Name Company Catalog Number Comments
24 x 24 x 36" Popup Rearing & Observation Cage Bioquip 1466PB Ensure that the cage is slightly elevated from the ground to be able to tap the floor of the cage during experiments.
Cooler Any NA
Glassine envelopes Bioquip 1130B
HOBO Pendant Temperature/Light 8K Data Logger Onset UA-002-08 If a datalogger is not accessible, researchers may choose to use a digital thermometer to record ambient temperatures at regular intervals. See protocol step 4.5 for additional information.
HOBO Optic USB Base Station Onset Base-U-1
Ice water NA NA
Insects (focal taxa) NA Any Collect sufficient samples to test, ensuring replication of experimental groups (e.g. species, sampling location)
PVC T-joint Any Any
Sealable plastic bag Any NA
Stopwatch/timer Any NA
Weight Any NA Large coins or small rocks to weigh down the plastic bags will ensure that specimens are submerged in ice water. A standardized weight is ideal.

DOWNLOAD MATERIALS LIST

References

  1. Huey, B., Stevenson, R. D. Integrating thermal physiology and ecology of ectotherms a discussion of approaches. American Zoologist. 19 (1), 357-366 (1979).
  2. Huey, R. B., Slatkin, M. Cost and benefits of lizard thermoregulation. The Quarterly Review of Biology. 51 (3), 363-384 (1976).
  3. Kingsolver, J. G. Butterfly thermoregulario: Organismic mechanisms and population consequences. Journal of Research on the Lepidoptera. 24, 1-20 (1985).
  4. Kingsolver, J. G. Evolution and coadaptation of thermoregulatory behavior and wing pigmentation pattern in pierid butterflies. Evolution. 41 (3), 472-490 (1987).
  5. Kingsolver, J. G., Huey, R. B. Evolutionary analyses of morphological and physiological plasticity in thermally variable environments. American Zoologist. 38, 545-560 (1998).
  6. Malhi, Y., Wright, J. Spatial patterns and recent trends in the climate of tropical rainforest regions. Philosophical Transactions of the Royal Society of London. Series B, Biological Sciences. 359 (1443), 311-329 (2004).
  7. Sears, M. W., et al. Configuration of the thermal landscape determines thermoregulatory performance of ectotherms. Proceedings of the National Academy of Sciences of the United States of America. 113 (38), 10595-10600 (2016).
  8. Sinclair, B. J., Coello Alvarado, L. E., Ferguson, L. V. An invitation to measure insect cold tolerance: Methods, approaches, and workflow. Journal of Thermal Biology. 53, 180-197 (2015).
  9. Angilletta, M. Thermal adaptation: a theoretical and empirical synthesis. , Oxford University Press. (2009).
  10. Perkins-Kirkpatrick, S. E., Gibson, P. B. Changes in regional heatwave characteristics as a function of increasing global temperature. Scientific Reports. 7, 12256 (2017).
  11. Frishkoff, L. O., Hadly, E. A., Daily, G. C. Thermal niche predicts tolerance to habitat conversion in tropical amphibians and reptiles. Global Change Biology. 21 (11), 3901-3916 (2015).
  12. Nowakowski, A. J., Otero Jiménez, B., Allen, M., Diaz-Escobar, M., Donnelly, M. Landscape resistance to movement of the poison frog, Oophaga pumilio, in the lowlands of northeastern Costa Rica. Animal Conservation. 16 (2), 188-197 (2013).
  13. Kingsolver, J. G., Buckley, L. B. Quantifying thermal extremes and biological variation to predict evolutionary responses to changing climate. Philosophical Transactions of the Royal Society B. Biological Sciences. 372 (1723), 20160147 (2017).
  14. Dowd, W. W., King, F. A., Denny, M. W. Thermal variation, thermal extremes and the physiological performance of individuals. Journal of Experimental Biology. 218, 1956-1967 (2015).
  15. Sinclair, B. J., Williams, C. M., Terblanche, J. S. Variation in thermal performance among insect populations. Physiological and Biochemical Zoology. 85 (6), 594-606 (2012).
  16. Gotcha, N., Terblanche, J. S., Nyamukondiwa, C. Plasticity and cross-tolerance to heterogeneous environments: divergent stress responses co-evolved in an African fruit fly. Journal of Evolutionary Biology. 31 (1), 98-110 (2018).
  17. Mutamiswa, R., Chidawanyika, F., Nyamukondiwa, C. Superior basal and plastic thermal responses to environmental heterogeneity in invasive exotic stemborer Chilo partellus Swinhoe over indigenous Busseola fusca (Fuller) and Sesamia calamistis Hampson. Physiological Entomology. 43 (2), 108-119 (2018).
  18. de Jong, M. A., Saastamoinen, M. Environmental and genetic control of cold tolerance in the Glanville fritillary butterfly. Journal of Evolutionary Biology. 31 (5), 636-645 (2018).
  19. DeVries, Z. C., Kells, S. A., Appel, A. G. Estimating the critical thermal maximum (CTmax) of bed bugs, Cimex lectularius: Comparing thermolimit respirometry with traditional visual methods. Comparative Biochemistry and Physiology. Part A, Molecular & Integrative Physiology. 197, 52-57 (2016).
  20. De Keyser, R., Breuker, C. J., Hails, R. S., Dennis, R. L. H., Shreeve, T. G. Why small is beautiful: Wing colour is free from thermoregulatory constraint in the small lycaenid butterfly, Polyommatus icarus. PLoS One. 10 (4), 0122623 (2015).
  21. Nowakowski, A. J., et al. Tropical amphibians in shifting thermal landscapes under land-use and climate change. Conservation Biology. 31 (1), 96-105 (2017).
  22. Niehaus, A. C., Angilletta, M. J., Sears, M. W., Franklin, C. E., Wilson, R. S. Predicting the physiological performance of ectotherms in fluctuating thermal environments. Journal of Experimental Biology. 215, 694-701 (2012).

Tags

Field-Based Thermal Physiology Assay Cold Shock Recovery Ambient Conditions Low Cost Method Organismal Physiology Accessible Standardized Intrepid Field Biologists School Children Readily Available Materials Low Cost Insight Into Physiological Behavioral And Ecological Processes Standardized Metrics Compare Key Traits Individuals Species Ecological Communities Handling Insects Without Damage Defining Experiment Parameters Practice Makes Perfect Demonstrating Procedure Technicians From Daniel's Lab
Field-Based Thermal Physiology Assay: Cold Shock Recovery under Ambient Conditions
Play Video
PDF DOI DOWNLOAD MATERIALS LIST

Cite this Article

Khazan, E. S. Field-Based ThermalMore

Khazan, E. S. Field-Based Thermal Physiology Assay: Cold Shock Recovery under Ambient Conditions. J. Vis. Exp. (169), e62218, doi:10.3791/62218 (2021).

Less
Copy Citation Download Citation Reprints and Permissions
View Video

Get cutting-edge science videos from JoVE sent straight to your inbox every month.

Waiting X
Simple Hit Counter