Here we describe a method to visualize synaptogenesis of granule neurons in the mouse cerebellum over the time course of postnatal brain development when these cells refine their synaptic structures and form synapses to integrate themselves into the overall brain circuit.
Method Article
Utilizing In Vivo Postnatal Electroporation to Study Cerebellar Granule Neuron Morphology and Synapse Development
In This Article
Erratum Notice
Important: There has been an erratum issued for this article. View Erratum Notice
Summary
Abstract
Neurons undergo dynamic changes in their structure and function during brain development to form appropriate connections with other cells. The rodent cerebellum is an ideal system to track the development and morphogenesis of a single cell type, the cerebellar granule neuron (CGN), across time. Here, in vivo electroporation of granule neuron progenitors in the developing mouse cerebellum was employed to sparsely label cells for subsequent morphological analyses. The efficacy of this technique is demonstrated in its ability to showcase key developmental stages of CGN maturation, with a specific focus on the formation of dendritic claws, which are specialized structures where these cells receive the majority of their synaptic inputs. In addition to providing snapshots of CGN synaptic structures throughout cerebellar development, this technique can be adapted to genetically manipulate granule neurons in a cell-autonomous manner to study the role of any gene of interest and its effect on CGN morphology, claw development, and synaptogenesis.
Introduction
Brain development is a prolonged process that extends from embryogenesis into postnatal life. During this time, the brain integrates a combination of intrinsic and extrinsic stimuli that sculpt the wiring of synapses between dendrites and axons to ultimately guide behavior. The rodent cerebellum is an ideal model system to study how synapses develop because the development of a single neuron type, the cerebellar granule neuron (CGN), can be tracked as it transitions from a progenitor cell to a mature neuron. This is due, in part, to the fact that a majority of the cerebellar cortex develops postnatally, which allows for easy genetic manipulation and cell labeling after birth1.
In mammals, CGN differentiation begins at the end of embryonic development when a subset of proliferative cells in the hindbrain migrates over the rhombic lip to form a secondary germinal zone on the surface of the cerebellum2,3,4. Although they are fully committed to a granule neuron progenitor (GNP) identity, these cells continue to proliferate within the outer portion of the external granule layer (EGL) until postnatal day 14 (P14). Proliferation of this layer results in a massive expansion of the cerebellum as these cells give rise exclusively to CGNs5. Once newborn CGNs exit the cell cycle in the EGL, they migrate inwards towards the internal granule layer (IGL), leaving behind an axon that will bifurcate and travel in the molecular layer of the cerebellum, forming parallel fibers that synapse onto Purkinje cells6. The position of these fibers within the molecular layer is dependent on the timing of cell-cycle exit.
CGNs that differentiate first leave their parallel fibers towards the bottom of the molecular layer, whereas the axons of CGNs that differentiate later are clustered at the top7,8. Once the CGN cell bodies reach the IGL, they begin to elaborate dendrites and form synapses with nearby inhibitory and excitatory neurons. The mature dendritic tree of a CGN exhibits a stereotyped architecture with four main processes. Over the course of CGN maturation, the structures at the end of these dendrites form a claw that becomes enriched with postsynaptic proteins9,10. These specialized structures, called dendritic claws, contain the majority of the synapses onto granule neurons and are important for receiving both excitatory inputs from mossy fiber innervations originating from the pons, as well as inhibitory inputs from local Golgi cells. Once fully configured, the synaptic connections of CGNs allow these cells to relay inputs from pre-cerebellar nuclei to Purkinje cells, which project out of the cerebellar cortex to the deep cerebellar nuclei.
In vivo postnatal electroporation of GNPs is advantageous over other labeling-based methods, such as viral infection and generation of transgenic mouse lines, because the expression of desired constructs can be achieved on a fast timeline, and the method targets a small population of cells, useful in studying cell-autonomous effects. This method has been used in prior studies to study morphological development of CGNs; however, these studies have focused on either a single time point or a short window of time9,10,11,12,13. This labeling method was paired with image analysis to document the changes in CGN morphology that occur across the entire time course of CGN differentiation over the first three weeks of postnatal life. These data reveal the dynamics of CGN dendrite development that underlie construction of cerebellar circuits.
Protocol
NOTE: All procedures were performed under protocols approved by Duke University Institutional Animal Care and Use Committee (IACUC).
1. DNA preparation for in vivo electroporation or IVE (1 day before surgery)
- Gather the following materials: purified DNA (0.5-25 µg per animal), 3 M sodium acetate, ethanol, Fast Green dye, ultrapure distilled water, phosphate buffer solution (PBS) (see the Table of Materials).
NOTE: For DNA, a construct expressing green fluorescent protein (GFP) under a human ubiquitin promoter was obtained from Addgene (FUGW, https://www.addgene.org/14883/). Any construct expressing GFP or another fluorescent protein under the control of a ubiquitous promoter should work. CGN-specific labeling with this technique is not dependent on the construct, but rather on the electroporation. - Prepare DNA for electroporation by mixing the desired amount of DNA, 10% by volume of 3 M sodium acetate and 250% by volume of 100% ice-cold ethanol. Note that the DNA will precipitate out of solution immediately.
- Continue to precipitate the DNA mixture overnight at -20 °C or for an hour at -80 °C.
- Pellet precipitated DNA in a tabletop centrifuge at >16,000 × g and wash twice with 70% ethanol.
- Allow the DNA pellet to dry completely, and reconstitute in a 1x PBS + 0.02% Fast Green solution.
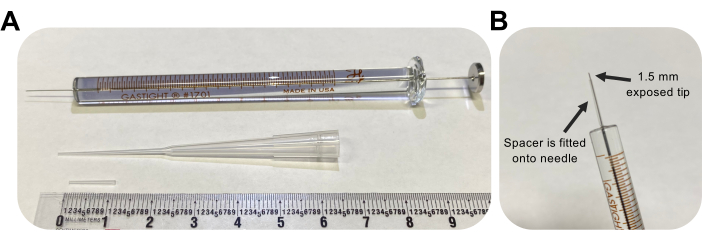
Figure 1: Limiting injection depth to 1.5 mm using a spacer. (A) A 11.2 mm segment is cut off a loading pipette using a razor blade. (B) The spacer is fitted onto the tip of the Hamilton syringe (total length is 1.27 cm or 0.5 in) and secured with either adhesive or parafilm. The exposed tip should be 1.5 mm in length. Please click here to view a larger version of this figure.
2. In vivo electroporation of granule neuron progenitors in seven-day old postnatal mice
NOTE: All electroporation surgeries were performed in a sterile and highly ventilated surgical suite, and all personnel wore complete personal protective equipment including gloves, face mask, hair bonnet, gown, and shoe covers. Alternatively, the surgeries can be performed in a ventilated and sterile hood.
- Gather the following materials: DNA for electroporation, small surgical scissors, small surgical tweezers, customized Hamilton syringe, cotton-tip applicator, heating pad, betadine, 70% ethanol, 1x PBS, parafilm, tissue adhesive (n-butyl-ester cyanoacrylate), isoflurane, electroporator, and tweezer-type electrodes (see the Table of Materials).
- Cut a spacer from a sterilized loading tip to fit over the Hamilton syringe to limit the injection depth to 1.5 mm (Figure 1A,B). Secure the spacer with adhesive or parafilm.
- Anesthetize the P7 pup in an isoflurane chamber at a delivery rate of 0.8 L/min. Confirm full anesthesia by monitoring the animal for decreased respiration and a lack of a toe or tail pinch response (Figure 2A).
- Once the animal is fully anaesthetized, place the pups on a pedestal fitted with a nose cone, delivering constant 4% isoflurane at a delivery rate of 0.8 L/min. Clean the top of the pup's head 3 times with a sterile swab of betadine then 70% ethanol, alternating between the two, to prepare the site. Allow the solution to dry before proceeding.
- Using a pair of sterilized scissors, make a small incision with one cut that spans the distance from the top to the base of the ears to reveal the hindbrain (Figure 2B).
- Locate the cerebellum (Figure 2C), insert the exposed tip of the Hamilton syringe through the skull, perpendicular to the brain, and inject 1.5 µL of DNA mixture into the cerebellar parenchyma by slowly pushing the back plunger of the syringe. After delivery of the DNA mixture, slowly pull the needle back to prevent back spills, and allow the DNA solution to diffuse for 30 s.
- Turn off the isoflurane, and place the pup on a 37 °C heating pad. Prepare the tweezer-type electrode for electroporation by dipping both ends into sterile 1x PBS.
NOTE: Wetting the tweezer-type electrode will prevent contact burns on the skin of the pup during administration of the electrical pulses. - Orient the tweezer-electrode above the site of injection with the plus end facing downwards and the negative end above the animal's head (Figure 2D). Administer five electrical pulses from the electroporator with the following settings: 50 ms, 130 V, and 950 ms inter-pulse interval.
NOTE: If needed, perform a test injection to ensure that the injection site is located on the cerebellar vermis (Figure 2E). - Pinch the incision closed, and seal the wound with a non-toxic n-butyl-ester cyanoacrylate tissue adhesive. Clean the wound with 70% ethanol as any trace amount of blood increases the likelihood of parental infanticide and cannibalism.
- Allow the animal to recover on a 37 °C heating pad before returning the pup to the dam. Monitor the pup(s) every 30 min for at least 2 h after the surgery to ensure full recovery.
NOTE: Infanticide by either parent is quite common. To prevent cannibalism, house the sire in a different cage before starting the electroporation, and always return cleaned and recovered pups (i.e., no bloodstain, fully mobile) to the original cage on the original bedding. Pups can also be wiped with droppings from the original cage to minimize the smell of blood. The use of a surrogate dam may be necessary if the original dam continues to cannibalize her pups.
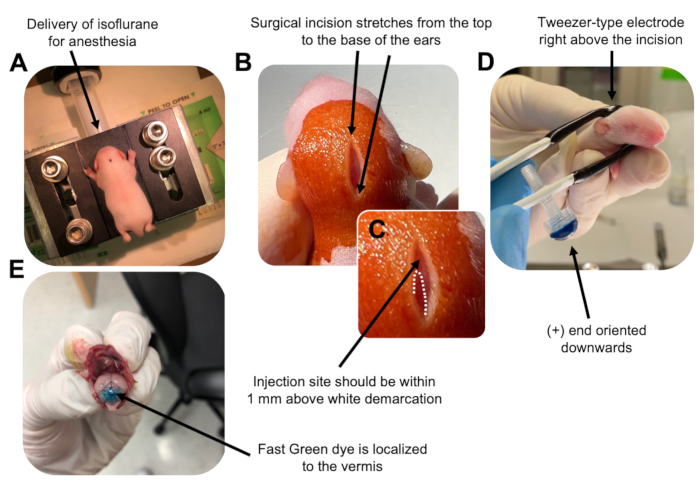
Figure 2: In vivo cerebellar electroporation of granule neuron progenitors in P7 wildtype mouse pups. (A) Pups are anesthetized with 4% isoflurane delivered at a rate of 0.8L/min to ensure anesthesia throughout the injection of the DNA solution. Isoflurane is delivered at a rate of 0.8 L/min. (B) After sterilizing the mouse 3 times with betadine and 70% ethanol, an incision is made that spans the distance of the ears, revealing the hindbrain. (C) A magnified image of a white demarcation on the cranium, a landmark for the injection site. DNA construct should be injected within 1 mm above the mark; dotted lines outline the demarcation, and black arrow denotes the injection site. The ridges of the cerebellar vermis may be visible and can be useful for finding the injection site. (D) Tweezer-type electrode orientation for efficient electroporation. Plus (+) end must be oriented downwards to pull negatively charged DNA into the cerebellar parenchyma prior to administration of electrical pulses. (E) Test injection of 1 µL of a 0.02% Fast Green dye shows injection is localized to the middle of the cerebellar vermis between lobules 5-7. Please click here to view a larger version of this figure.
3. Immunohistochemistry of electroporated CGNs
- Gather the following materials: isoflurane, 1x PBS, 4% paraformaldehyde (PFA), 30% sucrose, normal goat serum, non-ionic detergent, glass slides, glass coverslips, nail polish, mounting media, Hoechst nuclear dye, and appropriate primary and secondary antibodies (see the Table of Materials).
- Anesthetize the experimental animal with isoflurane, and confirm full anesthesia with a toe and tail pinch.
- Perform a trans-cardial perfusion by slowly injecting 1x PBS and 4% PFA into the left ventricle of the animal's heart. Allow the blood to drain from the animal by cutting the vena cava.
- Fix the brain overnight by submerging it in 4% PFA at 4 °C. On the following day, quickly rinse the brain with 1x PBS, and transfer the brain into 30% sucrose in 1x PBS for cryoprotection for at least 24 h.
- If necessary, slice the brain in half along the rostral-caudal axis, and confirm expression of the transfected reporter construct using an upright fluorescent dissecting microscope.
NOTE: Keep the brain submerged in 1x PBS in a small dish to prevent it from drying out. - Mount the brain on a freezing microtome, slice 25 µm sagittal sections, and allow sections to unfold in a 1:1 mixture of 1x PBS and glycerol.
NOTE: Sections can be stored in this cryoprotectant solution at -20 °C for long-term storage. - Wash sections three times in 1x PBS for 10 min each to remove cryoprotectant, and block the tissue in 1x PBS + 10% normal goat serum + 0.2% non-ionic detergent on an orbital shaker at room temperature for 1 h.
- Prepare primary antibody solution: 1x PBS, 10% normal goat serum, 0.2% non-ionic detergent, and anti-GFP antibody, and centrifuge the solution for 5 min at >16,000 × g. Incubate sections in the antibody solution at 4 °C on an orbital shaker for 48 h.
- Wash off primary antibody solution for 15 min five times with 1x PBS + 0.2% non-ionic detergent.
- Prepare secondary antibody solution: 1x PBS, 10% normal goat serum, 0.2% non-ionic detergent, and an appropriate secondary antibody to detect GFP; centrifuge the solution at >16,000 × g. Incubate sections in the antibody solution on an orbital shaker at room temperature for 2-3 h. Protect the sections from light exposure to prevent bleaching.
- Wash off secondary antibody solution three times with 1x PBS + 0.2% non-ionic detergent for 15 min each time. Incubate sections in 1x PBS + Hoechst for 5 min to stain nuclei.
- Wash off Hoechst solution with 1x PBS + 0.2% non-ionic detergent and mount onto glass slides. Cover the sections with mounting media, coverslip the slides, and seal the slide with nail polish to prevent evaporation.
4. Morphological analyses of CGNs - three-dimensional (3D) reconstruction and surface area and cellular volume
- Image single electroporated CGNs on a confocal microscope at 63x objective with a 2x zoom, taking z-stack images at 0.5 µm per stack. Image one cell per image window to allow for easy image analysis and reconstruction.
- Install the Simple Neurite Tracer plug-in for FIJI using the following link (https://imagej.net/Simple_Neurite_Tracer:_Basic_Instructions) to easily and efficiently trace the structure of electroporated CGNs in three-dimensional (3D) space.
NOTE: There is an updated version of the plug-in (https://imagej.net/SNT). - Analyze neurite length and dendritic claw formation in a blinded manner using Simple Neurite Tracer. Upload single-channel z-stack images of electroporated CGNs onto FIJI, and click on Plugins | Segmentation | Simple Neurite Tracer (Figure 3D).
- Access the drop-down menu, and select Create New 3D Viewer (Figure 3D).
- Scroll to the base of a dendrite, where it connects to the cell soma and start a path by clicking on the junction. Manually trace the path by clicking through the sections where the cell-fill signal is brightest, pressing [y] to keep the trace. Trace until the end of the dendrite if it does not contain a claw or until the base of the claw and confirm the path by pressing [f] (Figure 4D).
- Next, trace the claw by starting a path at the base of the structure and tracing until the end of the longest neurite. Trace secondary and tertiary branches by holding down [ctrl] on Windows or [alt] on a Mac OS and clicking the path. Confirm the path by pressing [f].
- Observe that measurements for the traces are visible on a separate window; add up all of the measurements of the claw branches (primary, secondary, tertiary) to obtain the total length for each claw.
- For analyzing surface area and cellular volume of electroporated CGNs, download Imaris cell analysis software (https://imaris.oxinst.com/).
NOTE: FIJI can also be used to reconstruct cells in 3D from z-stack images using readily available and free plug-ins. Additionally, there is a volumetric rendering feature in Simple Neurite Tracer but Imaris was used for the reasons outlined below. - Upload z-stack image of an electroporated CGN onto Imaris. Access the 3D-reconstruction toolkit by pressing Surpass.
- To reconstruct the CGN, press Surfaces, and select a region of interest that encompasses the entirety of the cell within the image window. Once finished, press the blue forward arrow at the bottom right corner under Create.
- If the image contains multiple channels for different signals, select the channel containing the electroporated CGN, and press the blue forward arrow.
- Using the slidebar, set a desired threshold that most accurately fits the signal of the electroporated cell. Zoom in closer to the surface of the cell to accurately determine the threshold. Once finished, press the double green arrow to reconstruct the cell and obtain the surface area and volume size from the metadata.
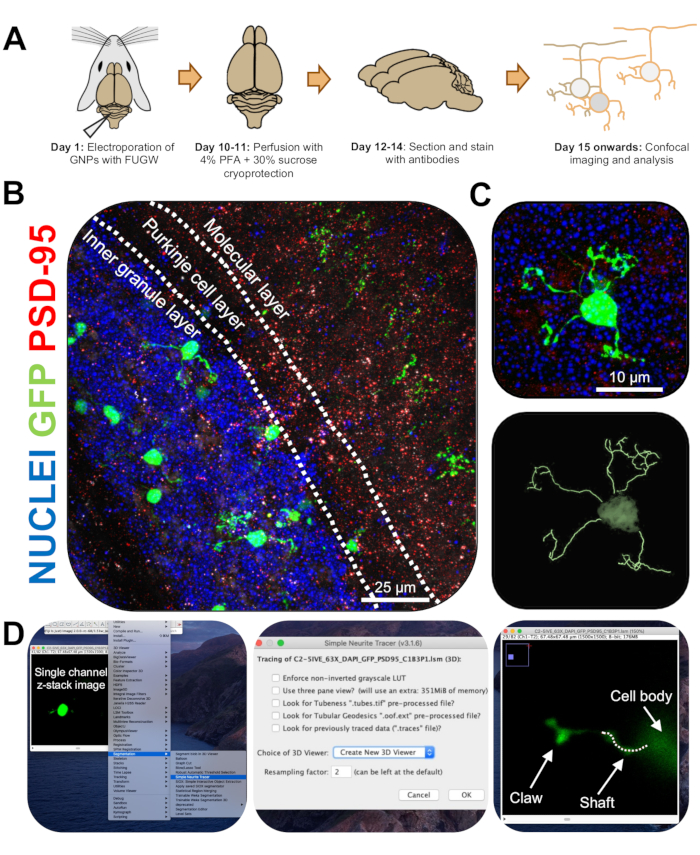
Figure 3: Immunohistochemical analysis and three-dimensional reconstruction of electroporated granule neurons. P7 CD-1 mice were electroporated with a construct expressing GFP. Brains were collected and subjected to immunohistochemistry, confocal microscopy, and 3D-reconstruction for morphological analysis. (A) Timeline from electroporation to image processing of a 10-DPI mouse. (B) Maximum projection image of a sagittal cross-section of electroporated cerebellum 10-DPI; white lines demarcate cerebellar layers, and scale bar is 25 µm. (C) Maximum projection image of a single electroporated granule neuron 10-DPI and the corresponding 3D trace, scale bar is 10 µm. (D) 3D-reconstructions were generated using the FIJI plugin Simple Neurite Tracer. All measurements were traced through the z-stack, following the cell-fill signal. Shaft and claw measurements were traced separately for every dendrite; dotted line denotes portion of dendrite within the current plane. Abbreviations: 3D = three-dimensional; GFP = green fluorescent protein; DPI = days post-injection; PSD-95 = postsynaptic density protein 95; GNPs = granule neuron progenitors; PFA = paraformaldehyde. Please click here to view a larger version of this figure.
Results
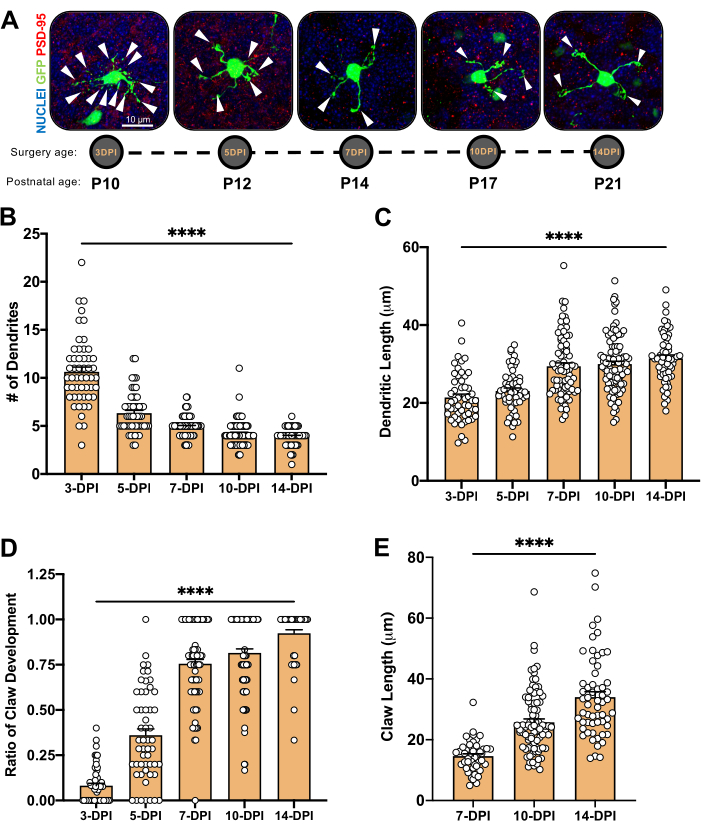
Figure 4: Analysis of granule neuron morphology during cerebellar development. (A) Maximum projection images of electroporated CGNs from 3-DPI to 14-DPI (postnatal age P10 to P21), nuclei (blue) and GFP (green); arrowheads indicate individual dendrite, and scale bar is 10 µm. (B) Average number of dendrites. (C) Average dendrite length measured from the base of the soma to the tip of the dendrite. (D) Fraction of dendrites that contain a claw; a value of 1.00 is 100%, i.e., all dendrites have claw. (E) Total length of dendritic claw. N > 30 cells per condition, collected from at least 4 animals per condition; all measurements were analyzed by one-way ANOVA and either a Dunnett's multiple comparison test (B, C, and D) or a Tukey's multiple comparison test (E), **** denotes significance with p <0.0001 across time; errors bars are S.E.M. Abbreviations: GFP = green fluorescent protein; DPI = days post-injection; PSD-95 = postsynaptic density protein 95; CGNs = cerebellar granule neurons; ANOVA = analysis of variance; S.E.M. = standard error of the mean. Please click here to view a larger version of this figure.
To study the development of granule neuron morphology in vivo, a construct expressing GFP under the control of a human ubiquitin promoter (FUGW) was electroporated into the developing cerebellum of CD-1 mice and brains collected 3-, 5-, 7-, 10-, and 14-days post-injection (DPI). Sparse labeling of cells by electroporation in combination with confocal microscopy capture snapshots of CGNs during periods of dendritic pruning, growth, and maturation. To quantitatively analyze and track the growth of CGN synaptic structures, each dendrite was traced using the FIJI plugin Simple Neurite Tracer (SNT). SNT is an easy, fast, efficient, and readily available method to measure neurite and claw length in three-dimensional (3D) space. Conversely, Imaris was used for 3D-reconstruction of CGNs to obtain surface area and volume measurements because the program provides fast and accurate rendering of each cell, and its thresholding capabilities are able to isolate labeled cells from nearby labeled cell debris.
Newborn CGNs undergo an exuberant phase of dendritic growth followed by refinement from P10 to P14 (3- to 7-DPI) that results in the pruning of more than 50% of excess dendrites (Figure 4B). This event coincides with the gradual lengthening of the remaining arbors (Figure 4C) and the formation of claw-like structures at the end of each dendrite (Figure 4D), indicating that these developmental processes are happening concurrently. However, while claws are found on roughly 75% of dendrites by P14 (7-DPI), these structures continue to increase in size until P21 (14-DPI) (Figure 4E).
The changes in dendrite and claw morphology could reflect either an overall change in total cell size or a redistribution of cell membrane. To address this question, each labeled granule neuron was reconstructed in Imaris to quantify the total somatodendritic surface area and volume. CGN size remained relatively constant across development (Figure 5A,B), though at P14, CGNs exhibit a significant 20% decrease in volume compared to P10, P12, and P17 (3-, 5-, and 10-DPI) (Figure 5B). These data suggest that membrane recycling from retracted dendrites may be particularly important for permitting the enlargement of dendritic endings into claws and point to P14 (7-DPI) as a key time point in the transition from pruning to synapse development.
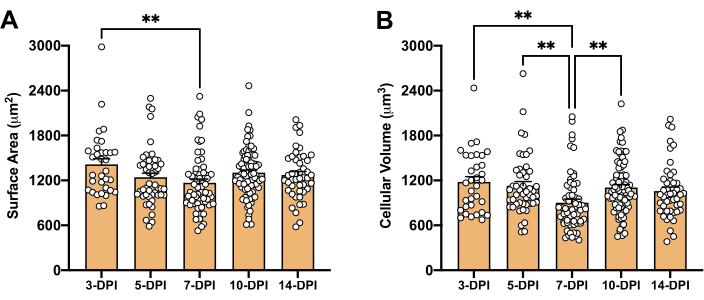
Figure 5: Analysis of granule neuron size during cerebellar development. Electroporated CGNs were reconstructed in Imaris to determine cellular size. (A-B) Surface area and volumetric analysis of granule neurons (i.e., cell soma and dendrites) during cerebellar development. N > 30 cells per condition, collected from at least 4 animals per condition. All measurements were analyzed by one-way ANOVA and a Dunnett's multiple comparison test, ** denotes significance with p <0.005; errors bars are S.E.M. Abbreviations: DPI = days post-injection; CGNs = cerebellar granule neurons; ANOVA = analysis of variance; S.E.M. = standard error of the mean. Please click here to view a larger version of this figure.
Discussion
Cerebellar granule neurons are the most abundant neurons in the mammalian brain, making up almost 60-70% of the total neuron population in the rodent brain1,14. The cerebellum has been extensively utilized to elucidate mechanisms of cellular proliferation, migration, dendrite formation, and synapse development6,9,10,11,15,16,17,18,19,20. Moreover, decades of electrophysiological studies have helped to establish the role of granule neurons in long-term cerebellar plasticity, which underlies the circuit's involvement in learned motor behaviors21,22,23. Thus, granule neurons are an excellent model system to interrogate key questions regarding synapse and circuit development.
The goal of this study is to highlight a technique that takes advantage of the cerebellum to track the morphology of a single neuron type in vivo. Electroporation of the cerebellum targets dividing cells; thus, it is technically capable of labeling both granule neuron progenitors and glial cells, although because granule neuron progenitors are so numerous, the electroporated population is largely neuronal even without the need for cell-type specific promoters. Additionally, this technique can be adapted to genetically manipulate genes in vivo to study their roles in CGN development. This can be achieved by transfection of a plasmid expressing either short-hairpin or small-interfering RNAs to knock down genes or a plasmid expressing Cre recombinase into a transgenic mouse strain to excise regions flanked by LoxP sites and knock out the intended gene of interest10,24.
Electroporation has both strengths and weaknesses for genetic studies. It offers a faster method to manipulate genes compared to traditional transgenic strategies, although the spareness of the electroporation limits its utility for behavioral studies, which require large numbers of genetically modified cells to see effects. A second limitation is that it only reliably targets granule neurons between lobules 5 and 7, and this is due, in part, to how the cerebellum is oriented at the site of injection. However, within the electroporated region, this method yields a relatively large number of individually labeled cells, giving the potential for statistically robust measurements. For example, not only was it possible to follow dendrite development over time, but also subtle redistributions of membrane between the dendrites and claws could be measured, extending previously published data20. CGN claws are particularly interesting to study as enlargement of these dendritic structures provides additional real estate for granule neurons to form both excitatory connections with mossy fiber terminals and unipolar brush cells as well as inhibitory connections with nearby Golgi cells. Therefore, combining these dendritic measurements with immunohistochemical labeling of specific pre- and postsynaptic proteins could be useful to advance the study of cerebellar circuit formation and synapse maturation.
Disclosures
The authors declare no conflicts of interest.
Acknowledgements
The work was supported by NIH grants R01NS098804 (A.E.W.), F31NS113394 (U.C.), and Duke University's Summer Neuroscience Program (D.G.).
Materials
| Name | Company | Catalog Number | Comments |
|---|---|---|---|
| Betadine | Purdue Production | 67618-150-17 | |
| Cemented 10 µL needle | Hamilton | 1701SN (80008) | 33 gauge, 1.27 cm (0.5 in), 4 point style |
| Chicken anti-GFP | Millipore Sigma | AB16901 | Our lab uses this antibody at a 1:1000 concentration |
| Cotton-tip applicator | |||
| Donkey anti-chicken Cy2 | Jackson ImmunoResearch | 703-225-155 | Our lab uses this antibody at a 1:500 concentration |
| Ethanol (200 proof) | Koptec | V1016 | |
| Electroporator ECM 830 | BTX Harvard Apparatus | 45-0052 | |
| Fast Green FCF | Sigma | F7252-5G | |
| FUGW plasmid | Addgene | 14883 | |
| Glass slides | VWR | 48311-703 | Superfrost plus |
| Glycerol | Sigma-Aldrich | G5516 | |
| Heating pad | Softheat | ||
| Hoescht 33342 fluorescent dye | Invitrogen | 62249 | |
| Imaris | Bitplane | ||
| Isoflurane | Patterson Veterinary | 07-893-1389 | |
| Micro cover glass | VWR | 48382-138 | |
| Nail polish | Sally Hansen | Color 109 | |
| Normal goat serum | Gibco | 16210064 | |
| O.C.T. embedding compound | Tissue-Tek | 4583 | |
| Olympus MVX10 Dissecting Scope | Olympus | MVX10 | |
| P200 pipette reach tip | Fisherbrand | 02-707-138 | Used for needle spacer |
| Parafilm | Bemis | PM-996 | |
| PBS pH 7.4 (10x) | Gibco | 70011-044 | |
| Simple Neurite Tracer | FIJI | https://imagej.net/Simple_Neurite_Tracer:_Basic_ Instructions | |
| Sucrose | Sigma | S0389 | |
| Surgical tools | RWD Life Science | Small scissors and tweezers | |
| Triton X-100 | Roche | 11332481001 | non-ionic detergent |
| Tweezertrodes | BTX Harvard Apparatus | 45-0489 | 5 mm, platinum plated tweezer-type electrodes |
| Ultrapure distilled water | Invitrogen | 10977-015 | |
| Vectashield mounting media | Vectashield | H1000 | |
| Vetbond tissue adhesive | 3M | 1469SB | |
| Zeiss 780 Upright Confocal | Zeiss | 780 |
References
- Altman, J., Bayer, S. A. Development of the cerebellar system : in relation to its evolution, structure, and functions. , CRC Press. (1997).
- Rahimi-Balaei, M., Bergen, H., Kong, J., Marzban, H. Neuronal migration during development of the cerebellum. Frontiers in Cellular Neuroscience. 12, 484(2018).
- Alder, J., Cho, N. K., Hatten, M. E. Embryonic precursor cells from the rhombic lip are specified to a cerebellar granule neuron identity. Neuron. 17 (3), 389-399 (1996).
- Hatten, M. E., Heintz, N. Mechanisms of neural patterning and specification in the developing cerebellum. Annual Review of Neuroscience. 18, 385-408 (1995).
- Ben-Arie, N., et al. Math1 is essential for genesis of cerebellar granule neurons. Nature. 390 (6656), 169-172 (1997).
- Borghesani, P. R., et al. BDNF stimulates migration of cerebellar granule cells. Development. 129 (6), 1435-1442 (2002).
- Espinosa, J. S., Luo, L. Timing neurogenesis and differentiation: insights from quantitative clonal analyses of cerebellar granule cells. Journal of Neuroscience. 28 (10), 2301-2312 (2008).
- Markwalter, K. H., Yang, Y., Holy, T. E., Bonni, A. Sensorimotor coding of vermal granule neurons in the developing mammalian cerebellum. Journal of Neuroscience. 39 (34), 6626-6643 (2019).
- Shalizi, A., et al. PIASx is a MEF2 SUMO E3 ligase that promotes postsynaptic dendritic morphogenesis. Journal of Neuroscience. 27 (37), 10037-10046 (2007).
- Shalizi, A., et al. A Calcium-regulated MEF2 sumoylation switch controls poststynaptic differentiation. Science. 311 (5763), 1012-1017 (2006).
- Konishi, Y., Stegmuller, J., Matsuda, T., Bonni, S., Bonni, A. Cdh1-APC controls axonal growth and patterning in the mammalian brain. Science. 303 (5660), 1026-1030 (2004).
- Holubowska, A., Mukherjee, C., Vadhvani, M., Stegmuller, J. Genetic manipulation of cerebellar granule neurons in vitro and in vivo to study neuronal morphology and migration. Journal of Visualized Experiments: JoVE. (85), e51070(2014).
- Yang, Y., et al. Chromatin remodeling inactivates activity genes and regulates neural coding. Science. 353 (6296), 300-305 (2016).
- Herculano-Houzel, S. Coordinated scaling of cortical and cerebellar numbers of neurons. Frontiers in Neuroanatomy. 4, 12(2010).
- Wilson, P. M., Fryer, R. H., Fang, Y., Hatten, M. E. Astn2, a novel member of the astrotactin gene family, regulates the trafficking of ASTN1 during glial-guided neuronal migration. Journal of Neuroscience. 30 (25), 8529-8540 (2010).
- Kokubo, M., et al. BDNF-mediated cerebellar granule cell development is impaired in mice null for CaMKK2 or CaMKIV. Journal of Neuroscience. 29 (28), 8901-8913 (2009).
- Schwartz, P. M., Borghesani, P. R., Levy, R. L., Pomeroy, S. L., Segal, R. A. Abnormal cerebellar development and foliation in BDNF-/- mice reveals a role for neurotrophins in CNS patterning. Neuron. 19 (2), 269-281 (1997).
- Segal, R. A., Pomeroy, S. L., Stiles, C. D. Axonal growth and fasciculation linked to differential expression of BDNF and NT3 receptors in developing cerebellar granule cells. Journal of Neuroscience. 15 (7), Pt 1 4970-4981 (1995).
- Zhou, P., et al. Polarized signaling endosomes coordinate BDNF-induced chemotaxis of cerebellar precursors. Neuron. 55 (1), 53-68 (2007).
- Dhar, M., Hantman, A. W., Nishiyama, H. Developmental pattern and structural factors of dendritic survival in cerebellar granule cells in vivo. Scientific Reports. 8 (1), 17561(2018).
- Ito, M. Synaptic plasticity in the cerebellar cortex and its role in motor learning. Canadian Journal of Neurological Sciences. 20, Suppl 3 70-74 (1993).
- Jorntell, H., Hansel, C. Synaptic memories upside down: bidirectional plasticity at cerebellar parallel fiber-Purkinje cell synapses. Neuron. 52 (2), 227-238 (2006).
- Nakanishi, S. Genetic manipulation study of information processing in the cerebellum. Neuroscience. 162 (3), 723-731 (2009).
- Chang, C. H., et al. Atoh1 controls primary cilia formation to allow for SHH-triggered granule neuron progenitor proliferation. Developmental Cell. 48 (2), 184-199 (2019).
Reprints and Permissions
Erratum
Formal Correction: Erratum: Utilizing In Vivo Postnatal Electroporation to Study Cerebellar Granule Neuron Morphology and Synapse Development
Posted by JoVE Editors on 4/06/2023. Citeable Link.
An erratum was issued for: Utilizing In Vivo Postnatal Electroporation to Study Cerebellar Granule Neuron Morphology and Synapse Development. A figure was updated.
Figure 2 was updated from:
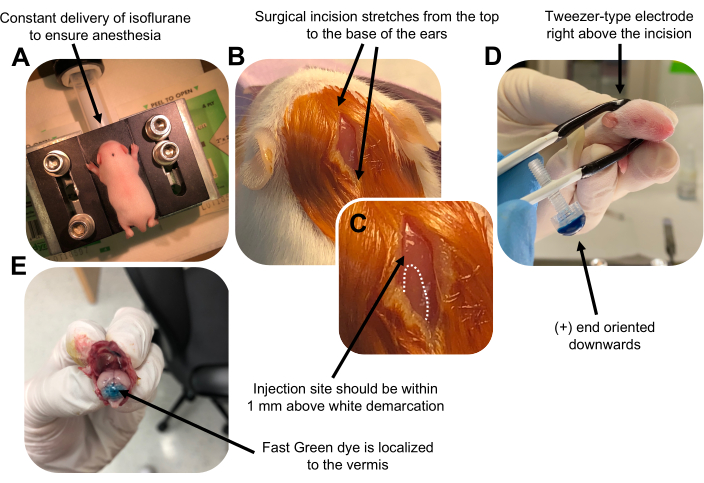
Figure 2: In vivo cerebellar electroporation of granule neuron progenitors in P7 wildtype mouse pups. (A) Pups are anesthetized with 4% isoflurane delivered at a rate of 0.8L/min to ensure anesthesia throughout the injection of the DNA solution. Isoflurane is delivered at a rate of 0.8 L/min. (B) After sterilizing the mouse 3 times with betadine and 70% ethanol, an incision is made that spans the distance of the ears, revealing the hindbrain. (C) A magnified image of a white demarcation on the cranium, a landmark for the injection site. DNA construct should be injected within 1 mm above the mark; dotted lines outline the demarcation, and black arrow denotes the injection site. The ridges of the cerebellar vermis may be visible and can be useful for finding the injection site. (D) Tweezer-type electrode orientation for efficient electroporation. Plus (+) end must be oriented downwards to pull negatively charged DNA into the cerebellar parenchyma prior to administration of electrical pulses. (E) Test injection of 1 µL of a 0.02% Fast Green dye shows injection is localized to the middle of the cerebellar vermis between lobules 5-7. Please click here to view a larger version of this figure.
to:
Figure 2: In vivo cerebellar electroporation of granule neuron progenitors in P7 wildtype mouse pups. (A) Pups are anesthetized with 4% isoflurane delivered at a rate of 0.8L/min to ensure anesthesia throughout the injection of the DNA solution. Isoflurane is delivered at a rate of 0.8 L/min. (B) After sterilizing the mouse 3 times with betadine and 70% ethanol, an incision is made that spans the distance of the ears, revealing the hindbrain. (C) A magnified image of a white demarcation on the cranium, a landmark for the injection site. DNA construct should be injected within 1 mm above the mark; dotted lines outline the demarcation, and black arrow denotes the injection site. The ridges of the cerebellar vermis may be visible and can be useful for finding the injection site. (D) Tweezer-type electrode orientation for efficient electroporation. Plus (+) end must be oriented downwards to pull negatively charged DNA into the cerebellar parenchyma prior to administration of electrical pulses. (E) Test injection of 1 µL of a 0.02% Fast Green dye shows injection is localized to the middle of the cerebellar vermis between lobules 5-7. Please click here to view a larger version of this figure.
