JoVE Science Education
Sensation and Perception
A subscription to JoVE is required to view this content.  Sign in or start your free trial.
JoVE Science Education Sensation and Perception
Color Afterimages
  • 00:00Overview
  • 02:21Experimental Design
  • 04:55Running the Experiment
  • 07:00Representative Results
  • 07:31Applications
  • 08:44Summary

Images rémanentes en couleurs

English

Share

Overview

Source : Laboratoire de Jonathan Flombaum, Johns Hopkins University

La vision des couleurs humaine est impressionnante. Personnes ayant une vision normale des couleurs peut dire apart millions de teintes différentes. Plus étonnamment, cette capacité est réalisée avec du matériel relativement simple.

Partie de la puissance de la vision humaine de couleurs est un peu habile de génie dans le cerveau humain. Là, perception des couleurs dépend de ce que l’on appelle un « système adversaire. » Cela signifie que la présence d’un seul type de stimulation est traitée comme une preuve de l’absence de l’autre et vice versa ; absence d’un type de stimulation est pris comme une preuve de la présence de l’autre. En particulier, dans le cerveau humain il y a des cellules qui le feu lorsqu’ils reçoivent des signaux de suggérer que la lumière bleue est présente, ou lorsqu’ils ne reçoivent pas de signaux suggérant une lumière jaune. De même, il y a des cellules qui le feu en présence de jaune ou de l’absence de bleu. Bleu et jaune sont donc considérés comme des valeurs adversaires dans une seule dimension et peuvent être considérés comme négatif par rapport à des valeurs positives sur un axe d’un plan cartésien. Si un stimulus est caractérisé comme ayant une valeur négative sur cet axe, il ne peut pas aussi avoir une valeur positive. Donc, si elle est qualifiée de jaune, il ne peut également être qualifiée de bleu. De même, vert et rouge (ou vraiment, magenta), occupent une autre dimension adversaire. Il y a des cellules dans le cerveau humain qui répondent à la présence d’un ou de l’absence de l’autre. Les figures 1 et 2 expliquent opposition de couleur sur le plan cartésien.

Figure 1
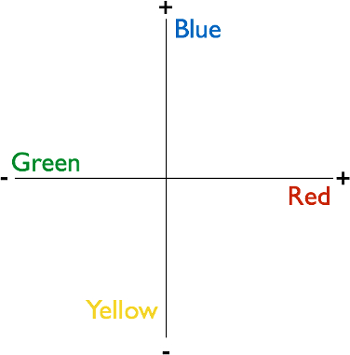
La figure 1. Dimensions couleur adversaire. Le cerveau humain traite couleur à l’aide d’un système de dimensions adversaire. Il s’agit d’un plan à deux dimensions avec bleu et jaune, un axe, qui peut être considéré comme simplement positive ou négative et rouges et vertes occupant l’autre axe d’occupation. La conséquence du système est que le cerveau traite de la présence de certaines couleurs comme indiquant l’absence de l’autre et vice versa. Toutes les couleurs perceptibles occupent un point dans l’espace adverse.

Figure 2
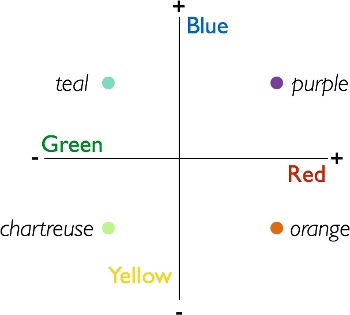
La figure 2. Toutes les couleurs perceptibles occupent un point dans l’espace adverse. Montré ici sont des exemples de couleurs qui ont des valeurs différentes de zéro dans chacune des deux dimensions de l’espace de l’adversaire.

Une façon cette opposition de couleur a été découvert en 1878 par Ewald Hering, avant même que les scientifiques avaient accès à des techniques d’imagerie du cerveau lui-même-est à travers une illusion appelée une image rémanente de couleur. Rétinienne est encore utilisées aujourd’hui pour démontrer les propriétés adversaires de la perception de couleur humaine tant de les étudier.

Cette vidéo montre comment créer une illusion d’image rémanente de couleur et un moyen simple pour recueillir des réponses subjectives de perception auprès des observateurs humains.

Procedure

1. les stimuli Ouvrez une diapositive vierge blanche dans un éditeur de diapositives (logiciels tels que PowerPoint ou Keynote suffira). Utilisez l’outil de forme pour faire deux étoiles de même tailles avec aucune couleur de remplissage, seulement un mince contour noir. Centrer verticalement sur la diapositive et placer un de chaque côté (gauche et droite). Placer un petit disque noir au centre de la lame entre les étoiles. C’est le point de fixation. Maintenant, faite…

Results

For each of the inducer colors in the experiment, identify the most frequently selected after-color. Make a table that visualizes the results, like the one in Figure 8.

Figure 8
Figure 8. Representative result. Most frequently selected after-colors as a function of inducer colors. The most frequently perceived after-colors will be opponent values of the respective inducers.

The most frequently perceived after-colors should be opponent values of the respective inducer colors. The reason is because color-sensitive cells in the human brain are mapped spatially-they respond to specific regions of space dependent on where the subject fixates their eyes. Normally, people move their eyes around, causing different cells to share the burden of responding to regions of external space. By fixating the disc in the inducer images (slide #1 in each pair), the observer causes the same groups of cells to respond in a sustained way to the saturated colors present in a given region of external space. During the fixation period, these cells respond heavily. Blue-sensitive cells produce large blue signals, yellow-sensitive cells produce large yellow signals, and so on. When the black and white image is suddenly shown, and while the observer still fixates, these cells are no longer stimulated-there is no color in the image. But, because they were signaling so strongly a moment before, the rest of the brain interprets their sudden lack of activity as signaling the presence of an opponent color. The sudden lack of signaling in blue-sensitive cells is interpreted as the presence of yellow. The sudden lack of signaling in the yellow-sensitive cells is interpreted as the presence of blue, and so on. The brain interprets the absence of activity in color cells as indicating the presence of opponent colors, when in fact the lack of activity in this case is caused by the absence of color altogether. The brain is effectively tricked, causing people to see colors where there aren't any because of the way it organizes color in terms of opponent dimensions.

Applications and Summary

Color opponency is among the great demonstrations of the scientific method. Researchers in the 1800s were able to infer the nature of color representation in the human brain without any ability to observe brain activity. Today, in fact, color afterimages have become a useful tool for identifying the brain regions involved in processing color. In monkeys, scientists have recorded neurons that fire as though color is present, when it is not, after showing the monkeys sequences of slides that produce afterimages in human observers.1,2 Similarly, with fMRI, scientists have found regions of visual cortex that respond selectively to presence of a color, and that also respond when that color is perceived as an illusion, induced by an afterimage pair of slides.

References

  1. Zeki, S. Colour coding in the cerebral cortex: the reaction of cells in monkey visual cortex to wavelengths and colours. Neuroscience, 9(4), 741-765 (1983).
  2. Conway, B. R., & Tsao, D. Y. Color architecture in alert macaque cortex revealed by FMRI. Cerebral Cortex, 16(11), 1604-1613 (2006).

Transcript

Human color vision is impressive, and can help us see—and distinguish between—over a million distinct hues. Psychologists use a visual illusion called the color afterimage to study our perception of color.

What a person perceives as the hue of objects they encounter, like an orange, starts with sensory information received by the eyes.

When this light enters an individual’s eyes, the cornea and lens focus it onto photoreceptor cells in the retina. In response, these cells generate signals that are relayed to the visual cortex, where the colors of objects are identified.

Along this pathway, individual neurons exist that respond differently to distinct color signals.

For example, there are certain neurons—called “green on, red off” cells—that are only activated by green light. However, these same cells are inhibited by red light.

Similarly, there are neurons called “red on, green off” cells that respond to red, but which are inhibited by green. Thus, components of the brain treat these colors as “opponents”: the presence of one is interpreted as the other being absent.

As a result, green and red can be thought of as occupying opposite values on a two-dimensional plane—respectively, negative and positive. In fact, all the specific individual colors that we see are ordered pairs of points in this coordinate system.

This video demonstrates how to investigate such opponency, originally discovered by Ewald Hering in 1878, using the color afterimage illusion—where individuals’ brains are tricked into perceiving an opponent color in a position previously filled by its antagonistic hue.

We not only explain how to generate stimuli, and collect and interpret color perception data, but we also explore how researchers can apply this illusion to study different facets of color vision.

In this experiment, participants are asked to perform several trials in which they must first stare at colored shapes—during what is called the inducer phase—and then while looking at the same shapes in black and white, state what hues they see—referred to as the afterimage phase.

During the first inducer phase, two of the same shape—like a star—are shown side-by-side on a computer screen for 10 s. These shapes are identical in size and orientation, but are filled with different colors, such as blue and yellow, each of which should have a distinct opponent—a stipulation critical for the second phase.

For the duration of each trial, participants are instructed to fixate on a circle centered between the shapes, in order to prevent eye movements that could interfere with the illusion.

In the afterimage phase, the black disc remains onscreen, but the colored pictures on either side of it are replaced by images of the same shapes devoid of color—white stars outlined in black.

Participants are then asked what hue they see in a random position in a star, and the color they report serves as the dependent variable.

The trick here is that during the inducer phase, color-sensitive cells are active—for example, some fire heavily in response to a blue stimulus. However, the switch from the inducer stars to black-and-white shapes results in these cells suddenly ceasing to signal due to the absence of any color.

Yet, participants’ brains interpret this abrupt stoppage as meaning that the opponent colors are present—a lack of signaling from previously active blue-sensitive cells is taken as evidence for yellow.

As a result, participants will fill in the black-and-white shapes with the opponent colors of those shown during the inducer phase—where a blue inducer star was, a yellow afterimage star is perceived, and vice versa.

This is the color afterimage illusion, which quickly fades as soon as participants move their eyes.

Due to how the brain organizes colors, it is expected that participants will predominantly see after-colors that are opponents of the inducer: green for red, for example.

To prepare stimuli for the experiment, first open a blank slide in a slide-editing program. Use the shape tool to generate two equally-sized stars—one on the right side and the other on the left—both centered vertically.

Then, create a small black disc positioned between them to serve as the fixation point.

To generate images for an inducer phase, outline both shapes in black. Then, select the star on the left and fill it uniformly with a bright blue. Similarly, fill the right one with a bright yellow.

Repeat this process, creating additional inducer slides with stars in different colors, like green and red and another set in green and blue.

Now, copy one of the inducer slides. In this replica, keep both stars outlined in black, but change their internal colors to white. This completed slide will be shown in the afterimage phase of all trials.

Finally, arrange them so that each stimulus series consists of two slides: a colored inducer set followed by an afterimage one in black and white for each trial.

When the participant arrives, direct them to a computer monitor and verify that they are not color-blind. Proceed by explaining the instructions for the task that they will be performing.

Emphasize that throughout a trial, the participant should try to avoid moving their eyes, and remain focused on the black disc that will appear in the center of the computer screen.

Once you are confident that the participant understands the afterimage task, have them perform between 10 and 20 trials. For each one, next to inducer-color, record the hue that was selected as the after-color.

To analyze the data, tally the results and construct a table depicting the most frequently selected after-color for each inducer color.

Notice that the selected after-colors are predominantly opponents of the inducer hues, indicating that the participants’ brains were tricked, causing them to see hues that weren’t actually there—color afterimage illusions.

Now that you know how to use visual stimuli to elicit a color afterimage illusion, let’s look at how researchers can use this technique to better understand the anatomical basis behind color vision, and diseases that affect this perception.

Up until now, we’ve focused on normal vision. However, variations of the afterimage test can also be employed to better understand diseases that affect color perception—like types of color blindness in which both hues of an opponent pair appear the same.

For example, researchers can compare how long an individual perceives a color afterimage to times reported by normal, control participants. Illusions persisting for abnormal lengths of time can be indicative of a color vision disease.

Afterimage tests can then be paired with other color perception assessments and imaging techniques to pinpoint whether a defect in the retina, visual cortex, or the visual pathway—which relays signals between these two areas—is responsible.

You’ve just watched JoVE’s video on color afterimages. By now, you should know how to use shapes of different hues to investigate this illusion, and collect and interpret opponent color data. Importantly, you should also have an understanding of how afterimages can help identify brain regions involved in color perception, and diagnose diseases relating to color vision.

Thanks for watching!

Tags

Cite This
JoVE Science Education Database. JoVE Science Education. Color Afterimages. JoVE, Cambridge, MA, (2023).