Human color vision is impressive, and can help us see—and distinguish between—over a million distinct hues. Psychologists use a visual illusion called the color afterimage to study our perception of color.
What a person perceives as the hue of objects they encounter, like an orange, starts with sensory information received by the eyes.
When this light enters an individual’s eyes, the cornea and lens focus it onto photoreceptor cells in the retina. In response, these cells generate signals that are relayed to the visual cortex, where the colors of objects are identified.
Along this pathway, individual neurons exist that respond differently to distinct color signals.
For example, there are certain neurons—called “green on, red off” cells—that are only activated by green light. However, these same cells are inhibited by red light.
Similarly, there are neurons called “red on, green off” cells that respond to red, but which are inhibited by green. Thus, components of the brain treat these colors as “opponents”: the presence of one is interpreted as the other being absent.
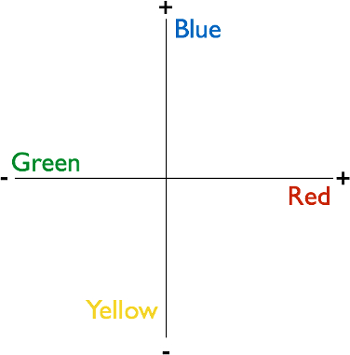
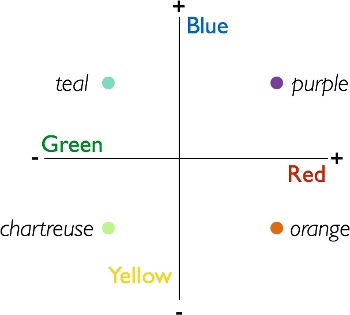
As a result, green and red can be thought of as occupying opposite values on a two-dimensional plane—respectively, negative and positive. In fact, all the specific individual colors that we see are ordered pairs of points in this coordinate system.
This video demonstrates how to investigate such opponency, originally discovered by Ewald Hering in 1878, using the color afterimage illusion—where individuals’ brains are tricked into perceiving an opponent color in a position previously filled by its antagonistic hue.
We not only explain how to generate stimuli, and collect and interpret color perception data, but we also explore how researchers can apply this illusion to study different facets of color vision.
In this experiment, participants are asked to perform several trials in which they must first stare at colored shapes—during what is called the inducer phase—and then while looking at the same shapes in black and white, state what hues they see—referred to as the afterimage phase.
During the first inducer phase, two of the same shape—like a star—are shown side-by-side on a computer screen for 10 s. These shapes are identical in size and orientation, but are filled with different colors, such as blue and yellow, each of which should have a distinct opponent—a stipulation critical for the second phase.
For the duration of each trial, participants are instructed to fixate on a circle centered between the shapes, in order to prevent eye movements that could interfere with the illusion.
In the afterimage phase, the black disc remains onscreen, but the colored pictures on either side of it are replaced by images of the same shapes devoid of color—white stars outlined in black.
Participants are then asked what hue they see in a random position in a star, and the color they report serves as the dependent variable.
The trick here is that during the inducer phase, color-sensitive cells are active—for example, some fire heavily in response to a blue stimulus. However, the switch from the inducer stars to black-and-white shapes results in these cells suddenly ceasing to signal due to the absence of any color.
Yet, participants’ brains interpret this abrupt stoppage as meaning that the opponent colors are present—a lack of signaling from previously active blue-sensitive cells is taken as evidence for yellow.
As a result, participants will fill in the black-and-white shapes with the opponent colors of those shown during the inducer phase—where a blue inducer star was, a yellow afterimage star is perceived, and vice versa.
This is the color afterimage illusion, which quickly fades as soon as participants move their eyes.
Due to how the brain organizes colors, it is expected that participants will predominantly see after-colors that are opponents of the inducer: green for red, for example.
To prepare stimuli for the experiment, first open a blank slide in a slide-editing program. Use the shape tool to generate two equally-sized stars—one on the right side and the other on the left—both centered vertically.
Then, create a small black disc positioned between them to serve as the fixation point.
To generate images for an inducer phase, outline both shapes in black. Then, select the star on the left and fill it uniformly with a bright blue. Similarly, fill the right one with a bright yellow.
Repeat this process, creating additional inducer slides with stars in different colors, like green and red and another set in green and blue.
Now, copy one of the inducer slides. In this replica, keep both stars outlined in black, but change their internal colors to white. This completed slide will be shown in the afterimage phase of all trials.
Finally, arrange them so that each stimulus series consists of two slides: a colored inducer set followed by an afterimage one in black and white for each trial.
When the participant arrives, direct them to a computer monitor and verify that they are not color-blind. Proceed by explaining the instructions for the task that they will be performing.
Emphasize that throughout a trial, the participant should try to avoid moving their eyes, and remain focused on the black disc that will appear in the center of the computer screen.
Once you are confident that the participant understands the afterimage task, have them perform between 10 and 20 trials. For each one, next to inducer-color, record the hue that was selected as the after-color.
To analyze the data, tally the results and construct a table depicting the most frequently selected after-color for each inducer color.
Notice that the selected after-colors are predominantly opponents of the inducer hues, indicating that the participants’ brains were tricked, causing them to see hues that weren’t actually there—color afterimage illusions.
Now that you know how to use visual stimuli to elicit a color afterimage illusion, let’s look at how researchers can use this technique to better understand the anatomical basis behind color vision, and diseases that affect this perception.
Up until now, we’ve focused on normal vision. However, variations of the afterimage test can also be employed to better understand diseases that affect color perception—like types of color blindness in which both hues of an opponent pair appear the same.
For example, researchers can compare how long an individual perceives a color afterimage to times reported by normal, control participants. Illusions persisting for abnormal lengths of time can be indicative of a color vision disease.
Afterimage tests can then be paired with other color perception assessments and imaging techniques to pinpoint whether a defect in the retina, visual cortex, or the visual pathway—which relays signals between these two areas—is responsible.
You’ve just watched JoVE’s video on color afterimages. By now, you should know how to use shapes of different hues to investigate this illusion, and collect and interpret opponent color data. Importantly, you should also have an understanding of how afterimages can help identify brain regions involved in color perception, and diagnose diseases relating to color vision.
Thanks for watching!