JoVE Science Education
Sensation and Perception
A subscription to JoVE is required to view this content.  Sign in or start your free trial.
JoVE Science Education Sensation and Perception
Color Afterimages
  • 00:00Overview
  • 02:21Experimental Design
  • 04:55Running the Experiment
  • 07:00Representative Results
  • 07:31Applications
  • 08:44Summary

Reflejo de color

English

Share

Overview

Fuente: Laboratorio de Jonathan Flombaum, Johns Hopkins University

La visión de color humana es impresionante. Personas con visión de color normal pueden decir apart millones de matices individuales. Más asombrosamente, esta capacidad se logra con hardware bastante simple.

Parte del poder de la visión de color humana viene de un poco inteligente de ingeniería en el cerebro humano. Allí, percepción del color depende de lo que se conoce como un ‘sistema oponente’. Esto significa que la presencia de un tipo de estímulo es tratada como evidencia de la ausencia del otro y viceversa; ausencia de un tipo de estímulo es tomado como evidencia de la presencia del otro. En particular, en el cerebro humano hay células que disparan cuando reciben señales que sugieren que la luz azul está presente, o cuando no reciben señales que sugieren luz amarilla. Del mismo modo, hay células que fuego en la presencia de amarillo o la ausencia de azul. Azul y amarillo son tratados así como oponentes valores en una dimensión y pueden considerarse como negativa versus valores positivos sobre un eje de un plano cartesiano. Si un estímulo se caracteriza por tener un valor negativo en ese eje, también no puede tener un valor positivo. Así que, si se caracteriza por ser amarillo, no puede también ser caracterizado como azul. Del mismo modo, verde y rojo (o realmente, magenta), ocupar otra dimensión oponente. Hay células en el cerebro humano que responde a la presencia de uno o la ausencia de la otra. Las figuras 1 y 2 explican oposición de color en términos cartesianos.

Figure 1
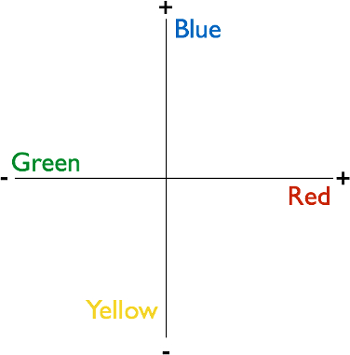
Figura 1. Dimensiones de color oponente. El cerebro humano procesos de color mediante un sistema de dimensiones oponente. Se trata de un plano bidimensional con azul y amarillo ocupando un eje, que puede ser pensado como simplemente positivos o negativos y verde y rojo ocupa el otro eje. La consecuencia del sistema es que el cerebro procesa la presencia de algunos colores como indicando la ausencia de otros y viceversa. Todos los colores perceptibles ocupan un punto en el espacio opositor.

Figure 2
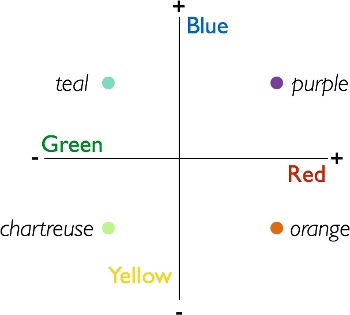
Figura 2. Todos los colores perceptibles ocupan un punto en el espacio adversario. Se muestran aquí ejemplos de colores que tienen valores distinto de cero en cada uno de dos dimensiones del espacio opositor.

Una manera de que oposición de color fue descubierto en 1878 por Ewald Hering, incluso antes de que los científicos tuvieron acceso a técnicas para la proyección de imagen del cerebro sí mismo-es a través de una ilusión conocida como una sombra de color. Retina todavía se utiliza hoy para demostrar las propiedades oponentes de opinión de color humana y estudiarlas.

Este video muestra cómo crear una ilusión de sombra de color y una forma sencilla de recopilar respuestas de percepción subjetivas de observadores humanos.

Procedure

1. estímulos Abrir una diapositiva blanca en blanco en un editor de diapositivas (software como PowerPoint o Keynote será suficiente). Utilice la herramienta forma para hacer que dos estrellas de igual tamaños con sin relleno de color, sólo un fino contorno negro. En el centro verticalmente en la diapositiva y coloque uno en cada lado (izquierdo y derecho). Coloque un pequeño disco negro en el centro de la diapositiva entre las estrellas. Este es el punto de fijación. Ahora…

Results

For each of the inducer colors in the experiment, identify the most frequently selected after-color. Make a table that visualizes the results, like the one in Figure 8.

Figure 8
Figure 8. Representative result. Most frequently selected after-colors as a function of inducer colors. The most frequently perceived after-colors will be opponent values of the respective inducers.

The most frequently perceived after-colors should be opponent values of the respective inducer colors. The reason is because color-sensitive cells in the human brain are mapped spatially-they respond to specific regions of space dependent on where the subject fixates their eyes. Normally, people move their eyes around, causing different cells to share the burden of responding to regions of external space. By fixating the disc in the inducer images (slide #1 in each pair), the observer causes the same groups of cells to respond in a sustained way to the saturated colors present in a given region of external space. During the fixation period, these cells respond heavily. Blue-sensitive cells produce large blue signals, yellow-sensitive cells produce large yellow signals, and so on. When the black and white image is suddenly shown, and while the observer still fixates, these cells are no longer stimulated-there is no color in the image. But, because they were signaling so strongly a moment before, the rest of the brain interprets their sudden lack of activity as signaling the presence of an opponent color. The sudden lack of signaling in blue-sensitive cells is interpreted as the presence of yellow. The sudden lack of signaling in the yellow-sensitive cells is interpreted as the presence of blue, and so on. The brain interprets the absence of activity in color cells as indicating the presence of opponent colors, when in fact the lack of activity in this case is caused by the absence of color altogether. The brain is effectively tricked, causing people to see colors where there aren't any because of the way it organizes color in terms of opponent dimensions.

Applications and Summary

Color opponency is among the great demonstrations of the scientific method. Researchers in the 1800s were able to infer the nature of color representation in the human brain without any ability to observe brain activity. Today, in fact, color afterimages have become a useful tool for identifying the brain regions involved in processing color. In monkeys, scientists have recorded neurons that fire as though color is present, when it is not, after showing the monkeys sequences of slides that produce afterimages in human observers.1,2 Similarly, with fMRI, scientists have found regions of visual cortex that respond selectively to presence of a color, and that also respond when that color is perceived as an illusion, induced by an afterimage pair of slides.

References

  1. Zeki, S. Colour coding in the cerebral cortex: the reaction of cells in monkey visual cortex to wavelengths and colours. Neuroscience, 9(4), 741-765 (1983).
  2. Conway, B. R., & Tsao, D. Y. Color architecture in alert macaque cortex revealed by FMRI. Cerebral Cortex, 16(11), 1604-1613 (2006).

Transcript

Human color vision is impressive, and can help us see—and distinguish between—over a million distinct hues. Psychologists use a visual illusion called the color afterimage to study our perception of color.

What a person perceives as the hue of objects they encounter, like an orange, starts with sensory information received by the eyes.

When this light enters an individual’s eyes, the cornea and lens focus it onto photoreceptor cells in the retina. In response, these cells generate signals that are relayed to the visual cortex, where the colors of objects are identified.

Along this pathway, individual neurons exist that respond differently to distinct color signals.

For example, there are certain neurons—called “green on, red off” cells—that are only activated by green light. However, these same cells are inhibited by red light.

Similarly, there are neurons called “red on, green off” cells that respond to red, but which are inhibited by green. Thus, components of the brain treat these colors as “opponents”: the presence of one is interpreted as the other being absent.

As a result, green and red can be thought of as occupying opposite values on a two-dimensional plane—respectively, negative and positive. In fact, all the specific individual colors that we see are ordered pairs of points in this coordinate system.

This video demonstrates how to investigate such opponency, originally discovered by Ewald Hering in 1878, using the color afterimage illusion—where individuals’ brains are tricked into perceiving an opponent color in a position previously filled by its antagonistic hue.

We not only explain how to generate stimuli, and collect and interpret color perception data, but we also explore how researchers can apply this illusion to study different facets of color vision.

In this experiment, participants are asked to perform several trials in which they must first stare at colored shapes—during what is called the inducer phase—and then while looking at the same shapes in black and white, state what hues they see—referred to as the afterimage phase.

During the first inducer phase, two of the same shape—like a star—are shown side-by-side on a computer screen for 10 s. These shapes are identical in size and orientation, but are filled with different colors, such as blue and yellow, each of which should have a distinct opponent—a stipulation critical for the second phase.

For the duration of each trial, participants are instructed to fixate on a circle centered between the shapes, in order to prevent eye movements that could interfere with the illusion.

In the afterimage phase, the black disc remains onscreen, but the colored pictures on either side of it are replaced by images of the same shapes devoid of color—white stars outlined in black.

Participants are then asked what hue they see in a random position in a star, and the color they report serves as the dependent variable.

The trick here is that during the inducer phase, color-sensitive cells are active—for example, some fire heavily in response to a blue stimulus. However, the switch from the inducer stars to black-and-white shapes results in these cells suddenly ceasing to signal due to the absence of any color.

Yet, participants’ brains interpret this abrupt stoppage as meaning that the opponent colors are present—a lack of signaling from previously active blue-sensitive cells is taken as evidence for yellow.

As a result, participants will fill in the black-and-white shapes with the opponent colors of those shown during the inducer phase—where a blue inducer star was, a yellow afterimage star is perceived, and vice versa.

This is the color afterimage illusion, which quickly fades as soon as participants move their eyes.

Due to how the brain organizes colors, it is expected that participants will predominantly see after-colors that are opponents of the inducer: green for red, for example.

To prepare stimuli for the experiment, first open a blank slide in a slide-editing program. Use the shape tool to generate two equally-sized stars—one on the right side and the other on the left—both centered vertically.

Then, create a small black disc positioned between them to serve as the fixation point.

To generate images for an inducer phase, outline both shapes in black. Then, select the star on the left and fill it uniformly with a bright blue. Similarly, fill the right one with a bright yellow.

Repeat this process, creating additional inducer slides with stars in different colors, like green and red and another set in green and blue.

Now, copy one of the inducer slides. In this replica, keep both stars outlined in black, but change their internal colors to white. This completed slide will be shown in the afterimage phase of all trials.

Finally, arrange them so that each stimulus series consists of two slides: a colored inducer set followed by an afterimage one in black and white for each trial.

When the participant arrives, direct them to a computer monitor and verify that they are not color-blind. Proceed by explaining the instructions for the task that they will be performing.

Emphasize that throughout a trial, the participant should try to avoid moving their eyes, and remain focused on the black disc that will appear in the center of the computer screen.

Once you are confident that the participant understands the afterimage task, have them perform between 10 and 20 trials. For each one, next to inducer-color, record the hue that was selected as the after-color.

To analyze the data, tally the results and construct a table depicting the most frequently selected after-color for each inducer color.

Notice that the selected after-colors are predominantly opponents of the inducer hues, indicating that the participants’ brains were tricked, causing them to see hues that weren’t actually there—color afterimage illusions.

Now that you know how to use visual stimuli to elicit a color afterimage illusion, let’s look at how researchers can use this technique to better understand the anatomical basis behind color vision, and diseases that affect this perception.

Up until now, we’ve focused on normal vision. However, variations of the afterimage test can also be employed to better understand diseases that affect color perception—like types of color blindness in which both hues of an opponent pair appear the same.

For example, researchers can compare how long an individual perceives a color afterimage to times reported by normal, control participants. Illusions persisting for abnormal lengths of time can be indicative of a color vision disease.

Afterimage tests can then be paired with other color perception assessments and imaging techniques to pinpoint whether a defect in the retina, visual cortex, or the visual pathway—which relays signals between these two areas—is responsible.

You’ve just watched JoVE’s video on color afterimages. By now, you should know how to use shapes of different hues to investigate this illusion, and collect and interpret opponent color data. Importantly, you should also have an understanding of how afterimages can help identify brain regions involved in color perception, and diagnose diseases relating to color vision.

Thanks for watching!

Tags

Cite This
JoVE Science Education Database. JoVE Science Education. Color Afterimages. JoVE, Cambridge, MA, (2023).