A subscription to JoVE is required to view this content.  Sign in or start your free trial.
Flow Cytometry and Fluorescence-Activated Cell Sorting (FACS): Isolation of Splenic B Lymphocytes
  • 00:01Concepts
  • 02:32Preparation of Materials and Mouse Dissection
  • 04:00Immune Cell Isolation
  • 05:49Cell Staining
  • 07:28FACS Calibration
  • 10:43Flow Cytometry and Purity Control
  • 15:17Data Analysis and Results

Citometría de flujo y clasificación de células activadas por fluorescencia (FACS): Aislamiento de linfocitos B esplénicos

English

Share

Overview

Fuente: Perchet Thibaut1,2,3, Meunier Sylvain1,2,3, Sophie Novault4, Rachel Golub1,2,3
1 Unidad de Linfopoyesis, Departamento de Inmunología, Instituto Pasteur, París, Francia
2 INSERM U1223, París, Francia
3 Université Paris Diderot, Sorbonne Paris Cité, Cellule Pasteur, París, Francia
4 Flow Cytometry Platfrom, Citometría y Biomarcadores UtechS, Centro de Ciencias Traslacionales, Instituto Pasteur, París, Francia

La función general del sistema inmunológico es defender el cuerpo contra organismos infecciosos y otros invasores. Los glóbulos blancos, o leucocitos, son los actores clave del sistema inmunitario. Tras la infección, se activan e inician una respuesta inmunitaria. Los leucocitos se pueden dividir en varias subpoblaciones (por ejemplo, células mieloides, linfocitos, células dendríticas) basándose en diferentes parámetros que pueden ser biológicos, físicos y/o funcionales (por ejemplo, tamaño, granularidad y secreción). Una forma de caracterizar a los leucocitos es a través de sus proteínas superficiales, que son principalmente receptores. Cada población de leucocitos expresa una combinación específica de receptores (por ejemplo, citotóxicos, activadores, receptores de migración) que pueden definir subconjuntos entre las poblaciones. Como el sistema inmunitario abarca una amplia gama de poblaciones celulares, es esencial caracterizarlas para descifrar su participación en la respuesta inmunitaria.

La citometría de flujo (FC o FCM) es un método ampliamente utilizado para analizar la expresión de la superficie celular y las moléculas intracelulares, caracterizando y definiendo diferentes tipos de células en una mezcla de células heterogéneas. Los citometros de flujo se componen de tres subsistemas principales: fluidos, ópticos y electrónicos. El sistema de fluidos transporta las células en una corriente de tal manera que pasan delante de un láser uno por uno. El sistema óptico consta de fuentes de luz (láser) para iluminar las partículas, filtros ópticos para dirigir la luz resultante y señales fluorescentes a los detectores adecuados. Por último, el sistema electrónico convierte las señales de luz detectadas en señales electrónicas que pueden ser procesadas por el ordenador. A medida que una célula individual pasa delante del rayo láser, dispersa la luz. Un detector delante del haz mide la dispersión hacia adelante (FS) y varios detectores hacia el lado de la dispersión lateral (SC). El FS se correlaciona con el tamaño de celda y SC es proporcional a la granularidad de las células. De esta manera, las poblaciones celulares a menudo se pueden distinguir en función de las diferencias en su tamaño y granularidad solamente.

Además de analizar el tamaño, la forma y la complejidad de una célula, la citometría de flujo se utiliza ampliamente para detectar la expresión de los receptores de superficie celular (1). Esto se logra mediante el uso de anticuerpos monoclonales etiquetados con fluorocromo que se unen a receptores específicos de células conocidos. Tras la excitación, estos fluorocromos enlazados emiten una luz de longitud de onda específica, llamada longitud de onda de emisión, que puede ser detectada y puntuada. Las mediciones de fluorescencia proporcionan datos cuantitativos y cualitativos sobre los receptores de superficie celular etiquetados con fluorocromo. Los hematólogos utilizaron por primera vez la FC para el seguimiento terapéutico de las poblaciones de células inmunitarias (2). Ahora, se utiliza para una amplia gama de aplicaciones tales como inmunofenotipado, viabilidad celular, expresión génica, recuento celular y análisis de GFP.

FACS (Fluorescent Activated Cell Sorter) es un tipo especializado de citometría de flujo, que ordena una población de células en subpoblación utilizando etiquetado fluorescente. Al igual que la citometría de flujo convencional, se recopilan los primeros datos FS, SC y fluorescentes. A continuación, la máquina aplica una carga (negativa o positiva) y un sistema de desviación electrostática (electroimanes) facilita la recolección de gotas cargadas que contienen células en tubos apropiados.

Figure 1
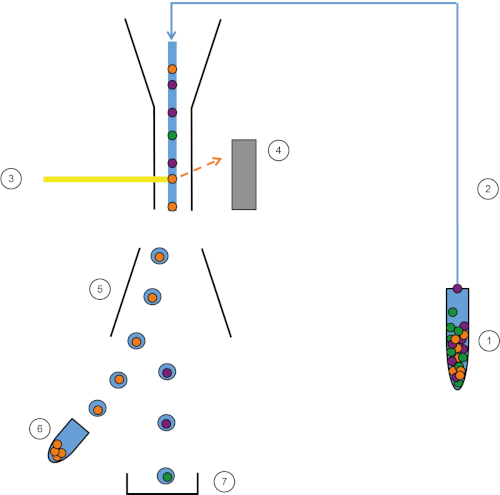
Figura 1: Representación esquemática de FACS. La muestra (1) se aspira en el FACS (2) y se pasa delante del láser (3). La fluorescencia celular es sintensada por detectores de fluorescencia (4). Finalmente, las células se incorporan en gotas y las células de interés son desviadas por placas de desviación (5) y recogidas en un tubo de recolección (6). Las celdas restantes entran en la basura (7). Haga clic aquí para ver una versión más grande de esta figura.

El aspecto de clasificación del FACS presenta muchas ventajas. Muchas pruebas pueden ayudar a entender el papel de las células específicas en el sistema inmunitario, como los análisis de la expresión génica como RT-qPCR, ciclo celular o secreción de citoquinas. Sin embargo, las células deben purificarse aguas arriba para obtener resultados claros y específicos. Aquí, FACS viene en útil y las células deseadas se pueden clasificar con gran pureza, produciendo resultados altamente confiables y reproducibles. FacS también se puede utilizar para clasificar las células en función de la tinción nuclear u otra intracelular y de acuerdo con la presencia, ausencia y densidad de los receptores de superficie. FACS es ahora una técnica estándar para la purificación de subpoblaciones de células y tiene la capacidad de ordenar hasta cuatro poblaciones simultáneamente.

Este ejercicio de laboratorio demuestra cómo aislar leucocitos esplénicos y luego cómo clasificar específicamente las células linfoides B de la mezcla de células de leucocitos esplénicos utilizando FACS.

Procedure

1. Preparación Antes de comenzar, ponte guantes de laboratorio y la ropa protectora adecuada. Esterilice todas las herramientas de disección, primero con un detergente y luego con 70% de etanol y luego seque bien. Preparar 50 ml de la solución salina equilibrada de Hank (HBSS) que contiene un 2% de suero de becerro fetal (FCS). 2. Disección Usando un sistema de administración de dióxido de carbono, eutanasia …

Results

In this protocol, we purified splenic B lymphocytes using FACS technology. We first isolated leukocytes from the spleen and stained them. Using a combination of B cell surface markers, we created a gating strategy to sort them (Figure 2, top panel). At the end of the experiment we verified if cells in the collection tube were B cells via a "purity test". We kept the same gating strategy and observed that more than 98% of the cells were indeed B cells (Figure 2, bottom panel). Thus, FACS is an effective protocol to isolate immune cell populations with a high degree of purity. Collected cells can then be used for downstream experiments such as cell culture, RT-qPCR, and cytotoxicity assays.

Figure 2
Figure 2: Gating strategy and testing post-sort purity. (A) Cells were first gated based on their morphology (left: FSC-A, SSC-A), then only alive (middle left: viability, CD45), CD45+ cells (CD45, CD3) were plotted against CD19 and CD3. Only CD19+ cells were sorted. (B) Purity test results of a fraction of cells obtained after cell sorting. Please click here to view a larger version of this figure.

Applications and Summary

Flow cytometry is a first-hand technique to characterize and sort immune cell populations with a high degree of purity. It is primordial tool in research field as it allows enrichment of specific cell populations and to decipher the immune response to pathogens. With the increase in number of available fluorochromes and cytometers, the number of detectable parameters is highly increased. As a result, bioinformatic analysis of FACS data has begun to emerge and have opened new horizons to flow cytometry (3). Flow cytometry offers other applications in haematology and oncology (4) where it is used for developing diagnostic tools.

References

  1. Lanier, L. L. Just the FACS. The Journal of Immunology, 193 (5), 2043-2044 (2014).
  2. Walker, J. M. Epiblast Stem Cells IN Series Editor.
  3. Tung, J. W., Heydari, K., Tirouvanziam, R., Sahaf, B., Parks. D. R., Herzenberg, L. A., and Herzenberg. L. A. Modern Flow Cytometry: A Practical Approach. Clinics in Laboratory Medicine. 27 (3), 453-468 (2007).
  4. Walker, J. M. Tumor Angiogenesis Assays IN Series Editor.

Transcript

The immune system protects the body from invading pathogens by generating leukocytes, also called white blood cells. When a pathogen successfully infects an organism, a wide variety of leukocytes are activated and this coordinated reaction is called an immune response.

Frequently, it is useful for researchers to be able to identify the specific type and number of immune cells that have been activated in response to a pathogen. Flow cytometry is a technique that allows researchers to separate cells based on specific epitopes expressed on their surfaces. This is accomplished using fluorochrome-tagged monoclonal antibodies which bind to known immune cell specific epitopes, and upon excitation, these bound fluorochromes emit a wavelength of light which can be detected and scored by a flow cytometer.

Flow cytometers are composed of three systems. The fluidic system transports cells in a stream such that they pass in front of a laser one by one. The optical system is composed of lasers and detectors which recognize the presence or absence of the fluorophores. Finally, the electronic system converts the collected optical data into electronic files for analysis.

An extension of flow cytometry is the Fluorescence-Activated Cell Sorter, or FACS, which allows for the enrichment of specific cell populations so they can be studied independently. Cell sorting is accomplished using a vibrating nozzle within the fluidics stream which forms micro droplets, each containing a single cell. Then, a detector determines whether or not fluorescent light is being emitted from each droplet, and based on that information, an electromagnet gives each cell a negative or positive charge. Next, a strong electric field sorts the differently charged droplets into separate containers. Ultimately, one of the containers will contain a homogenous population of cells based on the expression of a specific cell surface molecule.

In this video, you will learn how to use flow cytometry to isolate leukocytes from mouse spleen tissue and FACS to select for B lymphocytes.

To begin, put on laboratory gloves and the appropriate protective clothing. Next, wash a pair of dissecting scissors and forceps first with detergent and then with 70% ethanol and then dry them with a clean paper towel.

Then, add 49 milliliters of Hank’s Balanced Salt Solution, or HBSS, to a 50 milliliter tube. Add one milliliter of Fetal Calf Serum, or FCS, to create an HBSS 2% FCS solution and mix by gently pipetting up and down approximately 10 times.

Next, place a euthanized mouse in the supine position on a dissection plate. With the scissors and forceps, perform a longitudinal laparotomy to access the abdominal cavity. Use the forceps to move the intestines on the right side of the abdomen to one side to expose the stomach and spleen. The spleen is attached to the stomach. Then, with a pipette, place five milliliters of the HBSS 2% FCS into a Petri dish. Using forceps, carefully detach the spleen from the stomach and place the spleen into the Petri dish.

To isolate the immune cells, first place the spleen on a 40 micron cell strainer in a Petri dish. Crush the spleen with a plunger to dissociate it into the dish. Then, pipette the dissociated spleen and fluid from the Petri dish into a 15 milliliter centrifuge tube. Centrifuge the tube at 370 times g for seven minutes at 10 degrees Celsius and then retrieve the tube carefully so as not to disturb the pellet.

Now, remove the supernatant, avoiding the pellet, and discard the liquid in an appropriate waste container. Then, add two milliliters of ACK lysing buffer into the centrifuge tube to resuspend and lyse the erythrocytes. Wait two minutes and then add HBSS 2% FCS to obtain a total volume of 15 milliliters. Repeat the centrifugation. Retrieve the tube carefully and discard the supernatant. Resuspend the pellet again in five milliliters of HBSS 2% FCS.

To count the resuspended cells, dilute five microliters of the cell suspension with five microliters of Trypan Blue. Then, gently deposit a five microliter drop of this diluted cell suspension between the coverglass and the Malassez slide. Now, under a microscope at 40X magnification, count the number of cells present. Then, adjust the cell concentration to 10 to the seventh cells per milliliter by adding the appropriate volume of HBSS 2% FCS.

To stain the immune cells, start by labeling six FACS tubes from one to six. Then, transfer 200 microliters of the cell solution into each of the six tubes. Centrifuge these tubes at 370 times g for seven minutes at 10 degrees Celsius and remove the supernatant.

Then, label six new FACS tubes as one through six and pipette 200 microliters of HBSS 2% FCS into each. Prepare the six novel antibody mixes by adding the appropriate amount of antibody to each tube according to table one. Mix one is for unstained cells with no addition of antibody. Mixes two through five each contain a different single antibody for compensation settings. Mix six contains all four antibodies for multi-stained cells to be used for sorting.

Next, transfer these antibody mixes to the corresponding numbered FACS tubes. Incubate these solutions for 20 minutes at four degrees Celsius or on ice in the dark. Next, add one milliliter of HBSS 2% FCS to each tube and then centrifuge again. Discard the supernatant and then resuspend the pellets in 200 microliters of HBSS 2% FCS. Finally, transfer the resuspended pellets to new labeled FACS tubes.

To perform FACS, first turn on the sorter. Then, select the cytometer menu and click fluidics startup. Follow the instructions on the screen.

On the stream tab, click on the red cross to turn on the stream and then wait 15 minutes for the stream to stabilize. Adjust the amplitude of the stream until you see a clear detached drop appear on the stream tab. Then, click sweet spot to complete the amplitude adjustment. Insert the Neutral Density, or ND, filter 1.0 in front of the laser.

Open the cytometer menu at the top of the screen and select CST, which stands for Cytometer Setup and Tracking. To perform daily quality control, first dilute CST beads with FACS medium in a FACS tube following the manufacturer’s instructions. Then, load the tube into the machine and perform the CST control by clicking run on the CST tab.

When the CST control is complete, replace the ND 1.0 filter with the ND 2.0 filter on the cytometer. Next, dilute drop delay beads in FACS medium following the manufacturer’s instructions and then load the tube into the FACS. To ensure proper sorting, perform drop delay by first clicking voltage and then optical filter. The right quadrant of the optical filter should be equal to 100%, indicating that 100% of the drops are registered by the machine. If necessary, adjust the red laser screw on the cytometer left or right to obtain 100% in the right quadrant. It is important to ensure that the stream falls into the collection tube. To do so, perform a test sort by clicking on waste drawer and then test sort. Check that the side streams fall into the collection tubes. If they do not, adjust the voltage under the sorting tab until they do.

Navigate to the experimental template by selecting the browser tab and clicking shared view. Then, open the Accudrop_DROP DELAY experiment and click the sorting layout button. Now, change the threshold rate on the acquisition dashboard by manipulating the flow rate until it reaches 3,000 events per second. Click voltage and then click optical filter. The left quadrant should be equal to zero and right quadrant equal to 100.

Finally, in the sort layout window, click sort and then click cancel. The left quadrant should be equal to 100 and the right quadrant equal to zero. If the left quadrant is less than 95, click auto delay to instruct the software to automatically increase the voltage to obtain 100% of the drops in the left quadrant.

To begin flow cytometry, we will first use unstained cells to define the cell morphology and the negative peaks of the fluorochromes. To do so, place tube one containing unstained cells in the machine and under the acquisition dashboard tab click load. In the cytometer tab, adjust the forward and side scatter voltages until you see your cell population as a dense concentration of dots on the screen. Lymphocytes are small cells, so they will have a low forward scatter and low side scatter.

Next, remove background fluorescence by adjusting the voltage for the fluorochromes in the cytometer tab until the cell populations at a negative level are in the first decade in the global worksheet tab. In the cytometer menu, click on view configuration and verify that all of the fluorochromes are present. Next, place tube two in the cytometer and click load. Adjust the spectral overlap in the cytometer tab until the negative and positive population medians are aligned in the global worksheet tab. On the acquisition tab, set the events to record parameter to 10,000 and click record. Repeat these steps with tubes three, four, and five.

Next, load tube six which contains the multi-stained cells. To isolate B lymphocytes, first set up the parameters to sort the cells based on their morphology. In the first window, plot FSC-A forward scatter area on the y-axis and SSC-A side scatter area on the x-axis. In the scatter plot, each dot represents a cell. Click on polygon gate on the global worksheet and then select the population with a low forward scatter and an intermediate side scatter. On a new dot plot window, right-click on the window and select show populations from the menu and click P1.

Then, in the new window, gate the viable CD45 positive cells by plotting viability on the y-axis and CD45 on the x-axis. Use polygon gate to circle the cells with a low viability and high CD45 signal and select P2 to display the selected cells in a new window. In the next window, gate for CD45 positive leukocytes, excluding T lymphocytes. With CD45 on the x-axis and CD3 on the y-axis, circle the population with a high CD45 signal and low negative CD3 signal and select P3. Finally, gate for CD19 positive cells which identify the B lymphocytes. With CD19 on the y-axis and CD3 on the x-axis, circle the population with a high CD19 signal and a low negative CD3 signal and select P4.

All the sorting parameters are now set. Next, in the sorting layout window, select your cell population of interest- P4, which is the fourth population that was gated, and tells the machine to only sort B lymphocytes. Set target events to 10,000 cells and set precision to purity. We are only sorting one population. However, up to four different populations can be sorted at the same time. Once ready, click sort and OK. Then, wait for cell sorting.

Once cell sorting is complete, perform a purity control by pipetting 10 microliters of the sorted cells into a new FACS tube with 90 microliters of HBSS 2% FCS. Place the tube in the cytometer, click load and then click record to analyze the phenotypes of the cells to verify that the gating strategy worked as intended.

Now, we will analyze the sorted cells to determine the percentage of B lymphocytes among the leukocytes that were isolated from the mouse spleen. To start, double click on the FlowJo icon and drag the files for each tube into the all sample window.

Click on polygon and recreate the gating strategies that were used in the previous section. Next, click layout editor and drag the B lymphocyte populations of interest from tube six and the purity control into the layout editor tab. Dot plots representing B lymphocytes will appear. In this example, the plot on the top right represents the sorted B lymphocytes from the total spleen cell suspension and the plot on the bottom right is the purity control. Cells should only appear in the population of interest in the purity control.

To check the purity of B lymphocytes in the sorted cells, click on table editor. Drag the B lymphocyte population from tube six and purity control in the table. On the statistic menu, select frequency of CD45 positive cells to test the purity of this cell population. Then, click on create table. Parameter values appear in a new table. In the purity control window, check the frequency of B lymphocytes within the CD45 positive cells, which should be higher than 98%.

Tags

Cite This
JoVE Science Education Database. JoVE Science Education. Flow Cytometry and Fluorescence-Activated Cell Sorting (FACS): Isolation of Splenic B Lymphocytes. JoVE, Cambridge, MA, (2023).