The CLEM technique has been adapted to analyze ultrastructural morphology of membranes, organelles, and subcellular structures affected by microinjected molecules. This method combines the powerful techniques of micromanipulation/microinjection, confocal fluorescent microscopy, and electron microscopy to allow millimeter to multi-nanometer resolution. This technique is amenable to a wide variety of applications.
A subscription to JoVE is required to view this content. Sign in or start your free trial.
Method Article
Correlative Light and Electron Microscopy (CLEM) as a Tool to Visualize Microinjected Molecules and their Eukaryotic Sub-cellular Targets
In This Article
Summary
Abstract
The eukaryotic cell relies on complex, highly regulated, and functionally distinct membrane bound compartments that preserve a biochemical polarity necessary for proper cellular function. Understanding how the enzymes, proteins, and cytoskeletal components govern and maintain this biochemical segregation is therefore of paramount importance. The use of fluorescently tagged molecules to localize to and/or perturb subcellular compartments has yielded a wealth of knowledge and advanced our understanding of cellular regulation. Imaging techniques such as fluorescent and confocal microscopy make ascertaining the position of a fluorescently tagged small molecule relatively straightforward, however the resolution of very small structures is limited 1.
On the other hand, electron microscopy has revealed details of subcellular morphology at very high resolution, but its static nature makes it difficult to measure highly dynamic processes with precision 2,3. Thus, the combination of light microscopy with electron microscopy of the same sample, termed Correlative Light and Electron Microscopy (CLEM) 4,5, affords the dual advantages of ultrafast fluorescent imaging with the high-resolution of electron microscopy 6. This powerful technique has been implemented to study many aspects of cell biology 5,7. Since its inception, this procedure has increased our ability to distinguish subcellular architectures and morphologies at high resolution.
Here, we present a streamlined method for performing rapid microinjection followed by CLEM (Fig. 1). The microinjection CLEM procedure can be used to introduce specific quantities of small molecules and/or proteins directly into the eukaryotic cell cytoplasm and study the effects from millimeter to multi-nanometer resolution (Fig. 2). The technique is based on microinjecting cells grown on laser etched glass gridded coverslips affixed to the bottom of live cell dishes and imaging with both confocal fluorescent and electron microscopy. Localization of the cell(s) of interest is facilitated by the grid pattern, which is easily transferred, along with the cells of interest, to the Epon resin used for immobilization of samples and sectioning prior to electron microscopy analysis (Fig. 3). Overlay of fluorescent and EM images allows the user to determine the subcellular localization as well as any morphological and/or ultrastructural changes induced by the microinjected molecule of interest (Fig. 4). This technique is amenable to time points ranging from ≤5 s up to several hours, depending on the nature of the microinjected sample.
Protocol
1. Mammalian Cell Culture
- Normal Rat Kidney (NRK), immortalized cervical cancer (HeLa), or other appropriate mammalian cell lines are cultured at 37°C, 5% CO2, on photoetched glass gridded coverslips affixed to live cell dishes (see Table 1 for any reagent or apparatus used in this protocol) in DMEM + 10% FBS and 1% Pen/Strep. Precautions should be taken to maintain a sterile environment when working with cultured mammalian cells.
- Depending on your experimental time-line (0-5 hours vs 1-2 days post injection) the confluency of cells should be adjusted to ~50% or ~25%, respectively.
2. Microinjection
- Prepare desired protein, DNA, or small molecules in your choice of buffer, depending on its amenability to cellular culture, to a final volume of ~50 μl. Inert fluorescent dyes such as Texas Red or Cascade Blue are included in order to mark the microinjected cells; choice of injection dye and fluorescent probe should have non-overlapping excitation and emission wavelengths. The concentration of your molecule of interest needed for microinjection should be determined empirically, and the fluorescent tracking dyes are commonly used at 0.5-1.0 mg/ml. Typically, rhodamine or another fluorophore is covalently attached to your molecule of interest using a commercial kit, however other methods of detection may be used depending on sensitivity. For more information, see Critical Considerations below.
- Filter the injectant (~50 μl) through a 0.22 μm centrifugal filter. Centrifugal filters are preferred over vacuum and/or syringe filtration which have associated dead volumes.
- To generate the microinjection needle, borosilicate glass pipettes are pulled using a Flaming-Brown Micropipette Puller following manufacturers guidelines. Alternatively, microinjection needles can be purchased from vendors including Eppendorf which makes femtotip microinjection needles.
- Carefully pipette 4 μl of injectant into the unmolested end of the microinjection needle using Eppendorf 20 Femtotips. Ensure that no bubbles are present within the pulled microinjection needle. Load microinjection needle into the micromanipulator arm of the Eppendorf FemptoJet Injectman attached to an inverted microscope. For a good review of the microinjection procedure, the reader is directed to a previous Journal of Visualized Experiments article 8.
- Place live cell dish with gridded coverslip and cultured cells into the dish holder of the inverted Zeiss microscope. Find cells growing within a photoetched grid and note the grids alphanumeric identifier, this will be used in all subsequent steps. Ideally, locate cells at the center of the coverslip as subsequent steps will limit sample transfer at the edges of the coverslip.
- Manually lower injection arm into place over the coverslip, and using the micromanipulator joystick and controls, lower injection needle down until the tip gently touches the surface of the cultured cells and press ‘Limit to prevent movement of needle beyond this point and thus breaking the fragile pulled borosilicate glass. All other aspects of cell microinjection are performed as per Eppendorf FemtoJet InjectMan user manual. The microinjection technique was recently used to understand individual secreted virulence proteins from bacteria 9.
- Microinject every other cell within the chosen grid. With cells grown at ~50% confluency, one can expect ~80 cells per 600 μm2 grid (example shown in Fig. 3A). Therefore, upon fluorescence and electron microscopy inspection, there will be an n of ~30-40 experimental and control cells.
- Place live-cell dish back into mammalian cell culture incubator for desired time as dictated by the experimental setup. Alternatively, one can proceed directly from microinjection to time-lapse microscopy analysis to await the appearance of particular subcellular structures of interest prior to fixation.
3. Fluorescent Microscopy
- If desired, perform live-cell time-lapse fluorescence measurements of microinjected cells, after which, replace the media with 2.5% glutaraldehyde in 0.1 M cacodylate buffer (pH 7.4) and incubate for 10 min at room temperature. However, if live-cell measurements are not required, discard cell growth media and fix the cells with 5 ml 3.7% formaldehyde in 1xPBS at room temperature for 10 minutes. Discard fixative and replace with 5 ml 1xPBS, proceed to step 3.2. Note: it is critical not to add glutaraldehyde until after fluorescence microscopy is complete.
- Place the live-cell dish with photoetched gridded coverslip in a fluorescent microscope (confocal is not required for this step) and collect 5-10 bright field and fluorescent images of the appropriate grid to document the arrangement of the cells (Fig. 4A). Identify those cells that have been microinjected using the excitation and emission wavelengths of the inert injection dye (Fig. 4B). It is important to obtain images at different magnifications (e.g. 10x and 65x) in order to facilitate identification of microinjected cells in subsequent steps involving electron microscopy.
- Using a confocal fluorescent microscope, collect a Z-stack of microinjected cells within the grid identified in step 2.5 above. High magnification (100x) is needed in order to correlate fluorescent images with subcellular structures that will be identified in electron microscopy.
- The coverslips are removed from the bottom of the live cell dishes with commercially available coverslip removal fluid and placed cell-side up in a virgin cell culture dish containing 5 ml 1xPBS. The coverslip is then processed for electron microscopy as detailed below.
4. Transmission Electron Microscopy
- Replace 1xPBS buffer with 2 ml 2.5% glutaraldehyde in 0.1 M cacodylate buffer (pH 7.4) and incubate at room temperature for 10 minutes. Longer incubation, while not necessary, will aid in maintenance of subcellular structures. Note: formaldehyde alone is not a sufficient fixative for EM analysis.
- Remove fixative and stain cells with the addition of 2 ml 1% osmium tetroxide in 0.1 M cacodylate buffer for 30 min followed by three washes with cacodylate buffer and finally replace all buffer with ddH2O.
- Following standard EM protocols, dehydrate the sample in a graded (70% to 100%) series of ethanol. Prepare Epon resin and place coverslip cell-side down on top of an Epon resin-filled tube. Allow polymerization for 24 hr at 60°C. By placing the photoetched gridded coverslip cell-side down onto the Epon resin, both the cells of interest as well as the grid pattern is transferred to the Epon resin during polymerization (example shown in Fig. 3B).
- Remove coverslips from Epon resin by quickly immersing into liquid nitrogen and/or boiling water. Inspect the surface of the resin under a binocular dissection scope to locate the grid of interest (note: the grid patter will transfer as a mirror image). Using a sterile razor blade or scalpel, trim the Epon block down such that only the grid of interest is at the apex of the Epon resin block.
- Using an ultramicrotome, acquire serial sections of the trimmed block at the desired thickness (~70 nm thickness for conventional TEM and ~250 nm thickness for tomographic TEM). Contrast the sections with uranyl acetate and lead citrate following standard protocols.
5. Correlative Light and Electron Microscopy
- Relocate the cells of interest in the electron microscope using images obtained in earlier steps. Once microinjected cells of interest have been located, use the high-resolution confocal fluorescent images to identify regions within the cell that were of interest. Image these at high resolution using TEM. Use landmarks such as the cell periphery and the nuclear envelope to determine which fluorescent z-stack image corresponds to the EM slice.
- Using the imaging program of your choice (e.g. Image J, Adobe Photoshop, etc.), reduce the opacity of the fluorescent image to 50% and overlay it onto the TEM image with which it correlates. Align the images by adjusting the scale (remember to constrain proportions) and the rotation of the confocal image to match the TEM image. Fine adjustments to contrast, sharpness, etc. in the fluorescent image may aid in the alignment. Note: we have found that heterochromatin, the nuclear envelope, and the cell periphery represent an excellent landmarks to aid in the orientation of the two images.
6. Critical Considerations
- To greatly aid in locating the injected small molecule, a fluorescent tag such as Rhodamine or Fluorescein can be covalently attached using commercially available kits. Additional information is gained by ectopically expressing a fluorescent subcellular localization marker protein prior to microinjection. Hence, choice of fluorophores and inert microinjection tracking dye is important.
- Choose cells for microinjection that are adhering close to the center of the coverslip and avoid choosing a grid close to the edge. This will present the greatest probability that the cells of interest are transferred to the Epon resin used for electron microscopy.
- Confluency of cells is important, as a fully confluent plate will make identification of microinjected cells in the electron microscope very difficult. Rather, seed cells such that they reach ~50% confluency on the day of a short experiment, or ~25% confluency on the day of a longer (1-2 day) experiment. Use the position and shape of the cells as well as the ‘empty space as landmarks to orient the electron microscopy image.
- Confocal optical slice thickness should be tuned to the needs of the experiment and should therefore be empirically determined 10.
- The fixatives formaldehyde and glutaraldehyde should be of the highest grade available. Formaldehyde will fix the cells, yet preserve the fluorescence properties of both proteins and small fluorescent molecules (such as Rhodamine or FITC). However, it will not preserve the structures to permit high EM resolution. Glutaraldehyde preserves membranes and subcellular structures to a high degree for EM analysis, but will significantly hinder fluorescence. Therefore, the two-step fixation is critical for both fluorescence and EM microscopy. The formaldehyde fixation step can be omitted if performing live-cell measurements, as final fixation can be performed by glutaraldehyde treatment.
7. Representative Results
This procedure affords the ability to deliver a molecule of interest directly into the eukaryotic cellular cytoplasm and monitor its localization and/or effects on cellular and organeller architecture from millimeter to multi-nanometer resolution. A schematic illustration of the experimental setup and procedure is shown in Figure 2. This technique relies on microinjection of cells grown on a laser etched glass gridded coverslip (Fig. 3A), which after confocal microscopy, is able to transfer both the cells of interest as well as the grid pattern to the Epon resin (Fig. 3B).
A typical microinjection CLEM procedure yields fluorescence images and electron micrographs, that when correlated, permit both subcellular localization and ultrastructural analysis. Cells grown on a photoetched glass gridded coverslip are microinjected with a molecule of interest after which bright field images are obtained (Fig. 4A). An inert tracking dye is incorporated to distinguish microinjected cells from non-microinjected cells (Fig. 4B). Confocal z-stacks are obtained using a fluorophore or other identifier attached to the microinjected small molecule of interest (Fig. 4C). The sample is fixed with glutaraldehyde and processed for electron microscopy. Electron micrographs are obtained and overlaid onto the cells to which they correspond (Fig. 4D). Areas harboring fluorescent signals are inspected in greater detail at higher magnification (Fig. 4E).

Figure 1. Timeline of microinjection CLEM procedure. Depending on the experimental setup, microinjection and fluorescence measurements can be performed on the same day. Preparing the sample for electron microscopy is most time consuming due to long incubations steps and will last 2-3 days. TEM analysis and correlating fluorescence signals with electron microscopy images can be performed in one day.
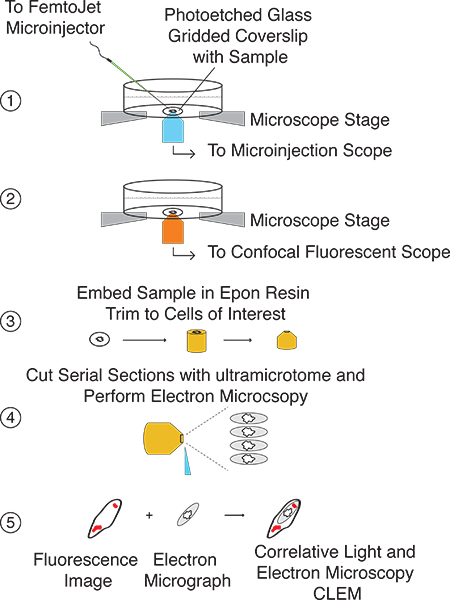
Figure 2. General illustration of the microinjection CLEM procedure. Step 1: Locate cells growing on laser etched glass gridded coverslip and microinject molecule of interest. Step 2: Capture both bright field images and confocal fluorescent z-stacks of microinjected cells. Step 3: Prepare coverslip for EM analysis and embed in Epon resin. Using transferred grid pattern, trim block such that cells of interest are at the apex. Step 4: Cut serial sections with ultramicrotome. Step 5: Correlate fluorescent images with EM images.
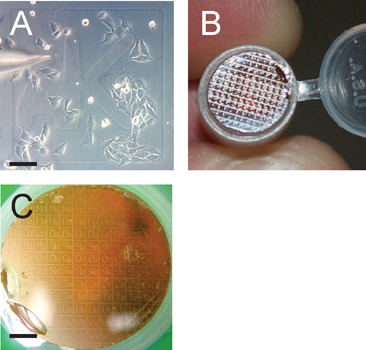
Figure 3. Grid pattern facilitates identification of cells of interest. Panel A depicts the microinjection of cells grown to ~50% confluency; note the grid identifier aK. Scale bar is 100 μm. Panel B shows the transferred grid pattern from the coverslip onto the polymerized Epon resin block that will be sectioned serially after the grid of interest is identified in a dissection microscope. Panel C shows the transferred grid pattern in preparation for sectioning. Note that the transferred grid patter is in reverse on the resin block; scale bar is 1200 μm.
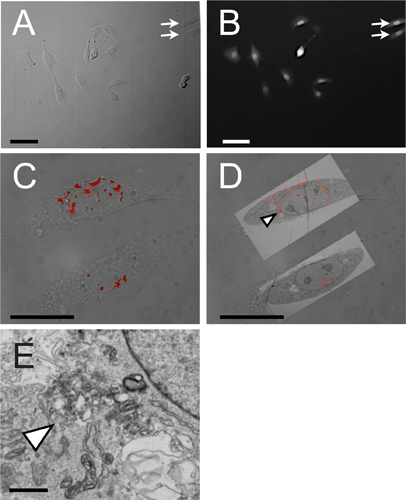
Figure 4. Representative results from microinjection correlative light and electron microscopy. Panel A shows the bright field micrograph of NRK cells growing on a laser etched glass gridded coverslip; arrows indicate two cells that are visualized by CLEM in panels C-D. Panel B shows the fluorescence of the inert tracking dye, in this case Cascade Blue, used to identify cells that were microinjected. Panel C shows the overlay of bright field and the fluorescence signature of a Rhodamine-labeled small molecule. The two cells shown here are indicated by arrows in panels A & B. Panel D represents CLEM of bright field, fluorescent and electron microscopy; arrow head indicates fluorescent puncta imaged at higher magnification in Panel E. Scale bars are as follows: Panels A & B, 100 μm; C & D, 50 μm; E, 100 nm.
Access restricted. Please log in or start a trial to view this content.
Discussion
The method presented here enables the direct delivery of purified proteins, nucleic acids, or small molecules to the eukaryotic cytoplasm and affords ultra high-resolution analysis through the correlation of fluorescent and electron microscopy. The use of this method is simple yet robust and can be performed in-house with many existing core facilities and/or appropriately equipped electron microscopy labs. The technique is also amenable to live-cell, allowing the user to monitor the dynamics of fluorescently tagged molec...
Access restricted. Please log in or start a trial to view this content.
Disclosures
No conflicts of interest are declared.
Acknowledgements
We thank members of the Alto laboratory for helpful discussions. We also thank The Molecular and Cellular Imaging Facility at UT Southwestern Medical Center, specifically Dr. Chris Gilpin, Tom Januszewski, and Laurie Mueller for technical expertise and advice. We also thank Dr. Xionan Dong for critical reading of the manuscript. This work is supported by NIH grant AI083359 to N.M.A.
Access restricted. Please log in or start a trial to view this content.
Materials
| Name | Company | Catalog Number | Comments |
|---|---|---|---|
| Phot–tched Coverslip and Live-cell Plate | MatTek Corp. | P35G-2-14-CGRD | |
| Texas Red | Invitrogen | D3329 | |
| Cascade Blue | Invitrogen | D7132 | |
| Rhodamine Labeling Kit | Thermo Fisher Scientific, Inc. | 53002 | |
| 0.22 μm centrifugal filtration unit | EMD Millipore | UFC30GV00 | |
| Borosilicate Glass Pipettes | Sutter Instrument Co. | BF100-50-10 | |
| Micropipette Puller | Sutter Instrument Co. | Model P-97 | Use program #4 after performing ramp test |
| FemtoJet Microinjection System | Eppendorf | Injectman NI2 | |
| Coverslip Removal Fluid | MatTek Corp. | PDCF OS 30 | |
| Technai Transmission Electron Microscope | FEI | Technai G2 BioTWIN | |
| Ultramicrotombe | Leica Microsystems | EM UC6 |
References
- Schmolze, D. B., Standley, C., Fogarty, K. E., Fischer, A. H. Advances in microscopy techniques. Arch. Pathol. Lab Med. 135, 255-263 (2011).
- Giepmans, B. N. Bridging fluorescence microscopy and electron microscopy. Histochem. Cell Biol. 130, 211-217 (2008).
- Mayhew, T. M., Muhlfeld, C., Vanhecke, D., Ochs, M. A review of recent methods for efficiently quantifying immunogold and other nanoparticles using TEM sections through cells, tissues and organs. Ann. Anat. 191, 153-170 (2009).
- Razi, M., Tooze, S. A. Correlative light and electron microscopy. Methods Enzymol. 452, 261-275 (2009).
- Svitkina, T. M., Borisy, G. G. Correlative light and electron microscopy of the cytoskeleton of cultured cells. Methods Enzymol. 298, 570-592 (1998).
- van Weering, J. R. Intracellular membrane traffic at high resolution. Methods Cell Biol. 96, 619-648 (2010).
- Polishchuk, R. S. Correlative light-electron microscopy reveals the tubular-saccular ultrastructure of carriers operating between Golgi apparatus and plasma membrane. J. Cell Biol. 148, 45-58 (2000).
- Lim, J., Danuser, G. Live Cell Imaging of F-actin Dynamics via Fluorescent Speckle Microscopy (FSM). J. Vis. Exp. (30), e1325(2009).
- Selyunin, A. S. The assembly of a GTPase-kinase signalling complex by a bacterial catalytic scaffold. Nature. 469, 107-111 (2011).
- Semwogerere, D., Weeks, E. R. Confocal Microscopy in Encyclopedia of Biomaterials and Biomedical Engineering. , Taylor and Francis. London. (2005).
Access restricted. Please log in or start a trial to view this content.
Reprints and Permissions
