Described is a two-step labeling process using β-glucosyltransferase (β-GT) to transfer an azide-glucose to 5-hmC, followed by click chemistry to transfer a biotin linker for easy and density-independent enrichment. This efficient and specific labeling method enables enrichment of 5-hmC with extremely low background and high-throughput epigenomic mapping via next-generation sequencing.
A subscription to JoVE is required to view this content. Sign in or start your free trial.
Method Article
Selective Capture of 5-hydroxymethylcytosine from Genomic DNA
In This Article
Summary
Abstract
5-methylcytosine (5-mC) constitutes ~2-8% of the total cytosines in human genomic DNA and impacts a broad range of biological functions, including gene expression, maintenance of genome integrity, parental imprinting, X-chromosome inactivation, regulation of development, aging, and cancer1. Recently, the presence of an oxidized 5-mC, 5-hydroxymethylcytosine (5-hmC), was discovered in mammalian cells, in particular in embryonic stem (ES) cells and neuronal cells2-4. 5-hmC is generated by oxidation of 5-mC catalyzed by TET family iron (II)/α-ketoglutarate-dependent dioxygenases2, 3. 5-hmC is proposed to be involved in the maintenance of embryonic stem (mES) cell, normal hematopoiesis and malignancies, and zygote development2, 5-10. To better understand the function of 5-hmC, a reliable and straightforward sequencing system is essential. Traditional bisulfite sequencing cannot distinguish 5-hmC from 5-mC11. To unravel the biology of 5-hmC, we have developed a highly efficient and selective chemical approach to label and capture 5-hmC, taking advantage of a bacteriophage enzyme that adds a glucose moiety to 5-hmC specifically12.
Here we describe a straightforward two-step procedure for selective chemical labeling of 5-hmC. In the first labeling step, 5-hmC in genomic DNA is labeled with a 6-azide-glucose catalyzed by β-GT, a glucosyltransferase from T4 bacteriophage, in a way that transfers the 6-azide-glucose to 5-hmC from the modified cofactor, UDP-6-N3-Glc (6-N3UDPG). In the second step, biotinylation, a disulfide biotin linker is attached to the azide group by click chemistry. Both steps are highly specific and efficient, leading to complete labeling regardless of the abundance of 5-hmC in genomic regions and giving extremely low background. Following biotinylation of 5-hmC, the 5-hmC-containing DNA fragments are then selectively captured using streptavidin beads in a density-independent manner. The resulting 5-hmC-enriched DNA fragments could be used for downstream analyses, including next-generation sequencing.
Our selective labeling and capture protocol confers high sensitivity, applicable to any source of genomic DNA with variable/diverse 5-hmC abundances. Although the main purpose of this protocol is its downstream application (i.e., next-generation sequencing to map out the 5-hmC distribution in genome), it is compatible with single-molecule, real-time SMRT (DNA) sequencing, which is capable of delivering single-base resolution sequencing of 5-hmC.
Protocol
1. Genomic DNA Fragmentation
Fragment genomic DNA using sonication to a desired size range suited for the genome-wide sequencing platform. (We usually sonicate to ~300 bp.) Verify the size distribution of the fragmented genomic DNA on 1% agarose gel (Figure 1).
2. DNA Preparation
Determine the starting DNA amounts based on the abundance of 5-hmC in genomic DNA. Since 5-hmC levels vary significantly in different tissue types, starting DNA amounts depend on the 5-hmC levels of the samples. Please refer to Table 1 for examples.
3. β-GT Catalyzed Reaction (Glucose Transfer Reaction)
- Mix by pipetting the mixture as detailed in Table 2 and incubate in a 37 °C water bath for 1 hr.
- After incubation, clean up the reaction with QIAquick Nucleotide Removal Kit, using 10 μg of DNA per column. Elute with 30 μl water per column and combine.
4. Biotinylation Reaction (Click Chemistry)
- Add DBCO-S-S-PEG3-Biotin conjugate working solution (1 mM) in the eluted DNA solution (from step 3) to a final concentration of 150 μM (i.e., 5 μl of working solution per 30 μl DNA solution).
- Mix by pipetting and incubate in a 37 °C water bath for 2 hr.
- Clean up the reaction with QIAquick Nucleotide Removal Kit. The ideal total elution volume is 100 μl.
- Quantify the recovered DNA amount using microliter scale spectrophotometer (e.g., NanoDrop).
5. Capture of 5-hmC-containing DNA
- Wash 50 μl of Dynabeads MyOne Streptavidin C1 3 times with 1 ml of 1X B&W buffer according to the manufacturer's instructions. Separate the beads with a magnetic stand.
- Add equal volume of 2X B&W buffer to the recovered biotinylated DNA (100 ul) to the washed beads.
- Incubate for 15 min at room temperature with gentle rotation on a rotator.
- Separate the beads with a magnetic stand and wash the beads 3 times with 1 ml of 1X B&W buffer.
- Elute the DNA by incubating the beads in 100 μl of freshly prepared 50 mM DTT for 2 hr at room temperature with gentle rotation on a rotator.
- Separate the beads with a magnetic stand. Aspirate the eluent and load onto a Micro Bio-Spin 6 Column according to the manufacture instruction to remove the DTT. The target DNA is in the solution now.
- Purify the eluted DNA from the previous step by Qiagen MinElute PCR Purification Kit and elute DNA in 10 μl of EB buffer. Quantify DNA using Qubit Fluorometer, or NanoDrop if concentration is higher than 20 ng/ul. The DNA is ready for downstream genome-wide sequencing library preparation.
6. Representative Results
If the quality of genomic DNA is high, typical recovery yields after the β-GT and biotinylation reactions are ~60-70%. However, the capture efficiency vary significantly with different tissue types depending on the 5-hmC levels of the samples. Typically, the capture efficiency for brain genomic DNA is ~4-9%, and in some extreme cases, the efficiency may reach up to 12%. For ES cells, the average capture efficiency is ~2-4%, in contrast to ~0.5% for neural stem cells. The lowest efficiency seen so far was for genomic DNA from cancer cells. All enriched DNA is ready for standard next-generation library preparation protocols. In addition, the captured DNA can also be used as template for real-time PCR to detect the enrichment of some fragments compared to the input DNA, if the related primers are available.
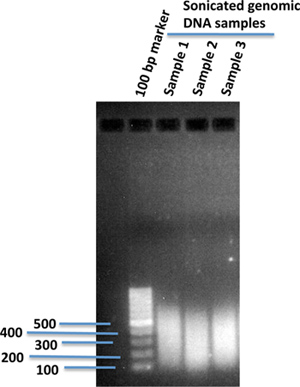
Figure 1. Sonicated human genomic DNA fragments in 1% agarose gel. 10 μg of genomic DNA isolated from human iPS cells in 120 μl of 1X TE buffer was sonicated using a sonication device (Covaris). After sonication, 2 μl of the sonicated DNA was loaded onto 1% agarose gel using 100 bp of DNA marker to compare the sizes of the sonicated DNA fragments.
| Component | Volume | Final Concentration |
| Water | _ μl | |
| 10 X β-GT Reaction Buffer | 2 μl | 1 X |
| Up to 10 μg genomic DNA | _ μl | Up to 500 ng/μl |
| UDP-6-N3-Glc (3 mM) | 0.67 μl | 100 μM |
| β-GT (40 μM) | 1 μl | 2 μM |
| Total volume | 20 μl |
i) For tissue genomic DNA (high 5-hmC content > 0.1%)
| Component | Volume | Final Concentration |
| Water | _ μl | |
| 10 X β-GT Reaction Buffer | 10 μl | 1 X |
| Up to 20 μg genomic DNA | _ μl | Up to 500 ng/μl |
| UDP-6-N3-Glc (3 mM) | 1.33 μl | 100 μM |
| β-GT (40 μM) | 2 μl | 2 μM |
| Total volume | 40 μl |
ii) For stem cell genomic DNA (median 5-hmC content ~0.05%)
| Component | Volume | Final Concentration |
| Water | _ μl | |
| 10 X β-GT Reaction Buffer | 10 μl | 1 X |
| Up to 50 μg genomic DNA | _ μl | Up to 500 ng/μl |
| UDP-6-N3-Glc (3 mM) | 3.33 μl | 100 μM |
| β-GT (40 μM) | 5 μl | 2 μM |
| Total volume | 100 μl |
iii) For cancer cell genomic DNA (low 5-hmC content ~0.01%)
Table 1. Examples of amounts of input DNA and labeling reactions using the samples with various 5-hmC levels by the selective chemical labeling method.
| Sample | 5-hmC level | Starting DNA (μg) | Recovery after labeling (input to beads) (μg) | Recovery yield | Pull-down DNA (ng) | Pull-down yield |
| Adult mouse cerebellum | 0.4% | 10 | 7.5 | 75% | 236 | 3.1% |
| Postnatal day 7 mouse cerebellum | 0.1% | 11 | 9 | 82% | 140 | 1.6% |
| Mouse ES cell E14 | 0.05% | 60 | 42 | 70% | 350 | 0.8% |
Table 2. Representative results from mouse brain tissues and ES cells.
Access restricted. Please log in or start a trial to view this content.
Discussion
5-hydroxymethylcytosine (5-hmC) is a recently identified epigenetic modification present in substantial amounts in certain mammalian cell types. The method presented here is for determining the genome-wide distribution of 5-hmC. We use T4 bacteriophage β-glucosyltransferase to transfer an engineered glucose moiety containing an azide group onto the hydroxyl group of 5-hmC. The azide group can be chemically modified with biotin for detection, affinity enrichment, and sequencing of 5-hmC-containing DNA fragments in ma...
Access restricted. Please log in or start a trial to view this content.
Disclosures
No conflicts of interest declared.
Acknowledgements
This study was supported in part by the National Institutes of Health (GM071440 to C.H. and NS051630/MH076090/MH078972 to PJ).
Access restricted. Please log in or start a trial to view this content.
Materials
| Name | Company | Catalog Number | Comments |
|---|---|---|---|
| Reagents | |||
| 5M Sodium chloride (NaCl) | Promega | V4221 | |
| 0.5M pH8.0 Ethylenediaminetetraacetic acid (EDTA) | Promega | V4231 | |
| 1M Trizma base (Tris) pH7.5 | Invitrogen | 15567-027) | |
| HEPES 1M, pH7.4 | Invitrogen | 15630 | |
| Magnesium chloride (MgCl2) 1M | Ambion | AM9530G | |
| Dimethyl sulfoxide (DMSO) | Sigma | D8418 | |
| Tween 20 | Fisher BioReagents | BP337-100 | |
| DBCO-S-S-PEG3-Biotin conjugate | Click Chemistry Tools | A112P3 | |
| 1,4-Dithiothreitol, ultrapure (DTT) Superpure | Invitrogen | 15508-013 | |
| QIAquick Nucleotide Removal Kit | Qiagen | 28304 | |
| Micro Bio-Spin 6 Column | Bio-Rad | 732-6222 | |
| Dynabeads MyOne | Invitrogen | 650-01 | |
| Streptavidin C1 | |||
| Qiagen MinElute PCR Purification Kit | Qiagen | 28004 | |
| UltraPure Agarose | Invitrogen | 16500500 | |
| UDP-6-N3-glucose | Active Motif | 55013 | |
| Enzyme | |||
| β-glucosyltransferase (β-GT) | New England Biolab | M0357 | |
| Equipment | |||
| Sonication device | Covaris | ||
| Desktop centrifuge | |||
| Water bath | Fisher Scientific | ||
| Gel running apparatus | Bio-Rad | ||
| NanoDrop1000 | Thermo Scientific | ||
| Labquake Tube Shaker | Barnstead | ||
| Labquake Tube Shaker | Thermolyne | ||
| Magnetic Separation Stand | Promega | Z5342 | |
| Qubit 2.0 Fluorometer | Invitrogen | ||
| Reagent setup 10 X β-GT Reaction Buffer (500 mM HEPES pH 7.9, 250 mM MgCl2) 2 X Binding and washing (B&W) buffer (10 mM Tris pH 7.5, 1 mM EDTA, 2 M NaCl, 0.02% Tween 20). |
References
- Jaenisch, R., Bird, A. Epigenetic regulation of gene expression: how the genome integrates intrinsic and environmental signals. Nat. Genet. , Suppl 33. 245-254 (2003).
- Ito, S. Role of Tet proteins in 5mC to 5hmC conversion, ES-cell self-renewal and inner cell mass specification. Nature. 466, 1129-1133 (2010).
- Tahiliani, M. Conversion of 5-methylcytosine to 5-hydroxymethylcytosine in mammalian DNA by MLL partner TET1. Science. 324, 930-935 (2009).
- Kriaucionis, S., Heintz, N. The nuclear DNA base 5-hydroxymethylcytosine is present in Purkinje neurons and the brain. Science. 324, 929-930 (2009).
- Ko, M. Impaired hydroxylation of 5-methylcytosine in myeloid cancers with mutant TET2. Nature. 468, 839-843 (2010).
- Koh, K. P. Tet1 and tet2 regulate 5-hydroxymethylcytosine production and cell lineage specification in mouse embryonic stem cells. Cell Stem Cell. 8, 200-213 (2011).
- Iqbal, K., Jin, S. G., Pfeifer, G. P., Szabo, P. E. Reprogramming of the paternal genome upon fertilization involves genome-wide oxidation of 5-methylcytosine. Proceedings of the National Academy of Sciences of the United States of America. 108, 3642-3647 (2011).
- Wossidlo, M. 5-Hydroxymethylcytosine in the mammalian zygote is linked with epigenetic reprogramming. Nat. Commun. 2, 241(2011).
- Gu, T. P. The role of Tet3 DNA dioxygenase in epigenetic reprogramming by oocytes. Nature. 477, 606-610 (2011).
- Dawlaty, M. M. Tet1 is dispensable for maintaining pluripotency and its loss is compatible with embryonic and postnatal development. Cell Stem Cell. 9, 166-175 (2011).
- Huang, Y. The behaviour of 5-hydroxymethylcytosine in bisulfite sequencing. PLoS One. 5, e8888(2010).
- Song, C. X. Selective chemical labeling reveals the genome-wide distribution of 5-hydroxymethylcytosine. Nat. Biotechnol. 29, 68-72 (2011).
- Pastor, W. A. Genome-wide mapping of 5-hydroxymethylcytosine in embryonic stem cells. Nature. 473, 394-397 (2011).
- Matarese, F., Pau, C. arrillo-deS. anta, E,, Stunnenberg, H. G. 5-Hydroxymethylcytosine: a new kid on the epigenetic block. Mol. Syst. Biol. 7, 562(2011).
- Szwagierczak, A., Bultmann, S., Schmidt, C. S., Spada, F., Leonhardt, H. Sensitive enzymatic quantification of 5-hydroxymethylcytosine in genomic DNA. Nucleic Acids Res. 38, 181(2010).
- Terragni, J., Bitinaite, J., Zheng, Y., Pradhan, S. Biochemical characterization of recombinant β-glucosyltransferase and analysis of global 5-hydroxymethylcytosine in unique genomes. Biochemistry. , (2012).
- Rusmintratip, V., Sowers, L. C. An unexpectedly high excision capacity for mispaired 5-hydroxymethyluracil in human cell extracts. Proc. Natl. Acad. Sci. U.S.A. 97, 14183-14187 (2000).
- Globisch, D. Tissue distribution of 5-hydroxymethylcytosine and search for active demethylation intermediates. PLoS One. 5, e15367(2010).
- Yildirim, O. Mbd3/NURD Complex Regulates Expression of 5-Hydroxymethylcytosine Marked Genes in Embryonic Stem Cells. Cell. 147, 1498-1510 (2011).
- Szulwach, K. E. Integrating 5-hydroxymethylcytosine into the epigenomic landscape of human embryonic stem cells. PLoS Genet. 7, e1002154(2011).
- Szulwach, K. E. 5-hmC-mediated epigenetic dynamics during postnatal neurodevelopment and aging. Nat. Neurosci. 14, 1607-1616 (2011).
Access restricted. Please log in or start a trial to view this content.
Reprints and Permissions
