The transfer of bm12 lymphocytes into a C57BL/6 recipient is an established model of systemic lupus erythematosus. Here we describe how to initiate disease using this model and how to characterize T follicular helper cells, germinal center B cells and plasma cells by flow cytometry.
A subscription to JoVE is required to view this content. Sign in or start your free trial.
Method Article
The bm12 Inducible Model of Systemic Lupus Erythematosus (SLE) in C57BL/6 Mice
In This Article
Summary
Abstract
Systemic lupus erythematosus (SLE) is an autoimmune disease with diverse clinical and immunological manifestations. Several spontaneous and inducible animal models mirror common components of human disease, including the bm12 transfer model. Upon transfer of bm12 splenocytes or purified CD4 T cells, C57BL/6 mice rapidly develop large frequencies of T follicular helper cells (Tfh), germinal center (GC) B cells, and plasma cells followed by high levels of circulating anti-nuclear antibodies. Since this model utilizes mice on a pure C57BL/6 background, researchers can quickly and easily study disease progression in transgenic or knockout mouse strains in a relatively short period of time. Here we describe protocols for the induction of the model and the quantitation Tfh, GC B cells, and plasma cells by multi-color flow cytometry. Importantly, these protocols can also be used to characterize disease in most mouse models of SLE and identify Tfh, GC B cells, and plasma cells in other disease models.
Introduction
Systemic lupus erythematosus (SLE) is a complex autoimmune disease characterized prototypically by anti-nuclear antibody (ANA) production and glomerulonephritis. Numerous other sequelae, including dermal, cardio-pulmonary, and hepatic lesions are associated with disease in some individuals. Prevalence estimates in the US vary widely, from 150,000-1,500,0001,2, with particularly high incidence in women and minorities3. Although the etiology of SLE has been difficult to discern, it is thought to arise from the interplay of various genetic and environmental factors, which culminate in systemic autoimmunity.
Numerous animal models have been employed to study factors leading to disease onset and progression. Classic mouse models of SLE include genetically predisposed mouse strains including the NZB x NZW F1 model and its NZM derivatives, the MLR/lpr strain, and the BXSB/Yaa strain, and inducible systems, such as the pristane and chronic graft-versus-host disease (cGVHD) models4. Early reports of autoantibody production in GVHD models used various mouse strains or hamster strains for parent into F1 transfers5–8; more common methods used to study lupus-like disease currently include the DBA/2 parent→(C57BL/6 x DBA/2) F1, and the bm12 transfer model described here. Each model has its own caveats, but they generally share a common set of features that correlate with clinical features of human disease. The most often reported parameters in mouse models include splenomegaly, lymphadenopathy, nephritis, ANA production, and at the cellular level, the expansion of T follicular helper cells (Tfh), germinal center (GC) B cells, and plasma cells.
The inducible bm12 model is achieved by the adoptive transfer of lymphocytes from I-Abm12B6(C)-H2-Ab1bm12/KhEgJ (bm12) mice, a strain identical to C57BL/6 except for 3 amino acid substitutions on MHC class II, into I-Ab C57BL/6 (B6) mice. Alloactivation of donor CD4 T cells by recipient APCs leads to cGVHD with symptoms closely resembling SLE. Specifically, these include expansion of donor-derived Tfh, expansion of recipient-derived GC B cells and plasma cells, and production of ANAs including anti-dsDNA, anti-ssDNA, anti-chromatin, and anti-RBC antibodies9. Over time, recipient mice develop glomerulonephritis associated with IgG deposits in the glomerular, interstitial, and vascular regions of the kidneys10. We have recently shown that, similar to human disease, there is also a critical role for type I IFN in this model11. Notably, the defining criteria for human SLE include the development of nephritis compatible with SLE in the presence of anti-dsDNA antibodies12, both of which are prominent features of this mouse model.
There are several advantages of the bm12 model over the spontaneous models. Classic models that develop SLE-like signs spontaneously rely upon either hybrid mouse strains, inbred mouse strains not on the B6 background, or large genetic loci on the B6 background, which make crossing to knockout or otherwise genetically modified mice difficult and time consuming. With the bm12 inducible model, genetically modified mice can serve as either the donor or recipient, allowing more rapid identification of the cellular compartment in which particular genes may be important for disease. Furthermore, disease development in the bm12 model is much faster, requiring only 2 weeks until the appearance of ANAs, compared to several months for most spontaneous models. Moreover, in contrast to the spontaneous models that develop disease at different time points, the disease onset and progression in the bm12→B6 model is highly synchronized. This allows for the generation of appropriately sized cohorts that can be used for interventional or therapeutic strategies at any stage of disease development.
What follows is a detailed protocol for initiating SLE-like autoimmunity by the adoptive transfer of bm12 lymphocytes into C57BL/6 mice, or genetic variants on the B6 background. Additionally, we describe a flow cytometric staining protocol for enumerating Tfh, GC B cells, and plasma cells—cell types associated with human disease. Importantly, these protocols can also be used to characterize disease in most mouse models of SLE and identify Tfh, GC B cells and plasma cells in other disease models.
Access restricted. Please log in or start a trial to view this content.
Protocol
Animal work was performed under specific pathogen-free conditions in accordance with guidelines set by the Association for Assessment and Accreditation of Laboratory Animal Care International and our Institutional Animal Care and Use Committee (IACUC).
NOTE: Incorporate mice expressing a congenic marker such as CD45.1 on either donor or recipient animals if possible, because this allows for the monitoring of donor graft efficiency and specific expansion of the donor CD4 T cell population. If considering the use of otherwise genetically modified mice as donor or recipients, ensure the strain is properly backcrossed to the B6 background, or transferred cells may be rejected—this will be addressed in greater detail in the representative results and discussion sections.
NOTE: The following procedures detail volumes for harvesting 4 donor bm12 mice, which should yield enough cells to inject 12-16 mice. Six to twelve week-old bm12 mice yield roughly 100-140 million lymphocytes with approximately 25% CD4 T cells. If starting with different numbers of mice, or different mouse strains, scale volumes up or down accordingly. C57BL/6 mice generally give similar yields with closer to only 20% CD4 T cells.
NOTE: Perform all steps at RT and use RT media to avoid heat and cold shock, which can impair long-term lymphocyte viability. Perform tissue-harvesting and tissue-processing steps in a tissue culture hood using aseptic technique. All media in this protocol is IMDM with 10% heat-inactivated FBS, unless indicated otherwise, and will be simply referred to as “complete media.”
1. Novel Method for Genotyping bm12 Mice
NOTE: A brief restriction digest-based protocol for genotyping is provided here, as a simple and inexpensive alternative to sequencing, which is currently the only published genotyping method for these mice.
- Isolate genomic DNA from mouse tails. Please refer to a previous JoVE article for detailed protocols on mouse tail clipping and the generation of cDNA from tail digests13.
- Perform a reverse-transcriptase polymerized chain reaction (PCR)14 to amplify a common 474 bp DNA fragment from MHC-II I-Ab and I-Abm12 using primers and thermocycling conditions listed in Table 1.
- Perform restriction digest on ~7 µl of the PCR product using the enzyme PsuI, or one of its isoschizomers (BstX2I, BstYI, MflI, or XhoII), which cuts wild type I-Ab, but not I-Abm12 mutant. Follow digest protocol provided by the manufacturer, which will specify a mixture of water, buffer and enzyme, and an incubation of 5 min. to several hours at 37 °C15.
- Load digest product and run on 1% polyacrylamide gel with ethidium bromide14 for 30-45 min. at 150V—though optimal voltage and time settings will vary depending on the PCR gel apparatus used. Visualize DNA bands with a UV illuminator. Representative results are shown in Figure 1.
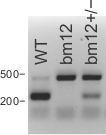
Figure 1. Representative bm12 genotyping results.
To identify mice homozygous for I-Abm12/bm12, tail DNA was screened for bm12 by PCR/restriction digest genotyping (Step 1). Homozygous wild type (I-Ab/b) DNA yields two bands at 227 and 247 bp (visualized as one thick band at ~250 bp); homozygous bm12 (I-Abm12/bm12) DNA yields one band at 474 bp; and heterozygous (I-Abm12/b) DNA yields two bands at ~250 and 474 bp. Please click here to view a larger version of this figure.
2. Harvesting Donor Cells
- Sacrifice donor mice using Institutional Animal Care and Use Committee (IACUC)-approved primary and secondary euthanasia methods. For example, euthanize mice by asphyxiation with CO2 followed by cervical dislocation.
- Using aseptic technique, harvest spleens and lymph nodes (superficial cervical, mandibular, brachial, axillary, mesenteric, and inguinal) into 15 ml tubes containing 10 ml complete media as in11-13.
NOTE: Refer to previous reports for detailed lymph node dissection protocols16–18. This model is also successful using only mouse splenocytes for transfer, but the addition of lymph nodes significantly reduces the required number of donor mice. - Generate a single-cell suspension by mashing lymphoid tissues collected in step 2.2 through 70 µm cell strainers using the plunger from a syringe. For better yields, do not overload strainers—use ~6 strainers for every 4 mice processed, and rinse strainers frequently while processing. Combine tissues from 4 mice into two 50 ml conical tubes, then centrifuge cells for 5 min at 400 x g and decant supernatant.
- Resuspend cells from both conical tubes in 50 ml complete media and transfer to new conical tube. Keep this tube at RT.
NOTE: Fat adheres to the sides of the tube, and if the tube is not replaced, final cellular yields can suffer.
3. Donor Cell Counting
NOTE: To preserve the highest viability, red blood cell (RBC) lysis of the entire sample is not recommended.
- Mix single cell suspension from step 2.4 well, remove 1 ml and transfer it to a separate 50 ml conical. Set aside remaining, untouched cells (49 ml) at RT while counting.
- Add 3 ml of an ammonium chloride-based red blood cell lysis buffer to the 1 ml donor cell sample. Mix gently for 1 min. by rocking, then fill to 50 ml with complete media, and centrifuge for 5 min. at 400 x g and decant supernatant.
- Resuspend RBC-lysed cells in 10 ml complete media and count (e.g., with trypan blue using a hemocytometer). Multiply result by 49—this is the total number of cells remaining in the non-lysed sample that was set aside. Discard RBC-lysed cells.
4. Donor Cell Labeling and/or CD4 T Cell Purification
- If desired, purify CD4 T cells at this stage, though this is not necessary. Additionally, if desired, label cells with CFSE, as in19, or other cell tracking dyes, an example of which is shown in Figure 4 of the representative results section.
NOTE: For CD4 T cell purification, negative magnetic selection is recommended, as it can achieve high purity and leaves cells untouched with high viability as described in20. It is important that endotoxin-free buffers are used; therefore, instead of BSA, make separation buffer with 2% FBS and the recommended concentration of EDTA.
5. Injection of Donor bm12 Cells
- After counting donor lymphocytes in step 3 (and purified or labeled as in step 4, as desired), centrifuge cells for 5 min at 400 x g. Decant supernatant and resuspend cells in PBS at 120 million lymphocytes per ml (or 30 million purified CD4 T cells per ml). Transfer cells to a sterile 5 ml round-bottom tube, or other sterile tube that easily accommodates a 1 ml syringe fitted with a 27.5 G x 13 mm needle.
- Prior to injection, set aside a small sample of donor cells from step 5.1 at 4 °C for flow staining to determine the percentage of CD4 T cells within donor samples. Stain these samples as described in Step 8 using the minimal antibody panel (Table 2).
NOTE: If cells from different mouse strains are used as separate donors, this is an important consideration, and if CD4 T cell percentages vary substantially, purification may be required. - Mix cells gently, but thoroughly. This can be done by pipetting cells up and down using a 1 ml syringe without an attached needle. After mixing, draw cells into the 1 ml syringe. Attach needle after removing any air bubbles. Keeping the needle off while priming the syringe helps maintain cell viability.
- Inject 250 µl per mouse (which is equal to 30 million lymphocytes, or 7.5 million purified CD4 T cells per mouse) intraperitoneally, as described in21.
NOTE: In experiments shown here and in our prior work11, each mouse is injected with 30 million total lymphocytes from bm12 donors, rather than the 100 million total splenocytes traditionally used. In unpublished data from our lab, no difference was observed in serum anti-dsDNA at day 14 following injections of 30 or 100 million lymphocytes per mouse. While this significantly reduces the number of mice needed for experiments, the development of nephritis with this number of cells has not been assessed.
6. Determine Grafting Efficiency
NOTE 1: This section will describe how to determine the degree of donor cell grafting in the recipient at day 3 in order to identify any mice which may have received suboptimal injections (e.g., the graft in one mouse is <10% of that seen in all other mice from the same group). These data can also help determine whether cells from a genetically modified mouse strain are rejected at later time points (for details, see representative results section, Figure 6).
NOTE 2: This section is only possible if donors and recipients are from mice on different congenic backgrounds, e.g., when using CD45.1 bm12 donors and CD45.2 C57BL/6 recipients, or when donor cells are labeled with a cell tracking dye. Importantly, at 3 days post-injection, CD4 T cells have undergone minimal expansion (see representative results section, Figure 4), so differences observed in the degree of grafting are due to variability in injections, not expansion.
- Anesthetize mice with 4% isoflurane or other IACUC-approved method. Test rear foot reflexes to ensure mouse is properly anesthetized before proceeding to the blood draw.
- Harvest 100-200 µl blood using an IACUC-approved method, such as retro-orbital puncture as in22. Collect blood into individual 0.5 ml microcentrifuge tubes containing an anti-coagulant, such as the plasma collection tubes referenced in the materials table, which contain lyophilized dipotassium EDTA. After blood collection, apply gentle pressure to the mouse eye using a sterile towel or gauze to ensure the bleeding stops, then place the mouse back in its home cage where it will remain until the final tissue harvest (Step 7).
NOTE: Do not leave mice unattended until mice have regained sufficient consciousness to maintain ventral recumbency, and do not return mice to the company of others until fully recovered. - Bring blood volume to 500 µl with 21 °C PBS and transfer to conical-bottom microcentrifuge tube, then slowly underlay 200 µl of 21 °C high density cell separation solution with a 200 µl pipet, being careful to minimize mixing between the two phases (see Materials Table for recommended solutions). Centrifuge cells at 700 x g for 20 min at 20-25 °C with centrifuge brake set to low.
- Remove top layer containing lymphocytes with a 1 ml pipet and transfer to a new microcentrifuge tube containing 800 µl cold complete media. Gently vortex to mix cells. Centrifuge cells at 700 x g for 5 min at 4 °C and decant supernatant.
- Resuspend cells in 200 µl complete media, transfer to a 96-well U-bottom plate, and stain for flow cytometry as described in Step 8 using a minimal antibody panel (Table 2) to determine the relative abundance of the CD4 T cell graft as a percentage of PBMCs.
7. Final Tissue Harvest
NOTE: The experiments described in the results section were harvested 14 days after injection of donor cells (or in some cases less time), as they focus on the initial development of Tfh cells and plasma cells; however, since this model is a chronic GVHD model of SLE, disease can be monitored at much later time points. The optimal timeframe will depend upon the research question posed in each individual experiment.
- At a predetermined time point after injection of bm12 donor cells (step 5.4), sacrifice mice using an IACUC-approved method of euthanasia. Asphyxiation with CO2 followed by exsanguination is recommended. Cervical dislocation can function as a secondary method of euthanasia, but this may reduce the blood draw yield.
- Wet the abdomen of the mouse lightly with a spray bottle containing 70% ethanol. Make a small, superficial incision with surgical scissors approximately 1 cm above the genitalia. Draw back the skin of the abdomen toward the sternum, being careful to keep the peritoneal fascia intact.
NOTE: Diseased mice usually present with 0.5-3 ml ascites at day 14, which, although it has not yet been well characterized, can be measured and analyzed as an additional disease parameter. - Fit a 5 ml syringe with an 18 G needle. Insert the needle into the lower right quadrant of the abdomen with the needle directed up toward the animal’s head and at 15° angle to the plane of the fascia. Position the needle tip near the cecum to help prevent the needle from getting clogged with intestine while aspirating ascites.
- Carefully rotate the mouse on its side, then slowly draw ascites into the syringe. Once ascites has been recovered, remove the syringe and record the aspirate volume, based upon the volumetric markings on the side of the syringe.
- Discharge ascites into a 5 ml round-bottom tube and store on ice for later processing.
- Harvest blood via draw from the inferior vena cava (IVC) essentially as in22. Using dull forceps, gently move intestines to the left side of the mouse, uncovering the IVC. Insert a 27.5 G needle fitted to a 1 ml syringe into the IVC and slowly draw 400-500 µl of blood.
- To minimize hemolysis, slowly inject blood into a 0.5 ml microcentrifuge serum or plasma collection tube. For later serum analysis of ANAs by ELISA, keep blood on ice.
- Dissect and obtain additional relevant tissues (spleen and, if desired, lymph nodes and kidneys, particularly if collecting at later time points and glomerulonephritis will be scored). Remove spleen by gently placing the intestines back toward the right side of the animal, and pulling on the pancreas, which is the spleen’s primary connective tissue.
- Remove any pancreas remaining, then weigh spleens on a high precision balance immediately after dissection, as gross splenomegaly is a commonly reported parameter in mouse models of SLE. Place lymphoid tissues into individual 1.5 ml tubes filled with 1ml complete media on ice. Fix kidneys in 10% neutral buffered formalin or snap freeze kidneys for later histology as in23.
- Centrifuge blood within 2 hr of collection for 3 min. at 10,000 x g (4 °C). Remove serum and store at -80 °C for later analysis of ANA by ELISA. Refer to previous reports for detailed ANA ELISA protocols24,25. Store serum in multiple 10-20 µl aliquots to minimize freeze/thaw cycles, and allow a greater number of future assays.
- Centrifuge ascites 400 x g for 5 min. Remove the supernatant with a 1 ml pipet and aliquot into several 0.5 ml tubes. Freeze supernatant at -80 °C for later analyses of anti-nuclear antibodies (ANAs) or other soluble inflammatory mediators.
- Resuspend cellular fraction in approximately 1 ml complete media and transfer 200 µl to a 96-well U-bottom plate for flow staining (as in Step 8).
- Mash each spleen through 70 µm cell strainers into separate tubes and rinse with complete media. Resuspend splenocytes with 1 ml cold RBC lysis buffer for 1 min. and mix gently by rocking. Bring volume to 10 ml with cold complete media and centrifuge for 5 min at 400 x g and decant supernatant.
- Resuspend cell pellet in 5 ml complete media and count using a hemocytometer. Adjust volume such that 200 µl of complete media contains 1-3 million cells. Begin staining for flow cytometry (Step 8) using an extended panel (Table 2) to quantify donor CD4 T cell and recipient B cell differentiation and expansion.
NOTE: Depending upon what laser, photomultiplier tube (PMT), and filter set combinations are available, separating the T and B cell analysis panel into multiple panels may be necessary.
8. Flow Staining
- Transfer 1-3 million splenocytes in 200 µl complete media into individual 5 ml round-bottom tubes, or into separate wells of a 96-well U-bottom plate.
NOTE: Using a 96-well plate is an efficient way to stain multiple samples, but take care to plate samples in every other well in order to prevent cross-contamination. One 96-well plate can accordingly hold 24 samples. - Centrifuge plate at 500 x g for 3 min., then flick supernatant from plate into appropriate (biohazard) container.
- Resuspend the cell pellets with 100 µl of flow buffer (1% FBS in PBS) containing a fixable viability dye at the manufacturer’s recommended concentration and purified anti-CD16/anti-CD32 antibody cocktail at 1 µg/ml. Incubate for 10 min at 20-25 °C, then add 100 µl cold complete media to quench viability dye.
NOTE: Splenocytes from diseased mice usually contain relatively high numbers of dead or dying cells; therefore, the inclusion of a viability dye is recommended to avoid non-specific antibody labeling of dying cells, resulting in cleaner, more reliable data. Similarly, the anti-CD16/anti-CD32 cocktail is included to block non-specific fluorescently-labeled antibody binding by Fc receptors. - Centrifuge plate at 500 x g for 3 min., then flick supernatant from plate into biohazard container. Resuspend cells in 200 µl flow buffer. Centrifuge plate at 500 x g for 3 min., then flick supernatant from plate into biohazard container.
- Resuspend cells in 50 µl flow buffer containing antibody cocktail (Table 2). Incubate for 20 min at 4 °C, then add 150 µl flow buffer. Repeat wash step 8.4.
- Resuspend cells with 100 µl 2% paraformaldehyde in PBS. Incubate for 30 min at 4 °C, then add 100 µl flow buffer. Centrifuge plate at 500 x g for 3 min., then flick supernatant from plate into biohazard container.
- Resuspend in 200 µl flow buffer, transfer to flow tube inserts or standard flow tubes, add an additional 100-200 µl flow buffer, and store at 4 °C in the dark until acquiring on flow cytometer.
- Acquire on a flow cytometer equipped with the appropriate lasers and PMTs for the chosen antibody panels within several days of staining. Record forward scatter width and/or height in addition to forward scatter area, side scatter area, and area of the fluorescent parameters utilized. For reliable results, acquire ≥1,000 donor cells in each WT sample, or an equivalent number of total lymphocytes in genetically modified or otherwise manipulated mice that show minimal expansion of donor cells, where collection of so many events may not be feasible.
NOTE: Flow cytometry analyses are described in detail in the representative results section (Figures 3-6).
Access restricted. Please log in or start a trial to view this content.
Results
Diseased mice develop splenomegaly in as little as 14 days, exhibiting spleens 2-3 times the size of healthy mice in terms of mass and cellularity (Figure 2).
Splenocytes are sequentially gated on light scatter (FSC-A by SSC-A), elimination of doublets (FSC-W or -H by FSC-A), viable cells (low staining of viability dye), and CD4+TCRβ+ (Figure 3A). Donor cells are distinguished from recipient cells based on CD45.1 and CD45.2 (Figur...
Access restricted. Please log in or start a trial to view this content.
Discussion
The bm12 inducible model is a relatively easy and efficient way to study the cellular and molecular processes of SLE. Chronic activation of adoptively transferred CD4 T cells directed against self antigens leads to the accumulation of Tfh, GC B cells, and plasma cells which can be measured by flow cytometry, as described here. Future studies using this model can quickly and easily interrogate the role of candidate genes and novel therapies in the autoimmune germinal center processes which resemble those occurring in pati...
Access restricted. Please log in or start a trial to view this content.
Disclosures
The authors have nothing to disclose.
Acknowledgements
This work was supported in part by the Lupus Research Institute, NCI grant CA138617, NIDDK grant DK090978, Charlotte Schmidlapp Award (to E.M.J.), and the Albert J. Ryan Fellowship (to J.K.). We are grateful for the support and instrumentation provided by the Research Flow Cytometry Core in the Division of Rheumatology at Cincinnati Children’s Hospital Medical Center, supported in part by NIH AR-47363, NIH DK78392 and NIH DK90971.
Access restricted. Please log in or start a trial to view this content.
Materials
| Name | Company | Catalog Number | Comments |
|---|---|---|---|
| B6.SJL-Ptprca Pepcb/BoyJ | The Jackson Laboratory | 001162 | CD45.1+ BoyJ mouse strain |
| B6(C)-H2-Ab1bm12/KhEgJ | The Jackson Laboratory | 001162 | Bm12 mouse strain |
| FastDigest PsuI | Life Technologies | FD1554 | Restriction digest enzyme for genotyping |
| 1X RBC Lysis Buffer | eBioscience | 00-4333-57 | |
| IMDM | GE Healthcare | SH30228.01 | |
| Plasma Separation Tube (PST) | BD | 365974 | Blood collection tube with Dipotassium EDTA |
| Serum Separation Tube (SST) | BD | 365967 | Blood collection tube with Clot activator / SST Gel |
| Ficoll | GE Healthcare | 17-1440-02 | High density cell separation solution |
| Lympholyte-M | Cedarlane | CL5030 | High density cell separation solution |
| GL-7-biotin | eBioscience | 13-5902-82 | |
| Streptavidin-BUV395 | BD | 564176 | |
| CD138-BV421 | BioLegend | 142508 | |
| CD4-BV510 | BioLegend | 100559 | |
| TCRβ-BV605 | BD | 562840 | |
| CD45.1-BV711 | BioLegend | 110739 | |
| CD45.2-FITC | BioLegend | 109806 | |
| PD-1-PE | BioLegend | 135206 | |
| CD19-PerCP | BioLegend | 115532 | |
| Fas-PE-Cy7 | BD | 557653 | |
| CXCR5-APC | BioLegend | 145506 | |
| Fixable Viability Dye ef780 | eBioscience | 65-0865-18 | |
| CD4-BV421 | BioLegend | 100443 | |
| 1.2 ml FACS tube inserts, racked | USA Scientific | 1412-1400 | |
| BD Falcon™ Round-Bottom Tubes | BD | 352017 |
References
- Helmick, C. G., Felson, D. T., et al. Part I. Arthritis Rheum. Estimates of the prevalence of arthritis and other rheumatic conditions in the United States. 58, 15-25 (2008).
- Lupus Foundation of America Web Site. , Available from: http://www.lupus.org/answers/entry/what-is-lupus (2015).
- Somers, E. C., Marder, W., et al. Population-based incidence and prevalence of systemic lupus erythematosus: The Michigan lupus epidemiology and surveillance program. Arthritis and Rheumatol. 66, 369-378 (2014).
- Perry, D., Sang, A., Yin, Y., Zheng, Y. -Y., Morel, L. Murine models of systemic lupus erythematosus. J Biomed Biotechnol. 2011, 271694(2011).
- Lindholm, L., Rydberg, L., Strannegård, O. Development of host plasma cells during graft-versus-host reactions in mice. Eur J Immunol. 3 (8), 511-515 (1973).
- Fialkow, P. J., Gilchrist, C., Allison, A. C. Autoimmunity in chronic graft-versus-host disease. Clin Exp Immunol. 13, 479-486 (1973).
- Streilein, J. W., Stone, M. J., Duncan, W. R. Studies on the Specificity of Autoantibodies Produced in Systemic Graft-vs-Host Disease. J Immunol. 114 (1), 255-260 (1975).
- Gleichmann, E., Gleichmann, H. Diseases caused by reactions of T lymphocytes to in compatible structures of the major histocompatibility complex. I. Autoimmune hemolytic anemia. Eur J Immunol. 6 (12), 899(1976).
- Morris, S., Cohen, P. L., Eisenberg, R. Experimental induction of systemic lupus erythematosus by recognition of foreign Ia. Clin Immunol Immunopathol. 57 (2), 263-273 (1990).
- Chen, F., Maldonado, M., Madaio, M., Eisenberg, R. The Role of Host (Endogenous) T Cells in Chronic Graft-Versus-Host Autoimmune Disease. J Immunol. 161 (11), 5880-5885 (1998).
- Klarquist, J., Hennies, C. M., Lehn, M. A., Reboulet, R. A., Feau, S., Janssen, E. M. STING-Mediated DNA Sensing Promotes Antitumor and Autoimmune Responses to Dying Cells. J Immunol. 193, 6124-6134 (2014).
- Petri, M., Orbai, A. -M., et al. Derivation and validation of systemic lupus international collaborating clinics classification criteria for systemic lupus erythematosus. Arthritis Rheum. 64 (8), 2677-2686 (2012).
- Zangala, T. Isolation of genomic DNA from mouse tails. J Vis Exp. (6), e246(2007).
- Lorenz, T. C. Polymerase Chain Reaction: Basic Protocol Plus Troubleshooting and Optimization Strategies. J Vis Exp. (63), e3998(2012).
- Product information: Thermo Scientific FastDigest PsuI. , Thermo Scientific. Available from: https://tools.lifetechnologies.com/content/sfs/manuals/MAN0012567_FastDigest_PsuI_UG.pdf (2012).
- Matheu, M. P., Parker, I., Cahalan, M. D. Dissection and 2-photon imaging of peripheral lymph nodes in mice. J Vis Exp. (7), e265(2007).
- Harrell, M. I., Iritani, B. M., Ruddell, A. Lymph node mapping in the mouse. J Immunol Methods. 332 (1-2), 170-174 (2008).
- Covelli, V. Chapter 3, Internal examination. Guide to the necroscopy of the mouse. , Available from: http://eulep.pdn.cam.ac.uk/Necropsy_of_the_Mouse/index.php?file=Chapter_3.html (2009).
- Quah, B. J. C., Parish, C. R. The use of carboxyfluorescein diacetate succinimidyl ester (CFSE) to monitor lymphocyte proliferation. J Vis Exp. (44), e2259(2010).
- Matheu, M. P., Cahalan, M. D. Isolation of CD4+ T cells from mouse lymph nodes using Miltenyi MACS purification. J Vis Exp. (9), e53319(2007).
- Machholz, E., Mulder, G., Ruiz, C., Corning, B. F., Pritchett-Corning, K. R. Manual Restraint and Common Compound Administration Routes in Mice and Rats. J Vis Exp. (67), e2771(2012).
- Hoff, J. Methods of Blood Collection in the Mouse. Lab Animal. 29 (10), 47-53 (2000).
- Cohen, M., Varki, N. M., Jankowski, M. D., Gagneux, P. Using Unfixed, Frozen Tissues to Study Natural Mucin Distribution. J Vis Exp. (67), e3928(2012).
- Cohen, P. L., Maldonado, M. A. Animal models for SLE. Curr Protoc Immunol.. Chapter 15, Unit 15.20(2003).
- Seavey, M. M., Lu, L. D., Stump, K. L. Animal models of systemic lupus erythematosus (SLE) and ex vivo assay design for drug discovery. Curr Protoc Pharmacol. Chapter 5, Unit 5(2011).
- McKenna, K. C., Vicetti Miguel, R. D., Beatty, K. M., Bilonick, R. A. A caveat for T cell transfer studies: generation of cytotoxic anti-Thy1.2 antibodies in Thy1.1 congenic mice given Thy1.2+ tumors or T cells. J Leukoc Biol. 89 (2), 291-300 (2011).
- Scott, D. M., Ehrmann, I. E., et al. Identification of a mouse male-specific transplantation antigen H-Y. Nature. 376, 695-698 (1995).
- Joly, E., Hudrisier, D. What is trogocytosis and what is its purpose. Nat Immunol. 4 (9), 815(2003).
- Brown, D. R., Calpe, S., et al. Cutting edge: an NK cell-independent role for Slamf4 in controlling humoral autoimmunity. J Immunol. 187 (1), 21-25 (2011).
- Morris, S. C., Cheek, R. L., Cohen, P. L., Eisenberg, R. A. Allotype-specific immunoregulation of autoantibody production by host B cells in chronic graft-versus host disease. J Immunol. 144 (3), 916-922 (1990).
- Choudhury, A., Cohen, P. L., Eisenberg, R. A. B cells require “nurturing” by CD4 T cells during development in order to respond in chronic graft-versus-host model of systemic lupus erythematosus. Clin Immunol. 136 (1), 105-115 (2010).
- Slifka, M. K., Antia, R., Whitmire, J. K., Ahmed, R. Humoral immunity due to long-lived plasma cells. Immunity. 8 (3), 363-372 (1998).
Access restricted. Please log in or start a trial to view this content.
Reprints and Permissions
