Imaging Mycobacterium tuberculosis in Mice with Reporter Enzyme Fluorescence
Summary
We describe the optical imaging of mice infected with Mycobacterium tuberculosis (M. tuberculosis) using reporter enzyme fluorescence (REF). This protocol facilitates the sensitive and specific detection of M. tuberculosis in pre-clinical animal models for pathogenesis, therapeutics and vaccine research.
Abstract
Reporter enzyme fluorescence (REF) utilizes substrates that are specific for enzymes present in target organisms of interest for imaging or detection by fluorescence or bioluminescence. We utilize BlaC, an enzyme expressed constitutively by all M. tuberculosis strains. REF allows rapid quantification of bacteria in lungs of infected mice. The same group of mice can be imaged at many time points, greatly reducing costs, enumerating bacteria more quickly, allowing novel observations in host-pathogen interactions, and increasing statistical power, since more animals per group are readily maintained. REF is extremely sensitive due to the catalytic nature of the BlaC enzymatic reporter and specific due to the custom flourescence resonance energy transfer (FRET) or fluorogenic substrates used. REF does not require recombinant strains, ensuring normal host-pathogen interactions. We describe the imaging of M. tuberculosis infection using a FRET substrate with maximal emission at 800 nm. The wavelength of the substrate allows sensitive deep tissue imaging in mammals. We will outline aerosol infection of mice with M. tuberculosis, anesthesia of mice, administration of the REF substrate, and optical imaging. This method has been successfully applied to evaluating host-pathogen interactions and efficacy of antibiotics targeting M. tuberculosis.
Introduction
The slow growth rate of M. tuberculosis is a major roadblock in rapid diagnosis of tuberculosis1,2,3. While culture based diagnosis takes weeks to produce results, acid-fast smear has diagnostic limitations4 in children5 and patients co-infected with human immunodeficiency virus6,7. Optical imaging technologies have recently been recognized as an alternative to traditional diagnostic methods for tuberculosis8,9. Fluorescence and bioluminescence can be used to optically image M. tuberculosis in live animals in real-time10,11,12,13,14,15,16,17,18,19. Optical imaging has the benefit of a rapid and specific assessment of an infection with M. tuberculosis20,21,22.
We outline details for optical imaging of M. tuberculosis in live mice using REF. This method is very specific and sensitive23,24 and, similar to other optical methods, is less expensive than other methods of tuberculosis (TB) imaging25, including computed tomography (CT)26, magnetic resonance imaging (MRI)27, and F-fluorodeoxyglucose positron emission tomography/CT (F-FDG PET/CT)28. REF utilizes custom fluorescent or bioluminescent substrates that upon cleavage by a bacterial enzyme, produce a fluorescent product8,29. Hence, it has the advantage of not requiring a recombinant mycobacterial reporter strain30,31. The FRET substrate described is comprised of a fluorochrome and a quencher connected by a β-lactam ring that is hydrolyzed by BlaC (β-lactamase), naturally constitutively expressed by tuberculosis-complex Mycobacterium8,32. The bacteria directly generate signal due to REF catalytic activity that allows amplification by many orders of magnitude and sensitive detection of M. tuberculosis.
The REF substrate used in this study has excellent tissue penetration in live animals and reduced background due to its long wavelength. With this long-wavelength substrate it is possible to achieve a threshold of detection for M. tuberculosis of nearly 100 colony forming units (CFU) in vitro and <1000 CFU in the lungs of mice in vivo (whole animal)8,33. REF can be used as a diagnostic tool for sputum, clinical materials and even directly in patients with micro endoscopic systems16,32,33,34 due its high sensitivity and specificity. REF can be applied to any tuberculosis clinical strain, because it uses a naturally produced bacterial enzyme, BlaC, for detection present in all strains. These characteristics make REF imaging a valuable tool in pre-clinical tuberculosis research in general to facilitate therapeutic and vaccine evaluation as well as analysis of pathogenesis, but may also ultimately be applied to diagnosis in tuberculosis patients.
Protocol
Animal studies were performed in accordance with the guidelines and regulations set forth by the Institutional Animal Care and Use Committee of Texas A&M University. Review and approval from a biohazard safety officer or committee at your institution may be required.
Caution: All the procedures require BSL3 containment. The personnel are required to wear personal protective equipment at all times. All manipulations are performed inside the Biosafety Cabinet (BSC) and all sharps are disposed of in sharps containers. Work surfaces and BSC are cleaned with buffered phenol and 70% ethanol before initiating work and after work. Procedures would normally be done at biosafety level 3 with Mycobacterium tuberculosis, but for illustration and filming purposes, the authors demonstrate these procedures at biosafety level 2 with less virulent bacteria.
1. Strains and culture conditions
Note: M. tuberculosis strain CDC1551 is used in this study, but any M. tuberculosis strain can be used in the same manner.
- Grow the bacteria in M-OADC-TW (7H9 broth supplemented with 0.5% glycerol, 10% oleic acid dextrose complex without catalase, and 0.05% Tween-80) medium standing at 37 °C to an OD600 of 0.5 (~ 0.2 x 10⁷ CFU).
- Dilute the culture in M-OADC-TW (series of 1:10 dilutions of the bacteria). Plate the dilutions of the bacteria (105, 106, 107, 108) in triplicate onto selective 7H11 plates to allow determination of CFU.
- Incubate the plates for four weeks at 37 °C or until colonies can be accurately counted.
- Centrifuge the bacterial inoculum at 8,534 x g for 5 min to obtain a pellet. Wash the pellet once with 10 mL of saline (0.9% NaCl) and re-suspend the pellet in 15 mL of saline (0.9% NaCl).
2. Aerosol infection of mice using a Madison Chamber
- Allow mice to acclimate to the new surroundings for a week.
- Weigh the mice prior to loading them into the chamber.
- Plug three cords into the power strip: the main chamber power, the vacuum pump, and the air compressor, in that order.
- Carefully unscrew the glass jar. Bring the glass jar to the biosafety cabinet and add the challenge inoculum suspended in 15 mL of saline (0.9% NaCl) to achieve ~ 104 – 106 CFU of bacteria in the lungs.
- Close the lid of the glass jar in the biosafety cabinet. Attach the jar to the nebulizer unit and adjust the vertical stainless steel tube so that the lower (intake) end is about a quarter of an inch below the level of the fluid in the jar.
- Load all the animals needed for the experiment (the chamber can hold up to 90 mice) into the chamber and close all the latches on the door.
- Check the main (room) air flow meter. Ensure that the center of the float (ball) runs about 50 L/min as measured on the scale on the left.
- Press Start button on the control panel of the chamber. Set the airflow rate through the compressor air flow meter (the smaller meter in the left) as 4 L/min on the scale. Check visually to ensure that the challenge inoculum is being nebulized.
- After 15 min, when the red light on the front of the control panel appears and an audible signal indicates the end of the run, press Reset button on the lower right corner of the control panel to reset the timers.
- Hold down the small red button on the door of the chamber to release the vacuum.
- Open the chamber door and remove the animals. Place the mice back into their cages.
- Remove the glass nebulizer jar and place in a sealed, leak-proof transport container. Place the container inside the bio-safety cabinet and discard the challenge suspension into a designated waste container.
- Place the used nebulizer jar inside a biohazard bag and seal the bag for transport to the autoclave.
- At the end of the infection procedure, spray the inside of the chamber with buffered phenol and 70% ethanol and allow the chamber to sit for 10 min.
- Then, wipe down all accessible interior surfaces very thoroughly. Dispose of all contaminated paper towels, etc. in the biohazard trash. Autoclave the trash, waste container and used nebulizer jars.
- Place the animals back in the containment room until the imaging time-point.
- On the day of imaging, transfer the animals in a secondary container to the imaging room.
3. Animal anesthesia
- Anesthetize the mice with isoflurane using a customized gas anesthesia system.
- Weigh each of the two charcoal filter canister located on top of the anesthesia unit.
- Replace with a new canister if the weight is 50 g above the initial weight.
- Check the vaporizer unit to ensure sufficient isoflurane for the procedure.
- Place the nose cone holder inside the imaging chamber. Place the number of nose cones required for the procedure and seal the remaining openings with the nose cone blockers.
- Turn on the oxygen supply from the high-pressure cylinder and set it at 55 psi.
- Turn on the evacuation pump located in front of the anesthesia unit and set it to 8 L/min.
- Turn on the oxygen toggle located in front of the anesthesia unit.
- Turn on the gas flow to the anesthesia induction chamber to set the flow of gas at 1.5 L/min. Turn the gas flow off.
- Turn on the gas flow to the imaging chamber to set the flow of gas at 0.25 L/min. Turn the gas flow off.
- Turn on the isoflurane vaporizer and set it at 2 – 2.5%. Adjust the isoflurane level according to the number and weight of animals being used for the experiment by rotating the dial on the isoflurane vaporizer (2 – 2.5% for a mouse weighing ~20 g; 4% for a guinea pig weighing 300 g).
- Place the mice in the anesthesia chamber and close the lid. Turn on the gas flow to the anesthesia induction chamber.
- Leave the mice in the anesthesia induction chamber for 5 – 10 min until completely anesthetized.
- Once the mice are anesthetized, apply an optical ointment to the eyes to protect them while imaging.
- Place the mice in ventral or sternal recumbency such that their noses are placed in the nose cone to facilitate anesthesia of mice during the imaging procedure.
4. Reporter enzyme fluorescence (REF) imaging
- Inject the substrate (20 µM, 2.5 µL/g of weight) by intraperitoneal injection into the infected as well as the control mice. The mice are under anesthesia inside the imaging chamber for less than 1 min.
- Start the imaging system.
- Initialize the system by clicking on Initialize. Wait until the temperature bar turns to green.
NOTE: The imaging chamber consists of a heated platform to maintain body temperature of the animal while imaging. - For imaging acquisition setting, select Fluorescent | Trans-illumination for whole animal or Epi-illumination for lung tissues, Structure and Overlay in Acquisition Control Panel.
- Set Field of view to B for single mouse and lamp level to high.
- Set exposure time to auto, medium binning, 2 – 3 for the f/stop, and excitation filter at 745 nm and emission filters from 780 nm to 840 nm.
- For sequence setup, click on Sequence Setup, select 9 - 12 Trans-illumination points in the lung area.
- Click on Acquire for image acquisition.
- Place the mouse back into the cage post-imaging.
- Monitor the mice until fully recovered or sacrifice for quantifying CFU if imaging at a time-point of the experiment. Perform a modified Karnofsky score to monitor the well-being of mice post-imaging.
5. Analysis of REF imaging
- Open the imaging software.
- Load image files by clicking Browse icon.
- For spectral unmixing, click on Spectral Unmixing in the tool palette and click the spectra required to unmix. Click on start unmixing.
- For optical surface reconstruction, click on Surface Topography.
- Select orientation to dorsal, subject to fur mouse and, click Generate surface.
- Draw Crop image and set Threshold image for a region of interest. Click Done.
- For organ registration, go to the registration tab in 3D Optical Tools dropdown menu.
- Register organs of interest in an organ atlas.
- Adjust organ size or location to the generated surface topography using transform tool on/off located on the panel-Registration Tools.
- Go to Fluorescent tomography (FLIT) 3D reconstruction, and select analyze tab. Select the images to be included for analysis, image type to Normalized Transmission Fluorescence (NTF) efficiency, click Start.
- Check on select all and reconstruct in Data Preview tab.
- For fluorescence quantification, go to Region of Interest (ROI) Tools, add ROI cube to the organ of interest and adjust cube size to cover the organ of interest. Click on measure 3D ROIs.
- In the ROI measurements window, go to 3D ROI measurements, select data type to source voxels and measurements unit to pmolM-1cm-1.
- Save and/or export the result of FLIT 3D reconstruction analysis into a figure or data file.
6. Quantification of bacteria by CFU
- Euthanize the mice by intraperitoneal injection of 0.1 mL pentobarbital sodium (390 mg/mL).
- Check for pedal reflex by squeezing the pads of the feet of mice to ensure there is no reflex reaction.
- Explant the lung tissue from the mice using sterile forceps and scissors. Homogenize the lung tissue in 1 mL of 1x phosphate-buffered saline (PBS).
- Make 10-fold serial dilutions of the lung homogenate in sterile 1x PBS.
- For plating, spot three aliquots of 20 µL each of the respective dilution on the agar plate.
- Incubate the plates in an incubator at 37 °C and monitor for bacterial growth.
- Count the colonies in each spot after the incubation time and express as CFU/ mL by correcting for volume and dilution using the following equation:
CFU/ mL = (C/V) x M
Where C = colony counts per spot, V = volume of sample inoculated on each plate (mL), and M = multiplication factor (reciprocal of the dilution used).
NOTE: If 11 colonies are counted in one spot for a sample volume of 0.002 mL at a sample dilution of 10-4, using the equation, the colony count will be calculated as
(11/0.02) x 104 = 5.5 x 10⁶ CFU/ mL
Representative Results
REF imaging of mice infected with M. tuberculosis along with uninfected control mouse are shown in Figure 1A. The infected mice produced a significantly (P = 0.0057) higher fluorescence signal from the lungs at 6 weeks post-infection compared to control upon substrate administration. A typical time course to study the therapeutic efficacy against M. tuberculosis using REF could be imaging at week 1, 2, 4, 6, 15, 24 post-infection. Fluorescence intensity is quantified using epi-illumination for lung tissues (Figure 1B). The consistently increasing signal from week 2 to week 6 in lungs of infected mice suggests that REF is successfully able to detect M. tuberculosis in vivo. A drop in the background signal of control mice at a later time point (Figure 1B) could be attributed to the increase in body mass and volume of mice over a period of 6 weeks thereby reducing the excitation wavelength penetration. 3D FLIT reconstruction of fluorescence sources in mice infected with M. tuberculosis is represented in Figure 2A. The image sequences are acquired at multiple trans-illumination points in mouse using the same excitation and series of emission filters. These image sequences are then used for 3D FLIT reconstruction for fluorescent source distribution within the animal subject. Figure 2A-D demonstrates the different directions (coronal, sagittal and transaxial) of mouse tomography with lung organ registration. NTF efficiency maps for checking the reconstruction quality are represented in Figure 2E. NTF allows subtracting the background light leakage from trans-illumination images through an extra image captured with neutral density filter. The image taken with the specific excitation filter (Figure 2E-measured) is normalized to the transmission image measured with the same emission filter and an open excitation filter (Figure 2E- simulated) to give the signal produced by the substrate alone. The similar measured and simulated NTF efficiency profile in both the horizontal (Figure 2F) and vertical (Figure 2G) profiles with nearly 0% percentage error (Figure 2E-% error) provides evidence of a good quality 3D reconstruction with reduced artifacts and improved signal localization and sensitivity.
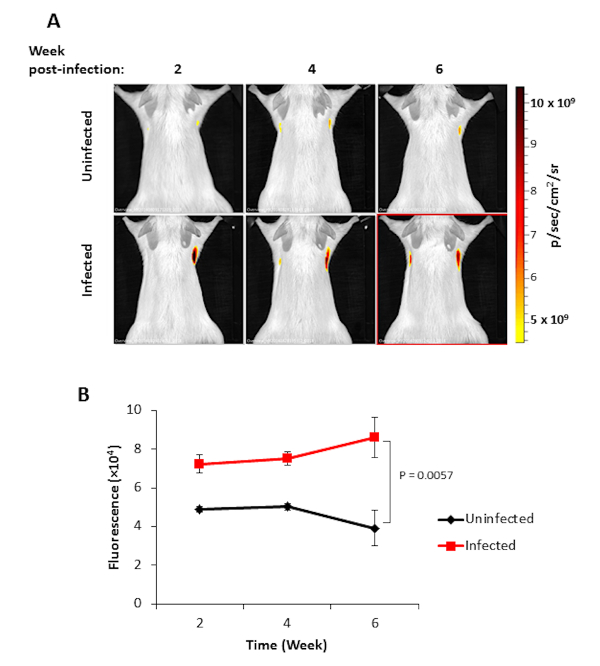
Figure 1. Imaging of M. tuberculosis with REF. (A) in vivo imaging of mice uninfected and infected with M. tuberculosis at 2, 4, and 6 weeks post-infection. The color bar represents the intensity of the fluorescent signal in photons per second per cm2 from low (yellow) to high (red). (B) Quantification of fluorescence intensity from mice infected with M. tuberculosis. Fluorescence values for both control (black) and infected (red) are represented along with the standard error for each time point. The significance of results was determined by Students t-test, p values of <0.05 were considered significant. Please click here to view a larger version of this figure.
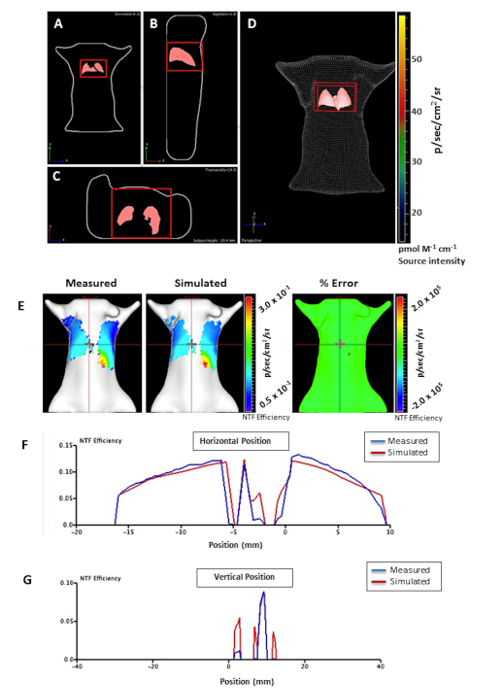
Figure 2. 3D FLIT reconstruction of fluorescence sources in mice infected with M. tuberculosis. Mouse tomography represented in different directions; A) coronal, B) sagittal, and C) transaxial with D) lung organ registration. The 3D region of interest (ROI) is represented as a red cube in the lung for source measurements. (E) NTF efficiency maps of the measured and simulated for checking the reconstruction quality. The measured and simulated NTF efficiency profile was compared, providing good quality of 3D reconstruction (similar measured and simulated NTF efficiency). F) Horizontal and G) vertical signal profiles representing measured (blue) and simulated (red) NTF efficiency curve. The horizontal and vertical red bars indicate the source position. The color bar represents the intensity of the fluorescent signal in photons per second per cm2 from low (blue) to high (red). Please click here to view a larger version of this figure.
Discussion
When using imaging techniques, such as REF, there are key strategies that allow generation of robust and consistent data. Optical imaging produces scattered light in tissues which can impact the depth of penetration, since it is difficult to capture light emitted in all directions. Use of a near infra-red fluorophore (NIR) substrate for REF imaging having an excitation and emission wavelength in the Querange of 700 – 900 nm facilitates minimal absorption of the fluorescent signal by mammalian tissues. The custom designed substrate was constructed by linking a NIR fluorophore, IRDye 800Cw to a quencher, IRDye QC-1, by a lactam ring allowing fluorescence resonance energy transfer-based quenching. IRDye has excellent tissue penetration and light scattering characteristics and does not have any evident harmful effect on mammals36, being cleared from the blood and organs by 24 h. Fluorescence signal significantly increases beginning 4 h after substrate administration, reaching maximal levels 6 h after administration.
The bacterial infectious dose, mode of administration of infectious dose and the substrate as well as time-points of imaging post infection by performing pilot studies should be standardized before embarking on large, complex, experiments. Pilot studies can greatly reduce time and cost when imaging a large number of animals because a standard procedure can be optimized prior to doing the key experiment. Bacterial loads should be determined in the organs/tissues of interest following whole body imaging using trans-illumination and ex vivo lung imaging using epi-illumination to validate the source of the signal and determine the quality of correlation with bacterial numbers present8. Pilot studies will provide insight into the threshold of detection, dynamic range of the technique as well as determination of the optimal experimental conditions for imaging.
The primary advantages of using REF imaging as compared to other fluorescent and bioluminescent strategies are its high sensitivity and ability to image natural M. tuberculosis strains. REF imaging utilizes the catalytically robust enzyme BlaC that is conserved in all M. tuberculosis clinical isolates and tuberculosis-complex strains. The great sensitivity of REF imaging is due to the rapid catalytic rate of BlaC in combination with retention of the cleaved fluorescent product by the host cell. Signal continuously increases as long as the substrate is available resulting in nearly limitless build-up of the signal within the infected cells and tissues. This increased sensitivity of REF imaging as compared to alternative approaches of imaging allows specific detection of M. tuberculosis both in vitro and in vivo8,23,24,29.
REF imaging can be used for bacterial detection without genetic modifications enabling its direct application to any infection model, either laboratory animals8,37 or human clinical materials29,38. REF can be used to detect and image a wide array of pathogens39,40, since fluorogenic substrates can be developed for numerous enzymatic targets other than BlaC such as proteases, kinases, ureases, and β-galactosidases. However, careful thought should be given to the target in order to ensure it displays optimal characteristics for imaging. BlaC represents a good model enzyme for characteristics that will ensure successful application of this strategy. REF imaging provides an immediate read-out on bacterial load present in lungs during infections, which greatly speeds progress in study of tuberculosis pathogenesis, since determination of bacterial numbers normally requires three to six weeks, but even in more rapid-growing organisms this approach will save a great deal of time. REF could also be used to discriminate carcinomas from tuberculosis, a key problem in diagnosis of nodular lesions in patients41,42. REF serves as a novel tool to accelerate translational tuberculosis imaging and can even be applied to humans, potentially allowing rapid prediction of therapeutic outcomes.
Materials
| Isoflurane | VETONE | 501027 | |
| CNIR800 | Custom synthesized | ||
| Fatal Plus solution | Vortech Pharmaceutical Ls, Ltd | ||
| 7H9 Middlebrook broth | BD | 271310 | |
| OADC Middlebrook enrichment | BD | 212351 | |
| Sporcidin | RE-1284F | ||
| 7H11 Middlebrook Agar | BD | 212203 | |
| Madison Chamber | |||
| IVIS Spectrum | Perkin Elmer | 124262 | |
| XGI-8-gas Anesthesia System | Perkin Elmer | ||
| Living Imaging software | Perkin Elmer | ||
| Transparent nose cones | Perkin Elmer | ||
| M. tuberculosis strain CDC1551 | ATCC | ||
| Female BALB/C mice, 5-7 weeks | Jackson Laboratory |
References
- Lewinson, D. M., et al. Official American thoracic society/infectious diseases society of America/ centers for disease control and prevention clinical practice guidelines: diagnosis of tuberculosis in adults and children. Clin Infect Dis. 64 (2), 1-33 (2017).
- Lee, J., et al. Sensititre MYCOTB MIC plate for testing Mycobacterium tuberculosis susceptibility to first- and second-line drugs. Antimicrob Agents Ch. 58 (1), 11-18 (2014).
- Dheda, K., et al. The epidemiology, pathogenesis, transmission, diagnosis, and management of multidrug-resistant, extensively drug-resistant, and incurable tuberculosis. Lancet Resp Med. 5 (4), 291-360 (2017).
- Behr, M. A., et al. Transmission of Mycobacterium tuberculosis from patients smear-negative for acid-fast bacilli. Lancet. 353 (9151), 444-449 (1999).
- Cruz, A. T., Revell, P. A., Starke, J. R. Gastric aspirate yield for children with suspected pulmonary tuberculosis. J Pediatric Infect Dis Soc. 2 (2), 171-174 (2013).
- Monkongdee, P., et al. Yield of acid-fast smear and mycobacterial culture for tuberculosis diagnosis in people with human immunodeficiency virus. Am J Resp Crit Care. 180, 903-908 (2009).
- Karstaedt, A. S., Jones, N., Crewe-Brown, H. H. The bacteriology of pulmonary tuberculosis in a population with high human immunodeficiency virus seroprevalence. Int J Tuberc Lung D. 2 (4), 312-316 (1998).
- Yang, H. J., et al. Real-time imaging of Mycobacterium tuberculosis, using a novel near-infrared fluorescent substrate. J Infect Dis. 215 (3), 405-414 (2017).
- Nooshabadi, F., et al. Intravital excitation increases detection sensivity for pulmonary tuberculosis by whole-body imaging with β-lactamase reporter enzyme fluorescence. J Biophotonics. , (2016).
- Chang, M. H., Cirillo, S. L. G., Cirillo, J. D. Using luciferase to image bacterial infections in mice. J Vis Exp. (48), (2011).
- Kong, Y., Subbian, S., Cirillo, S. L. G., Cirillo, J. D. Application of optical imaging to study of extrapulmonary spread by tuberculosis. Tuberculosis. 89 (1), 15-17 (2009).
- Andreu, N., et al. Rapid in vivo assessment of drug efficacy against Mycobacterium tuberculosis using an improved firefly luciferase. J Antimicrob Chemoth. 68 (9), 2118-2127 (2013).
- Andreu, N., et al. Optimisation of bioluminescent reporters for use with Mycobacteria. PLoS ONE. 5 (5), 10777 (2010).
- Nooshabadi, F., Yang, H. Y., Bixler, J. N., Kong, Y., Cirillo, J. D., Maitland, K. C. Intravital fluorescence excitation in whole-animal optical imaging. PLoS ONE. 11 (2), 0149932 (2016).
- Bixler, J. N., Kong, Y., Cirillo, J. D., Matiland, K. C. Multi-scale fluorescence imaging of bacterial infections in animal models. Proc. SPIE 8565, Photonic Therapeut Diagnos IX. , 856537 (2013).
- Mufti, N., Kong, Y., Cirillo, J. D., Maitland, K. C. Detection of bacterial infection with a fiber optic microendoscope. Proc. SPIE 8092, Med Laser Appl Laser-tissue Interac V. , 80920A (2011).
- Zelmer, A., et al. A new in vivo model to test anti-tuberculosis drugs using fluorescence imaging. J Antimicrob Chemoth. 67 (8), 1948-1960 (2012).
- Yang, D., Ding, F., Mitachi, K., Kurosu, M., Lee, R. E., Kong, Y. A fluorescent probe for detecting Mycobacterium tuberculosis and identifying genes critical for cell entry. Front. Microbiol. 7, (2016).
- Ordonez, A. A., et al. Mouse Model of pulmonary cavitary tuberculosis and expression of matrix metalloproteinase-9. Dis Model Mech. 9, 778-779 (2016).
- Mills, B., Bradley, M., Dhaliwal, K. Optical imaging of bacterial infections. Clin Transl Imaging. 4, 163-174 (2016).
- Calderon, V., Valbuena, G., Goez, Y., Endlsey, J. J. A humanized mouse model of tuberculosis. PLoS ONE. 8 (5), 63331 (2013).
- Vergne, I., Chua, J., Lee, H. H., Lucas, M., Belisle, J., Deretic, V. Mechanism of phagolysosome biogenesis block by viable Mycobacterium tuberculosis. P Natl Acad Sci Usa. 102 (11), 4033-4038 (2004).
- Kong, Y., et al. Imaging tuberculosis with endogenous β- lactamase reporter enzyme fluorescent in live mice. P Natl Acad Sci Usa. 107 (27), 12239-12244 (2010).
- Kong, Y., Cirillo, J. D. Reporter enzyme fluorescence (REF) imaging and quantification of tuberculosis in live animals. Virulence. 1 (6), 558-622 (2010).
- Skoura, E., ZumLa, A., Bomanji, J. Imaging in tuberculosis. Int J Infect Dis. 32, 87-93 (2015).
- Lee, K. S., Im, J. G. CT in adults with tuberculosis of the chest: characteristic findings and role in management. Am J Roentgenol. 164, 1361-1367 (1995).
- Hoffman, E. B., Crosier, J. H., Cremin, B. J. Imaging in children with spinal tuberculosis. A comparison of radiography, computed tomography and magnetic resonance imaging. J Bone Joint Surg Br. 75 (2), 233-239 (1993).
- Soussan, M., et al. Patterns of pulmonary tuberculosis on FDG-PET/CT. Eur J Radiol. 81 (10), 2872-2876 (2012).
- Sule, P., et al. New directions using reporter enzyme fluorescence (REF) as a tuberculosis diagnostic platform. Tuberculosis. 101, 78-82 (2016).
- Heuts, F., Carow, B., Wigzell, H., Rottenberg, M. E. Use of non-invasive bioluminescent imaging to assess mycobacterial dissemination in mice, treatment with bactericidal drugs and protective immunity. Microbes Infect. 11 (14-15), 1114-1121 (2009).
- Kong, Y., et al. Application of fluorescent protein expressing strains to evaluation of anti-tuberculosis therapeutic efficacy in vitro and in vivo. PLoS ONE. 11 (3), 0149972 (2016).
- Xie, H., et al. Rapid point-of-care detection of the tuberculosis pathogen using a BlaC-specific fluorogenic probe. Nature Chem. 4, 802-809 (2012).
- Nooshabadi, F., et al. Whole-animal imaging of bacterial infection using endoscopic excitation of β-lactamase (BlaC)- specific fluorogenic probe. Proc SPIE. 9715, 97150 (2016).
- Ghiasi, M., Pande, T., Pai, M. Advances in tuberculosis diagnostics. Curr Trop Med Rep. 2 (2), 54-61 (2015).
- Rao, J., Andrasi, A. D., Yao, H. Fluorescence imaging in vivo: recent advances. Curr Opin Biotech. 18 (1), 17-25 (2007).
- Marshall, M. V., Draney, D., Sevick-Muraca, E. M., Olive, D. M. Single-dose intravenous toxicity study of IRDye 800CW in Sprague-Dawley rats. Mol Imaging Biol. 12 (6), 583-594 (2010).
- Zhan, L., Tang, J., Sun, M., Qin, C. Animal models for tuberculosis in translational and precision medicine. Front Microbiol. 8, 717 (2017).
- Rao, J., Xie, H., Cheng, Y., Cirillo, J. D. 2,7-disubstituted cephalosporin derivatives as beta-lactamase substrates and methods for their use for the diagnosis of tuberculosis. US patent. , (2015).
- Shao, Q., Zheng, Y., Dong, X., Tang, K., Yan, X., Xing, B. A Covalent Reporter of β-Lactamase Activity for Fluorescent Imaging and Rapid Screening of Antibiotic-Resistant Bacteria. Chem Eur J. 19 (33), 10903-10910 (2013).
- Li, L., Li, Z., Shi, W., Li, X., Ma, H. Sensitive and Selective Near-Infrared Fluorescent Off-On Probe and Its Application to Imaging Different Levels of β-Lactamase in Staphylococcus aureus. Anal Chem. 86 (12), 6115-6120 (2014).
- Ashizawa, K., et al. Coexistence of lung cancer and tuberculoma in the same lesion: demonstration by high resolution and contrast-enhanced dynamic CT. BRIT J RADIOL. 77 (923), 959-962 (2004).
- Figueroa, C. J., Riedel, E., Glickman, M. S. Clinical and radiographic differentiation of lung nodules caused by mycobacteria and lung cancer: a case-control study. BMC Infect Dis. 15 (482), (2015).
