Rapid and accurate detection of plant pathogens on-site, especially soil-borne pathogens, is crucial to prevent further inoculum production and proliferation of plant diseases in the field. The method developed here using a portable real-time PCR detection system enables on-site diagnosis under field conditions.
Method Article
On-Site Molecular Detection of Soil-Borne Phytopathogens Using a Portable Real-Time PCR System
In This Article
Summary
Abstract
On-site diagnosis of plant diseases can be a useful tool for growers for timely decisions enabling the earlier implementation of disease management strategies that reduce the impact of the disease. Presently in many diagnostic laboratories, the polymerase chain reaction (PCR), particularly real-time PCR, is considered the most sensitive and accurate method for plant pathogen detection. However, laboratory-based PCRs typically require expensive laboratory equipment and skilled personnel. In this study, soil-borne pathogens of potato are used to demonstrate the potential for on-site molecular detection. This was achieved using a rapid and simple protocol comprising of magnetic bead-based nucleic acid extraction, portable real-time PCR (fluorogenic probe-based assay). The portable real-time PCR approach compared favorably with a laboratory-based system, detecting as few as 100 copies of DNA from Spongospora subterranea. The portable real-time PCR method developed here can serve as an alternative to laboratory-based approaches and a useful on-site tool for pathogen diagnosis.
Introduction
Accurate and rapid identification of causative pathogens significantly impacts decisions regarding plant disease management. Soil-borne diseases are particularly difficult to diagnose because the soil environment is extremely large relative to plant mass, and complex, making it a challenge to understand all the aspects of soil-borne diseases. Moreover, soil-borne diseases can be symptomless during early infection stages, dependent on environmental stressors, and some have long latent periods that result in delayed diagnoses1. Many soil-borne pathogens have developed survival structures, such as specialized spores or melanized hyphae, which can survive in the soil for many years even in the absence of their hosts. Utilized approaches for soil-borne disease management include: avoiding known infested fields, using pathogen-free certified seeds and seedlings, keeping equipment sanitary, and restricting the movement of soil and water when possible. Knowledge of the pathogen presence through molecular detection strategies can also play a useful role by informing timely decisions regarding early-stage treatments or pre-plant assessments of the fields. On-site testing provides additional advantages of providing a rapid result without sending the sample to a diagnostic laboratory that maybe some distance away and also can engage the grower if such a diagnostic is performed 'field-side' in their presence.
For on-site diagnosis based on molecular detection, sensitivity, specificity, robustness (repeatability and reproducibility), and efficiency (i.e., simplicity and cost performance) are crucial factors for consideration. Lateral flow devices (LFDs) such as the Immunostrip and PocketDiagnostic, are popular methods for on-site pathogen detection because of their simplicity as a one-step assay. However, LFDs may not be the right diagnostic tool in all situations because they lack the sensitivity and specificity, and occasionally provides ambiguous results if the target pathogen is in low concentrations and can cross-react with similar species or genera2. Loop-mediated isothermal amplification (LAMP) is also applicable for on-site pathogen detection and is particularly inexpensive due to low-cost reagents, reaction conditions that remain constant, and simple colorimetric visual analysis. However, both LFDs and LAMP are typically used qualitatively, although both approaches can be used quantitatively with more expensive equipment3. The polymerase chain reaction (PCR) offers high specificity, high sensitivity, and a quantitative capability in comparison to the aforementioned methods of detection. However, the conventional lab-based PCR technology requires expensive laboratory equipment and skilled personnel, which is a major disadvantage in adopting this technology as a detection method for on-site purposes.
In this protocol, an on-site diagnostic method using a portable real-time PCR instrument is demonstrated. Real-time PCR technology offers advantages over other methods in terms of quantitative accuracy, sensitivity, and versatility, and has been widely used for the detection of a broad range of plant pathogens4,5, including various potato pathogens in soil6. Because of the recent trends of the fast-growing, competitive market, equipment required for PCR technology has continued to develop to be more compact and less expensive7. The protocol is composed of the following steps: magnetic bead-based nucleic acid extraction, portable real-time PCR (fluorogenic probe-based assay), and quantitative data analysis that can be all done remotely using a laptop computer (Figure 1).
Using the portable PCR protocol developed here, soil samples were analyzed to detect the soil-borne pathogen, Spongospora subterranea. Spongospora was chosen as it is an important potato pathogen as the causal agent of powdery scab8. In recent decades, the presence of this disease is considered to have spread to many regions where potatoes are grown9,10. Powdery scab, through the presence of pimple like lesions on the tubers can cause considerable qualitative yield losses to potato growers. In addition, S. subterranea can vector Potato Mop Top Virus (PMTV), which can cause internal lesion symptoms in tubers (known as spraing)11,12. Therefore, it is important to know if S. subterranea is present in fields prior to planting6. We also demonstrate the usefulness of this protocol for the detection of Rhizoctonia solani Anastomosis Group 3 (AG3) and PMTV. Although several anastomosis groups of Rhizoctonia solani cause diseases in potatoes, AG3 is arguably the most important worldwide13, causing stem canker and black scurf resulting in marketable yield losses of up to 30%14. PMTV causes necrotic lesions within the tubers, which are commonly called spraing. This virus has recently been reported for the first time in several states in the Pacific Northwest15,16,17, and is of increasing concern to growers in this important potato growing region. In addition to determining the effectiveness of portable PCR for these important diseases, optimum DNA extraction methodology and soil sample size were also investigated in this study.
The results suggest that the portable PCR method is versatile and applicable for the detection of different pathogens. The on-site detection method we developed can allow the frontline workers in agriculture (e.g., growers) to make earlier decisions regarding disease management, such as variety selections or rotations, and can quantify a plant pathogen in the sample during a field survey, prior to planting, to avoid potential disease outbreaks.
Protocol
1. On-Site Molecular Detection of Pathogens using a Portable Real-Time PCR System
Note: See Figure 1.
- Magnetic bead-based DNA extraction
Note: A magnetic bead-based DNA extraction kit (e.g. from Primerdesign) was used according to the manufacturer's instructions. All reagents should be stored at room temperature (18-25 °C). Once the lyophilized Proteinase K (Bottle No.1) is suspended (using Bottle No.1a), store at -20 °C.- Mix 20-50 mg of soil sample with 500 µL of Sample Prep Solution in a microtube.
Note: The ratio of soil:Prep Solution is important as mixing them in other ratios may cause a failure of downstream experiments (e.g., contamination by inhibitors of PCR). - Grind the soil on the bottom of the tube using a small sterile pestle until the solution is cloudy. Further suspend soil particles in the solution by shaking the microtube and let it stand, undisturbed, to let the soil particles settle completely (typically between 5 to 10 min).
- Transfer 200 µL of supernatant into a fresh microtube and add 200 µL of Lysis Buffer (Bottle No. 2: Guanidine Hydrochloride solution) and 20 µL of Proteinase K (Bottle No.1).
- Mix the lysate thoroughly by inverting the tube and incubate at ambient temperature for 15 min.
Note: If the lysate is found on the microtube lid, tap the tube or use a centrifuge, if available to remove from the lid. - Add 500 µL of the binding buffer/magnetic bead mix (Bottle No.3) to the lysed sample. Mix well by pipetting up and down and incubate at ambient temperature for 5 min away from the magnetic tube rack.
Note: Make sure to mix the bead solution well before use to ensure that the beads are aliquoted evenly from the storage bottle. - Place the microtube on the magnetic tube rack. Wait at least 2 min or until all the beads in the microtube attach to the magnetic-side wall. Then, remove and discard all of the supernatant by pipetting.
Note: Do not disturb the magnetized beads while removing and aspirating the supernatant. DNA has now been captured by the magnetic beads. - Remove the microtube from the magnetic tube rack, add 500 µL of Wash Buffer-1 (Bottle No. 4: sodium perchlorate/ethanol solution) and re-suspend the beads by repeated pipetting until the beads are uniformly dispersed. Perform this washing step to remove protein and salt from the sample. Let the mixture sit for 30 s.
- Repeat step 1.1.6.
- Remove the microtube from the magnetic tube rack, add 500 µL of Wash Buffer-2 (Bottle No. 5: sodium perchlorate/ethanol solution) and re-suspend the beads by repeated pipetting until the beads are uniformly dispersed. Let the mixture sit for 30 s.
- Repeat step 1.1.6.
- Remove the microtube from the magnetic tube rack and then add 500 µL of 80% ethanol (Bottle No.6).
Note: This step is necessary for the removal of residual salts from the sample.- Re-suspend the beads by repeated pipetting until the beads are uniformly dispersed. Let this stand for 10 min with occasional mixing by inversion.
- Repeat step 1.1.6.
- Air dry the magnetic bead pellet for 10 min at ambient temperature with the microtube lid open.
Note: The beads should be free from any visible residual ethanol but not completely dried out. - Remove the microtube from the magnetic tube rack, add 50-200 µL of Elution Buffer (Bottle No.7) and re-suspend the beads by repeated pipetting until the beads are uniformly dispersed and let it stand for 30 s.
Note: In the above steps, the purified DNA is released from the magnetic beads into the elution buffer. - Place the microtube on the magnetic tube rack. Wait at least 2 min or until all the beads in the microtube attach to the magnetic-side wall.
- Transfer the supernatant that now contains the purified DNA/RNA to a 0.5 mL microtube for use in the downstream steps.
- Mix 20-50 mg of soil sample with 500 µL of Sample Prep Solution in a microtube.
- Portable real-time PCR
Note: A portable thermocycler and the PCR assay kit were used according to the manufacturer's instructions (see the Table of Materials).- Open and run the thermocycler-associated software, select Target detection test and input all the description information into the Name & Details, Notes, Samples, and Tests data entry fields.
Note: Wells #1 and #2 are designated by the software for the negative control and positive control, respectively. - Prepare PCR reagents prior to use. Transfer 500 µL of the master mix re-suspension buffer into the tube containing lyophilized master mix and mix well by inversion. Transfer the entire master mix into the brown microtube labeled primers/probe (Table 2).
- Cap and shake the microtube to mix. Thorough mixing is required to ensure that all components are re-suspended completely. Let this mixture sit for 5 min before use.
Note: Store the reaction mix at -20 °C after use.
- Cap and shake the microtube to mix. Thorough mixing is required to ensure that all components are re-suspended completely. Let this mixture sit for 5 min before use.
- Prepare a negative control by transferring 10 µL of the prepared reaction mix from the previous step into a 0.2 mL PCR tube and then add 10 µL of sterile nuclease-free deionized water.
- Prepare a positive control by transferring 10 µL of the prepared reaction mix from the step 1.2.2 into a 0.2 mL PCR tube and then add 10 µL of positive control template.
- For each sample, transfer 10 µL of the prepared reaction mix from the previous step into a 0.2 mL PCR tube, and then add 10 µL of sample DNA prepared from step 1.1.16.
- Load the wells of the thermocycler with the contents from their respective PCR tubes as described in step 2.1.1.
- Once all the necessary information has been entered and confirmed, select Start Run and choose either the ethernet-connected instrument or a USB drive.
Note: If the USB drive option is selected, the run file must be saved on the drive to be used with the thermocycler (e.g., F:\genesig). The run will begin immediately after the drive is inserted into the thermocycler.
- Open and run the thermocycler-associated software, select Target detection test and input all the description information into the Name & Details, Notes, Samples, and Tests data entry fields.
- Data analysis of portable real-time PCR.
- Once the run has finished, open the run file (.usb) from the USB drive using the thermocycler-associated software or directly view the run results in the software by clicking Results.
- Before analyzing results, save the completed run to avoid losing data.
- In the Results tab, view the status of the run, categorized by samples.
Note: Data that can be obtained in this tab are the status of results and copy number detected in the sample. - Click on the Details tab to view the amplification curves. When the target is successfully detected, Cq (quantification cycle) values of both the target and internal control are displayed.
Note: These values are calculated in the final report and are used to determine whether a sample is positive for the target and if there are problems with the reaction or the DNA samples.
2. Other protocols
- Alternative lab-based DNA extraction methods
- CTAB-phenol-chloroform based methods
- Perform CTAB-phenol-chloroform based methods, following the Doyle method18 and the Dellaporta method19 as described previously.
- DNA mini-preparation method
Note: The Edwards method20 was performed as follows.- Add 500 mg of soil, followed by five 1.4 mm ceramic beads and 750 µL of Edwards buffer (200 mM Tris, pH 8.0, 200 mM NaCl, 25 mM EDTA, 0.5% SDS) to a microtube and mix well.
- Incubate the microtube at 65 °C for 5 min.
- Homogenize the sample with a bead beater homogenizer for 60 s (or by using a mortar and pestle).
- Centrifuge the sample at 14,000 x g for 5 min.
- Transfer 500 µL of supernatant to a fresh microtube and then mix with 500 µL of chilled isopropanol. Mix by inverting the tube 10 times.
- Centrifuge the sample at 14,000 x g for 15 min to pelletize the DNA.
- Decant the supernatant and let the DNA pellet air dry at room temperature until the remaining ethanol has evaporated.
- Wash the DNA pellet with 750 µL of chilled 70% ethanol.
- Air dry the pellet before re-suspending in 50-100 µL of TE buffer (10 mM Tris-HCl, pH 8.0 and 1 mM EDTA).
- Other Alternative methods
- Perform Silica-base DNA extraction using kit #1 (MP BIO Fast DNA Spin) and kit #2 (Zymo BIOMICS DNA Miniprep Kit) according to the manufacturers' instructions.
- CTAB-phenol-chloroform based methods
- Conventional lab-based real-time PCR.
Note: A conventional thermocycler was used with mastermix for probe-based PCR, various primers and oligonucleotide probes (Table 2).- Using non-transparent bottomed PCR tubes or a PCR plate, prepare 20 µL reactions for all DNA samples to be analyzed, as well as a negative control (nuclease-free deionized water) and a positive template control prepared in-house.
- For each PCR tube or well, prepare a mixture including 10 µL of the mastermix, 7 µL of nuclease-free deionized water, 2 µL of 2 µM primers/probe, and 1 µL of DNA sample (from step 1.1.16, or 2.1) or control template, per sample.
- Close the PCR tubes or plate and begin the reaction by selecting the appropriate PCR program.
- Data analysis of conventional lab-based real-time PCR
- Use thermocycler-associated software to analyze the results from the conventional thermocycler. To begin data analysis, transfer the run file from the thermocycler to a USB drive, insert a USB drive and select Export.
- Open the data file (.pcrd) from the exported run in the thermocycler-associated software.
- Highlight the well of a sample by locating its corresponding well on the instrument. Amplification curves and standard curves (if applicable) are automatically generated. If the sample information is not entered, click Plate Setup or a similar function to begin data input before analyzing data.
- View the data on the quantification tab; this can be exported for data analysis with a third-party software such as CSV, XML, or HTML file readers.
- Obtain Cq data based on the determined thresholds and compare it with the positive and negative controls.
Note: If the DNA standards of the target were used in the assay, compare the sample Cq data to that of the standards to determine the Cq cut-off
Results
Comparison of DNA extraction methods
The compatibility of a magnetic bead-based DNA extraction method with real-time PCR was evaluated by detecting the amounts of S. subterranea DNA in a soil sample from fields infested with the pathogen. As shown in Supplemental Figure 1, the magnetic bead-based method was compared with the other methods including a CTAB-phenol-chloroform based method18, quick DNA mini-preparation methods19,20, and other standard silica-based DNA extraction kits. DNA samples extracted using the six different methods were subjected to conventional lab-based real-time PCR. The results suggested that the magnetic bead-based method is comparable with the other methods, although silica-based DNA extraction kit showed the best performance among the methods we tested. All kits contain guanidinium thiocyanate or guanidinium hydrochloride: both are powerful chaotropic agents, which denature most of cellular proteins including RNases and DNases. Therefore, using the methods is suitable for both DNA and RNA extractions.
Comparison between a portable real-time PCR and a conventional lab-based real-time PCR
To compare the sensitivity and specificity of a portable PCR to a conventional lab-based PCR, absolute quantification of the pathogen DNA was performed using different amounts of the S. subterranea ITS gene, which was carried by the pGEM-T vector21. A series of 10-fold dilutions of the ITS gene (106 to 100 copies) were analyzed using the SsTQ primers/probe set22. The results demonstrated that the portable PCR method detected the target pathogen DNA (~100 copies), although the sensitivity was 10 times lower than that of the conventional lab-based PCR method, which detected at least 10 copies (Figure 2).
For further validation, artificially infested soils were tested. S. subterranea sporosori were obtained from powdery scab root galls from potato roots. The soils were infested with sporosori suspensions at a final concentration of 105 sporosori/g dry weight of soil. Using the magnetic bead-based method, DNA was extracted from the infested soil samples, and 10-fold serial dilutions were prepared to obtain concentrations equivalent to 105, 104, 103, 102, 101, and 100 sporosori/g dry weight of soil. The DNA samples were used for PCR using the SPO primer/probe set23. The results showed that the portable PCR method has comparable analytical capability to a conventional lab-based PCR method but, again, the sensitivity was reduced by a factor of ~10 (Figure 3).
Finally, we tested a soil sample from a field that was naturally contaminated with S. subterranea. The magnetic bead-based DNA extraction was performed on different amounts of soils (10, 20, 50 and 100 mg of soil per 500 µL of extraction buffer solution). The results suggested that the optimal weight of soil as a starting material for the DNA extraction was 50-100 mg (Figure 4). Soil amounts outside the range caused a failure of the downstream PCR steps. This effect might be because when excess amounts of soil are used as starting material, contaminations (e.g., phenolic compounds) can interfere with the PCR24. In the case of lower volumes of soil, the amount of extracted DNA may be lower than the detection limit of PCR (e.g., the yield of total DNA extracted from 10-20 mg soil was varied). Sensitivity was quite comparable between the portable PCR and conventional PCR methods. Similar results were obtained in DNA samples by different extraction methods (Supplemental Figure 2)
Detection of other pathogens by the on-site detection system using a portable real-time PCR
We tested the portable PCR method to detect other important soil-borne potato pathogens, R. solani AG3 and PMTV. In this study, we performed real-time PCR using the RsTq primers/RQP1 probe set25 for R. solani AG3 detection with DNA from pure culture. We also performed real-time PCR using the PMTV-D primer/probe set26 for PMTV detection with RNA from a spraing symptomatic tuber sample was used. As shown in Figure 5, the portable PCR method successfully detected both pathogens. The results were comparable between the portable and conventional instruments, suggesting that the portable PCR method is versatile and applicable to other pathogen detections if the primer sequences designed for real-time PCR are available.

Figure 1. Procedure of a portable real-time PCR system for on-site pathogen detection. The protocol is composed of steps in the following order: lysate preparation by brief homogenization (A), magnetic bead-based nucleic acid extraction (B), portable real-time PCR (C), and quantitative data analysis using a laptop computer (D). Note that all steps can be completed on site.
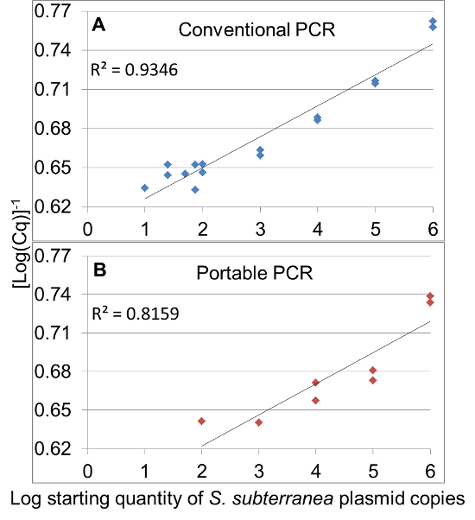
Figure 2. Comparison of sensitivity between a portable PCR and a conventional lab-based PCR. Quantification of the pathogen DNA was performed using different amounts of the S. subterranea ITS gene (106 to 100 copies) with the SsTQ primers/probe set. Linear regression between log value of S. subterranea plasmid DNA and reciprocal Log value of Cq on the conventional thermocycler (A) and the portable thermocycler (B). Please click here to view a larger version of this figure.
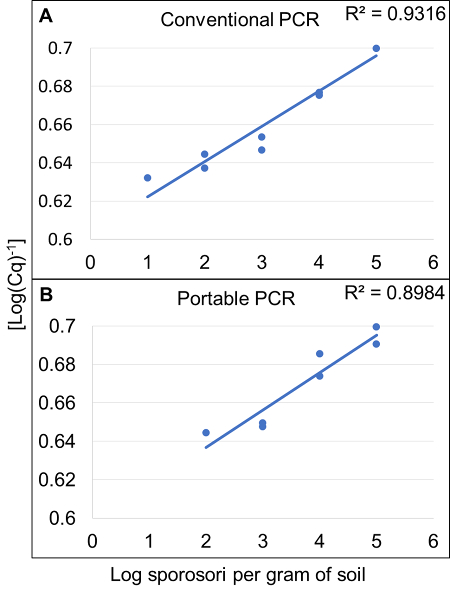
Figure 3. Comparison of detection performance in artificially infested soils with S. subterranea. The soils were artificially infested (105 to 100 sporosori/g dry weight of soil) with S. subterranea sporosori suspensions. Using the magnetic bead-based method, DNA was extracted from the infested soil samples. PCRs were performed using the soil samples with the SPO primer/probe set. Linear regression between log value of the starting quantity in sporosori per gram of soil and the reciprocal log value of Cq on the conventional thermocycler (A) and the portable thermocycler (B). Please click here to view a larger version of this figure.
![Quantitative PCR soil DNA analysis, graphs showing correlation: log DNA quantity vs. [Log(Cq)]⁻¹.](/files/ftp_upload/56891/56891fig4v2.jpg "figure-results-4")
Figure 4. Comparison of starting amount of soil samples for DNA extraction. The magnetic bead-based method was used for DNA extraction from 10, 20, 50, and 100 mg of soil samples. Real-time PCRs were performed using the portable thermocycler. Standard curves represent the relationship between the amount of total DNA extracted from the soil samples (x-axis) and the amounts of PCR product (y-axis) amplified by the Sss primer/probe set. Please click here to view a larger version of this figure.
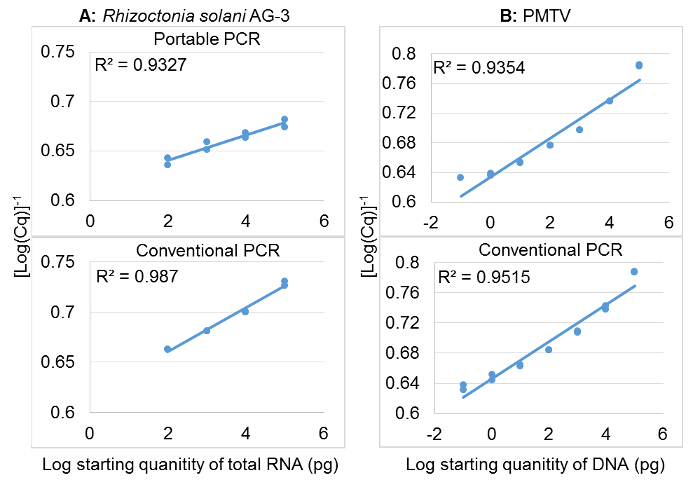
Figure 5. Detection of other potato pathogens, R. solani and PMTV. Real-time PCRs were performed using the portable thermocycler and the conventional thermocycler. R. solani AG3 was detected in total DNA extracted from pure culture using RsTq primers and the RQP1 probe (A) PMTV was detected in total RNA extracted from a PMTV-infected tuber sample using the PMTV-D primer/probe set (B). Please click here to view a larger version of this figure.

Figure 6. A diagnostic pipeline for phytopathogens. Flowchart shows a general workflow for phytopathogen diagnosis. Note that the traditional step, e.g., visual identification, can be omitted if on-site molecular detection is utilized, which makes the entire process of diagnosis simple and fast. Please click here to view a larger version of this figure.
| Portable real-time PCR | Real-time PCR | LAMP | ELISA | Lateral-flow | |
| Cost per target reaction | $0.60-$8.47 | $0.60 | $0.75 | $0.60 | $4.74 |
| Sensitivity | 100 copies | 10 copies | 10 copies | 1-10 sporosori33 1-10 ng/mL (protein)33 | 1-10 sporosori34 5x10⁵CFU/mL35 |
| Time Expense | 90 minutes | 80-240 minutes | 50-90 minutes32 | 3-24 hours | 10-15 minutes |
| Preparation Required | ●Nucleic acid extraction ● Primer design | ●Nucleic acid extraction ● Primer/probe design | ● Nucelic acid extraction ● Primer design | ● Protein extraction ● Antibodies | N/A |
| Other materials required | ● Portable thermocycler | ● Conventional thermocycler | ● Colormetric stain ● Incubator | ● Plate reader ● Washing equipment | N/A |
Table 1. Comparative chart of molecular and serological detection methods for phytopathogens
| Primer | Sequence (5′–3′)a | Targetb | |
| SsTQ-F13 | CCGGCAGACCCAAAACC | ITS1-ITS2 in S. subterranea | |
| SsTQ-R13 | CGGGCGTCACCCTTCA | ITS1-ITS2 in S. subterranea | |
| SsTQ-P13 | [FAM]CAGACAATCGCACCCAGGTTCTCATG[TAM] | ITS1-ITS2 in S. subterranea | |
| Genesig S.subterranea primer/probe | N/A | Actin in S. subterranea | |
| SPO1014 | GGTCGGTCCATGGCTTGA | ITS in S. subterranea | |
| SPO1114 | GGCACGCCAATGGTTAGAGA | ITS in S. subterranea | |
| SPOPRO114 | [FAM]CCGGTGCGCGTCTCTGGCTT[TAM] | ITS in S. subterranea | |
| RsTqF119 | AAGAGTTTGGTTGTAGCTGGTCTATTT | ITS1-ITS2 in R. solani | |
| RsTqR119 | AATTCCCCAACTGTCTCACAAGTT | ITS1-ITS2 in R. solani | |
| RQP119 | [FAM]TTTAGGCATGTGCACACCTCCCTCTTTC[TAM] | ITS1-ITS2 in R. solani | |
| Genesig PMTV primer/probe | N/A | CP-RT in PMTV | |
| PMTV-D-F20 | AGAATTGRCATCGAAACAGCA | CP in PMTV | |
| PMTV-D-R20 | GTCGCGCTCCAATTTCGTT | CP in PMTV | |
| PMTV-D-P20 | [FAM]CCACAAACAGACAGGTATGGTCCGGAA[TAM] | CP in PMTV | |
| a Oligo DNA primers were modified with FAM (6-carboxyfluorescein) or TAM (5-carboxytetramethylrhodamine) | |||
| b ITS: Internal transcribed spacers, CP: coat protein; CP-RT: coat protein readthrough | |||
Table 2. Primers used in this study
Supplementary Figure 1. Comparison of the DNA extraction methods for the detection of the powdery scab pathogen. Six different DNA extraction methods (A-F) were compared for the detection of the powdery scab pathogen, S. subterranea in soil samples. (B, D, F). DNA was extracted using silica-based kit #1 (see the Table of Materials for all kit names), silica-based kit #2, and magnetic bead-based kit, repsectively. PCR was performed using the conventional lab-based PCR thermocycler. Standard curves represent the relationship between the amount of total DNA extracted from the soil samples and the amounts of PCR product amplified by the SsTQ primers/probe set. Please click here to download this figure.
Supplementary Figure 2. Comparison of the limit of detection between a portable PCR and a conventional lab-based PCR. Total DNA was isolated from a soil sample using three different extraction methods: (A, B) Doyle method, (C, D) the silica-based kit #2, and (E, F) the magnetic bead-based kit. Graphs shown on the left are data using the portable thermocycler with the Sss primers/probe set, while the graphs on the right represent data generated using the conventional lab-based thermocycler with the SsTQ primers/probe set. Please click here to download this figure.
Discussion
As shown in Table 1, recent technological advances in the molecular identification of pathogenic agents have increased the efficacy, accuracy, and speed of diagnosis, which have contributed to the detection of pre-symptomatic infections27. Regarding on-site diagnosis, LAMP and lateral-flow methods are frequently used because they are portable and provide immediate results at a lower cost. However, in the case of serological methods, species-specific detection can be hard to achieve. This occasionally causes misdetection of off-target microbes such as common soil inhabitants. For example, there can be cross reactivity between the serological tests of Phytophthora spp. and Pythium spp. in the case of potato pathogens28, indicating that there are sometimes difficulties detecting the targeted plant pathogens.
In the present study, we have developed an optimized protocol for on-site molecular detection of soil-borne potato pathogens using the portable real-time PCR system by comparing its capabilities with that of a conventional lab-based real-time PCR system. We found that the on-site method specifically detects the potato pathogens in the soil sample, although sensitivity is ~10 times lower than that of an equivalent lab-based assay. It is also worth considering that in this case both the laboratory and field test did not use a biologically relevant sample size. Large sample sizes are required for use in routinely screening field soils as previously described29,30, where sample sizes of between 250 g to 1 kg are processed, although these methods require skilled operators and sophisticated equipment to extract DNA. Typically, a large-scale soil DNA extract is taken from a single aggregate soil sample representative of numerous subsamples over 1 to 4 hectares6,29,30. However, the protocol developed here is quick, easy-to-use for users with no prior experience in molecular diagnostics and can be used outside of a lab. As the method is rapid and relatively cheap compared to large-scale soil extraction, it could be used to screen many small-scale samples taken from a similar sampling area to large-scale aggregate samples. This could overcome some of the deficiencies of a small sample size and determine additional information on the spatial distribution of the pathogen in the field. In addition, the portability and speed of the method means that it can also be used in demonstration activities to growers for educational and engagement purposes.
Another consideration is that many real-time PCR assays are already published for a wide range of plant pathogens5. This system can make use of these existing assays without the need to design new LAMP primers to enable in field testing. A frequent criticism of LAMP assays is that they can be difficult to design31. Portable PCR, therefore, allows the relatively easy implementation of a wide range of readily available pathogen tests for on-site testing.
Traditional methods can be often costly, laborious, inaccurate, and time-consuming. The simplicity of the on-site method we developed allows growers and industry workers to perform pathogen detection by themselves and perhaps generate a result much quicker than sending to a diagnostic laboratory that could be some distance away. The promptness and sensitivity of the portable PCR method can help growers avoid potential secondary infections, which can further increase of the pathogen population and inadvertent spread (via equipment or humans). In conclusion, the on-site method developed in the present study enables accurate and relatively sensitive detection of important soil-borne pathogens in the field. Our hope is that the on-site method developed in this study will contribute in a current diagnostic pipeline (Figure 6), not only by providing quick and accurate answers to epidemiological questions about plant diseases in the field but also by providing increased understanding of the biology and epidemiology of plant pathogens.
Disclosures
The authors declare no competing financial interests.
Acknowledgements
We are grateful to Dr. Neil C. Gudmestad at North Dakota State University for providing S. subterranea plasmid DNA, Dr. Hanu Pappu at Washington State University (WSU) for providing PMTV RNA, and Dr. Debra Inglis at WSU for providing R. solani AG3. Special thanks to Dr. Jeremy Jewell at WSU for providing comments on the manuscript and WSU CAHNRS Communications for videography. This research was supported by the Northwest Potato Research Consortium and the Washington State Department of Agriculture - Specialty Crop Block Grant Program (grant no. K1764). PPNS No. 0741, Department of Plant Pathology, College of Agriculture, Human and Natural Resource Sciences, Agricultural Research Center, Hatch Project No. WNP00833, Washington State University, Pullman, WA, USA.
Materials
| Name | Company | Catalog Number | Comments |
|---|---|---|---|
| White shell PCR plate | Bio-Rad | HSP9601 | |
| CFX Manager | Bio-Rad | 1845000 | |
| SsoAdvanced Universal Probes Supermix | Bio-Rad | 1725280 | |
| CFX96 Touch qPCR instrument | Bio-Rad | 1855195 | |
| Ethylalcohol, pure 200 proof | Decon Laboratories | 04-355-222 | |
| Ethylenediaminetetraacetic Acid (EDTA) | Fisher BioReagents | BP118-500 | |
| Phenol, Saturated | Fisher BioReagents | BP1750I-400 | |
| Tris(hydroxymethyl)aminomethane (Tris) | Fisher BioReagents | BP152-5 | |
| q16 real-time PCR machine | genesig | MBS486001 | |
| Ultrapure Sodium Dodecyl Sulfate (SDS) | Invitrogen | 15525-017 | |
| 2-Propanol (Isopropanol) | JT Baker | 67-63-0 | |
| Chloroform | JT Baker | 9180-03 | |
| Hydrochloric Acid, 36.5-38.0% (HCl) | JT Baker | 9535-03 | |
| iso-Amyl Alcohol | JT Baker | 9038-01 | |
| FastDNA Spin kit | MP Biomedicals | 6560-200 | Silica-based DNA extraction kit #1 |
| Luna Universal One-Step RT-qPCR Kit | New England Biolabs | E3005S | |
| 0.1ml Low Profile Individual PCR Tubes | Phenix Research | MPC-100LP | |
| Easy DNA/RNA Extraction Kit | Primerdesign | genesigEASY-EK | |
| genesig Easy 1.5 mL tubes | Primerdesign | genesigEASY-1.5 | |
| Magnetic tube rack | Primerdesign | genesigEASY-MR | |
| Spongospora subterranea f. sp. subterranea genesig Easy Kit | Primerdesign | Path-S.subterranea-EASY | |
| Hexadecyltrimethylammonium bromide (CTAB) | Sigma-Aldrich | H6269-100G | |
| Pellet pestles | Thermo Fisher Scientific | 12-141-364 | |
| Sodium chloride (NaCl) | Thermo Fisher Scientific | 7647-14-5 | |
| DNA Miniprep kit | ZymoBIOMICS | D4300 | Silica-based DNA extraction kit #2 |
References
- Malcolm, G. M., Kuldau, G. A., Gugino, B. K., Jiménez-Gasco, M. delM. Hidden Host Plant Associations of Soil-borne Fungal Pathogens: An Ecological Perspective. Phytopathology. 103 (6), 538-544 (2013).
- Posthuma-Trumpie, G. A., Korf, J., van Amerongen, A. Lateral flow (immuno)assay: its strengths, weaknesses, opportunities and threats. A literature survey. Anal Bioanal Chem. 393 (2), 569-582 (2009).
- Hill, J., et al. Loop-Mediated Isothermal Amplification Assay for Rapid Detection of Common Strains of Escherichia coli. J Clin Microbiol. 46 (8), 2800-2804 (2008).
- Mumford, R. A., Walsh, K., Barker, I., Boonham, N. Detection of Potato mop top virus and Tobacco rattle virus Using a Multiplex Real-Time Fluorescent Reverse-Transcription Polymerase Chain Reaction Assay. Phytopathology. 90 (5), 448-453 (2000).
- Schena, L., Nigro, F., Ippolito, A., Gallitelli, D. Real-time quantitative PCR: a new technology to detect and study phytopathogenic and antagonistic fungi. European Journal of Plant Pathology. 110 (9), 893-908 (2004).
- Brierley, J. L., Stewart, J. A., Lees, A. K. Quantifying potato pathogen DNA in soil. Applied Soil Ecology. 41 (2), 234-238 (2009).
- Tomlinson, J. A., Boonham, N., Hughes, K. J. D., Griffin, R. L., Barker, I. On-Site DNA Extraction and Real-Time PCR for Detection of Phytophthora ramorum in the Field. Appl Environ Microbiol. 71 (11), 6702-6710 (2005).
- Harrison, J. G., Searle, R. J., Williams, N. A. Powdery scab disease of potato - a review. Plant Pathology. 46 (1), 1-25 (1997).
- Johnson, D. A., Miliczky, E. R. Distribution and development of black dot, Verticillium wilt, and powdery scab on Russet Burbank potatoes in Washington State. Plant Disease. 77 (1), 74-79 (1993).
- Merz, U. Powdery Scab of Potato-Occurrence, Life Cycle and Epidemiology. Am J Pot Res. 85 (4), 241(2008).
- Jones, R. aC., Harrison, B. D. The behaviour of potato mop-top virus in soil, and evidence for its transmission by Spongospora subterranea (Wallr). Lagerh. Annals of Applied Biology. 63 (1), 1-17 (1969).
- Carnegie, S. F., Davey, T., Saddler, G. S. Effect of temperature on the transmission of Potato mop-top virus from seed tuber and by its vector, Spongospora subterranea. Plant Pathology. 59 (1), 22-30 (2010).
- Woodhall, J. W., Adams, I. P., Peters, J. C., Harper, G., Boonham, N. A new quantitative real-time PCR assay for Rhizoctonia solani AG3-PT and the detection of AGs of Rhizoctonia solani associated with potato in soil and tuber samples in Great Britain. Eur J Plant Pathol. 136 (2), 273-280 (2013).
- Banville, G. J. Yield losses and damage to potato plants caused by Rhizoctonia solani Kuhn. American Potato Journal. 66 (12), 821-834 (1989).
- Crosslin, J. M. First Report of Potato mop-top virus on Potatoes in Washington State. Plant Disease. 95 (11), 1483-1483 (2011).
- Whitworth, J. L., Crosslin, J. M. Detection of Potato mop top virus (Furovirus) on potato in southeast Idaho. Plant Disease. 97 (1), 149-149 (2012).
- Kaur, N., Cating, R. A., Dung, J. K. S., Frost, K. E., Robinson, B. A., Hamm, P. B. First Report of Potato mop-top virus Infecting Potato in Oregon. Plant Disease. 100 (11), 2337(2016).
- Doyle, J. J. Isolation of plant DNA from fresh tissue. Focus. 12, 13-15 (1990).
- Dellaporta, S. L., Wood, J., Hicks, J. B. A plant DNA minipreparation: Version II. Plant Mol Biol Rep. 1 (4), 19-21 (1983).
- Edwards, K., Johnstone, C., Thompson, C. A simple and rapid method for the preparation of plant genomic DNA for PCR analysis. Nucleic Acids Research. 19 (6), 1349(1991).
- Bittara, F. G., Secor, G. A., Gudmestad, N. C. Chloropicrin Soil Fumigation Reduces Spongospora subterranea Soil Inoculum Levels but Does Not Control Powdery Scab Disease on Roots and Tubers of Potato. Am J Potato Res. 94 (2), 129-147 (2017).
- van de Graaf, P., Lees, A. K., Cullen, D. W., Duncan, J. M. Detection and Quantification of Spongospora subterranea in Soil, Water and Plant Tissue Samples Using Real-Time PCR. European Journal of Plant Pathology. 109 (6), 589-597 (2003).
- Maldonado, H., Falloon, R. E., Butler, R. C., Conner, A. J. Spongospora subterranea root infection assessed in two potato cultivars differing in susceptibility to tuber powdery scab. Plant Pathology. 62 (5), 1089-1096 (2013).
- Braid, M. D., Daniels, L. M., Kitts, C. L. Removal of PCR inhibitors from soil DNA by chemical flocculation. Journal of Microbiological Methods. 52 (3), 389-393 (2003).
- Lees, A. K., Cullen, D. W., Sullivan, L., Nicolson, M. J. Development of conventional and quantitative real-time PCR assays for the detection and identification of Rhizoctonia solani AG-3 in potato and soil. Plant Pathology. 51 (3), 293-302 (2002).
- Davey, T., Carnegie, S. F., Saddler, G. S., Mitchell, W. J. The importance of the infected seed tuber and soil inoculum in transmitting Potato mop-top virus to potato plants. Plant Pathol. 63 (1), 88-97 (2014).
- Boonham, N., et al. Methods in virus diagnostics: From ELISA to next generation sequencing. Virus Research. 186, 20-31 (2014).
- Mohan, S. B. Cross-reactivity of antiserum raised against Phytophthora fragariae with other Phytophthora species and its evaluation as a genus-detecting antiserum. Plant Pathology. 38 (3), 352-363 (1989).
- Ophel-Keller, K., McKay, A., Hartley, D., Curran Herdina, J. Development of a routine DNA-based testing service for soil-borne diseases in Australia. Austral Plant Pathol. 37 (3), 243-253 (2008).
- Woodhall, J. W., et al. A new large-scale soil DNA extraction procedure and real-time PCR assay for the detection of Sclerotium cepivorum in soil. Eur J Plant Pathol. 134 (3), 467-473 (2012).
- Miles, T. D., Martin, F. N., Coffey, M. D. Development of Rapid Isothermal Amplification Assays for Detection of Phytophthora spp in Plant Tissue. Phytopathology. 105 (2), 265-278 (2014).
- Notomi, T., et al. Loop-mediated isothermal amplification of DNA. Nucleic Acids Res. 28 (12), e63-e63 (2000).
- Narayanasamy, P. Microbial Plant Pathogens: Detection and Management in Seeds and Propagules. , John Wiley & Sons. (2016).
- Braun-Kiewnick, A., Altenbach, D., Oberhänsli, T., Bitterlin, W., Duffy, B. A rapid lateral-flow immunoassay for phytosanitary detection of Erwinia amylovora and on-site fire blight diagnosis. Journal of Microbiological Methods. 87 (1), 1-9 (2011).
Reprints and Permissions
