Drosophila flight muscle is a powerful model to study transcriptional regulation, alternative splicing, metabolism, and mechanobiology. We present a protocol for dissection of fluorescent-labeled flight muscle from live pupae to generate highly enriched samples ideal for proteomics and deep-sequencing. These samples can offer important mechanistic insights into diverse aspects of muscle development.
Method Article
Dissection of Drosophila melanogaster Flight Muscles for Omics Approaches
* These authors contributed equally
In This Article
Summary
Abstract
Drosophila flight muscle is a powerful model to study diverse processes such as transcriptional regulation, alternative splicing, metabolism, and mechanobiology, which all influence muscle development and myofibrillogenesis. Omics data, such as those generated by mass spectrometry or deep sequencing, can provide important mechanistic insights into these biological processes. For such approaches, it is beneficial to analyze tissue-specific samples to increase both selectivity and specificity of the omics fingerprints. Here we present a protocol for dissection of fluorescent-labeled flight muscle from live pupae to generate highly enriched muscle samples for omics applications. We first describe how to dissect flight muscles at early pupal stages (<48 h after puparium formation [APF]), when the muscles are discernable by green fluorescent protein (GFP) labeling. We then describe how to dissect muscles from late pupae (>48 h APF) or adults, when muscles are distinguishable under a dissecting microscope. The accompanying video protocol will make these technically demanding dissections more widely accessible to the muscle and Drosophila research communities. For RNA applications, we assay the quantity and quality of RNA that can be isolated at different time points and with different approaches. We further show that Bruno1 (Bru1) is necessary for a temporal shift in myosin heavy chain (Mhc) splicing, demonstrating that dissected muscles can be used for mRNA-Seq, mass spectrometry, and reverse transcription polymerase chain reaction (RT-PCR) applications. This dissection protocol will help promote tissue-specific omics analyses and can be generally applied to study multiple biological aspects of myogenesis.
Introduction
Modern omics technologies provide important insights into muscle development and the mechanisms underlying human muscle disorders. For example, analysis of transcriptomics data combined with genetic and biochemical verification in animal models has revealed that loss of the splicing factor RBM20 causes dilated cardiomyopathy due to its regulation of a target network of more than 30 sarcomere genes previously associated with heart disease, including titin1,2,3.
In a second example, studies from cell culture, animal models, and human patients have shown that myotonic dystrophy is caused by a disruption in RNA regulation due to sequestration of Muscleblind (MBNL) and upregulation of CELF14,5. The cross-regulatory and temporal dynamics between MBNL and CELF1 (also called CUGBP1 or Bruno-Like 2) help to explain the persistent embryonic splicing patterns in myotonic dystrophy patients. Additionally, the large network of misregulated targets helps to explain the complex nature of the disease4,6,7,8. A majority of such studies utilize omics approaches in genetic model organisms to understand the mechanisms underlying human muscle disease. Furthermore, they highlight the importance of first understanding temporal and tissue-type specific gene expression, protein modification, and metabolic patterns in healthy muscle to understand alterations in diseased or aging muscle.
Drosophila melanogaster is another well-established genetic model organism. The structure of the sarcomere as well as individual sarcomere components are highly conserved from flies to vertebrates4,9,10, and the indirect flight muscles (IFMs) have become a powerful model to study multiple aspects of muscle development11,12. First, the fibrillar flight muscles are functionally and morphologically distinct from tubular body muscles11,13, allowing investigation of muscle-type specific developmental mechanisms. Transcription factors including Spalt major (Salm)14, Extradenticle (Exd), and Homothorax (Hth)15 have been identified as fibrillar fate regulators. Additionally, downstream of Salm, the CELF1 homolog Bruno1 (Bru1, Aret) directs a fibrillar-specific splicing program16,17.
Second, IFMs are an important model for understanding the process of myogenesis itself, from myoblast fusion and myotube attachment to myofibrillogenesis and sarcomere maturation9,18,19. Third, Drosophila genetics permits investigation of contributions by individual proteins, protein domains, and protein isoforms to sarcomere formation, function, and biophysical properties20,21,22,23. Lastly, IFM models have been developed for the study of multiple human muscle disorders, such as myotonic dystrophy, myofibrillar myopathies, muscle degenerative disorders, actinopathies, etc.24,25,26,27, and have provided important insights into disease mechanisms and potential therapies28,29,30. Thus, Drosophila is a useful model to address many open questions in the myogenesis field, including mechanisms of muscle-type specific transcription, splicing, and chromatin regulation, as well as to the role of metabolism in muscle development. The application of modern omics technologies, in particular in combination with the wide variety of genetic, biochemical and cell biological assays available in Drosophila, has the potential to dramatically advance the understanding of muscle development, aging, and disease.
IFMs are the largest muscles in the fly, spanning nearly 1 mm across the entire length of the thorax in adults31,32. However, this small size generates the challenge of obtaining enough sample to apply omics technologies in Drosophila in a tissue-type specific manner. Moreover, IFMs are part of the adult musculature that is formed during pupal stages. Myoblasts fuse to form myotubes, which attach to tendons around 24 h after puparium formation (APF) and undergo a compaction step necessary to initiate myofibrillogenesis around 30 h APF (Figure 1A-D)18,33,34.
The myofibers then grow to span the entire length of the thorax, with myofibrils undergoing an initial growth phase focused on sarcomere addition until about 48 h APF, and then transitioning to a maturation phase, in which sarcomeres grow in length and width and are remodeled to establish stretch-activation by 72 h APF (Figure 1A-D)32,35. The onset of fiber maturation is at least partially controlled by Salm and E2F32,36,37, and multiple IFM-specific sarcomere protein isoforms whose splicing is controlled by Bru1 are incorporated during this phase16,17. Mature flies eclose from 90–100 h APF. This means that to study muscle development, IFM has to be isolated with sufficient quantity, quality, and purity from multiple pupal timepoints to facilitate analysis using omics approaches.
Several protocols for IFM dissection have been published. While these protocols work well for their intended applications, none are ideal for omics approaches. Protocols that preserve IFM morphology for immunofluorescence of pupal and adult IFMs19, isolate IFM fibers for mechanical evaluation31, or utilize microdissection of pupal IFM from cryosections38 are too specialized and time and labor intensive to reasonably obtain sufficient amounts of IFM tissue for omics applications. Other protocols have been developed for rapid dissection of specifically adult IFM38,39, thus are not applicable to pupal stages, and use buffers that are not ideal or may be incompatible with, for example, RNA isolation. Thus, there is a need to develop new approaches to isolate pupal IFM for biochemistry or omics applications.
Here we present a protocol for the dissection of IFM during pupal stages that has been used successfully for mRNA-Seq analysis from 16 h APF through adult stages16,32. The protocol employs a green fluorescent protein (GFP) label to identify IFMs at all stages of pupal and adult development, allowing live dissection under a fluorescent dissecting microscope. The approach is less labor-intensive, with a higher throughput than existing IFM dissection protocols. This allows rapid isolation and cryopreservation of samples, generating enough material after several rounds of dissection for omics approaches as well as for standard reverse transcription polymerase chain reaction (RT-PCR) or western blotting.
We present the protocol in two parts, demonstrating how to rapidly dissect IFMs both before 48 h APF (during early metamorphosis, when IFM attachments are more tenuous) and after 48 h APF (when the pupal body plan and IFM attachments are well-defined). We demonstrate that we can isolate high quality RNA from dissected IFMs at all timepoints and present data on different approaches to RNA isolation and reverse transcription. Lastly, we demonstrate the application of the dissection protocol to mRNA-Seq, mass spectrometry, and RT-PCR using the CELF1 homolog Bruno1 as an example. We show misexpression of sarcomere protein isoforms in proteomics data from Bruno1 mutant IFM and examine Bruno1 regulation of the C-terminal splice event of Myosin heavy chain (Mhc). These results illustrate how omics data can provide a deeper understanding of biological phenomena, complementing genetic and biochemical experiments.
Protocol
1. Staging the Pupae
- Raise flies of the desired genotype in bottles (Figure 1E). Either make a fresh flip of the dissection stock or set a cross with at least 20 female virgin flies. Maintain bottles until the flies begin to pupate.
- Collect pre-pupae with a wetted paintbrush and transfer to wetted filter paper in a 60 mm Petri dish (Figure 1F).
- Sex the pupae, collecting the appropriate gender for the experiment (Figure 1G). Males are identified by the presence of testes, which appear as translucent balls in the otherwise opaque pupa.
- Label the Petri dish with the time, date, and genotype, then age the pupae to the desired stage (Figure 1H).
NOTE: Maintain crosses/stocks and age pupae in a temperature-controlled incubator (i.e., 25 °C or 27 °C for RNAi crosses, as increased Gal4 activity at higher temperatures increases knock-down efficiency40). Ensure that the humidity is sufficiently high so pupae do not dry out when aging several days.
2. IFM Dissection Before 48 h APF
- Assemble the necessary equipment including two #5 biology grade forceps, a pipette, pipette tips, dry ice, and (for RNA samples) isolation reagent (see Table of Materials). In addition, chill black dissecting dishes (see Table of Materials), 1x phosphate-buffered saline (PBS) buffer, and 1.5 mL microcentrifuge tubes on ice.
- Using a wetted paintbrush, transfer staged pupae to a black dissecting dish filled about two-thirds with cold 1x PBS (Figure 2A,B). Move to a fluorescent dissecting microscope.
NOTE: Use as many pupae as can be dissected within a 30 min time window. Depending on experience, this ranges from 3–15 pupae. See Supplemental Methods for discussion of alternatives to black dissecting dishes. - Using #5 forceps, push one of the pupae to the bottom of a black dissecting dish and adjust the microscope zoom and focus to clearly see the pupa (Figure 2C).
- Grasp the anterior of the pupa with one forceps (Figure 2D), then poke the pupae with a single tip of the other forceps slightly off-center in the abdomen, just behind the thorax. This holds the pupa in place and prevents the IFMs from moving into the abdomen (Figure 2E).
NOTE: Begin timing the length of dissection from this point, as soon as pupal integrity is disrupted. Use a defined length of dissection (for example 20–30 min) to minimize muscle death and associated transcriptomic and proteomic changes. Dissect as many flies as possible in this period of time. - Using the first forceps, remove the anterior half of the pupal case (Figure 2F).
- Use the same forceps to pinch the exposed pupae just behind the thorax, and separate the abdomen from the thorax (Figure 2G).
- Using the forceps, gently squeeze the anterior part of the thorax (for <35 h APF) or rip open the thorax to expose the fluorescently labeled IFMs (Figure 2H). IFMs will easily detach from the epidermis, as tendon attachments at early timepoints are fragile. Discard the remaining carcass using forceps to push it to the opposite side of the dish.
- Repeating steps 2.3–2.7, dissect additional pupae.
- Collect the IFM fibers with forceps and organize them into a pile at the bottom of the black dissecting dish (Figure 2I,J). Remove any debris by pushing it out of the field of view using forceps.
NOTE: With practice, forceps tips can be brought into close proximity without touching each other. This technique can be used to loosely grab IFMs without destroying them. Alternate methods include gently pushing or lifting the IFMs with a single tip or completely closed forceps, or taking some fat or other tissue with the IFM and removing the fat as described in step 2.10. - Quality control the IFM muscle sample, using the forceps to remove non-IFM muscles, fat, cuticle, etc. from the sample (Figure 2K,L).
NOTE: With Mef2-Gal4, IFM is labeled more strongly than other muscle types at early timepoints (Figure 2K,K'), allowing removal of jump muscle and larval muscles based on fluorescence intensity and muscle shape. Fat and cuticle tissue look different and are not labeled by a muscle-specific fluorescence label (Figure 2K,K'). See the discussion section for other Gal4 lines that label IFM. - Using a clipped pipette tip, transfer the pile of IFMs into a 1.5 mL microcentrifuge tube filled with 250 μL of chilled 1x PBS (Figure 2M-O). Proceed immediately to section 4.
NOTE: IFM samples may be lost simply by sticking to the side of the pipette tip. Pipetting buffer up and down several times before collecting IFMs can make standard tips less sticky, and siliconized or perfluoroalkoxy (PFA) tips (see Table of Materials) with lower surface tensions can help prevent sample loss.
3. IFM Dissection After 48 h APF
- Assemble necessary equipment including two #5 biology grade forceps, fine scissors, standard glass microscope slides, double-stick tape, pipette, pipette tips, dry ice, and (for RNA applications) isolation reagent (see Table of Materials). Chill the 1x PBS and microcentrifuge tubes on ice.
- Using a lightly wetted paintbrush, transfer the staged pupae to a strip of double-sided sticky tape mounted on a microscope slide (Figure 3A). Place the pupae in a line oriented in the same orientation (ventral down and anterior towards the bottom of the slide).
NOTE: Be careful not to use too much water on the paintbrush or filter, or the pupae will not stick well. If pupae do not stick, dry them by first transferring to a dry filter or tissue paper. Mount as many pupae as can be dissected within a 30 min time window, ideally ~10 pupae. - Remove the pupa from the pupal case. Use forceps to tease apart and open the pupal case above the anterior spiracles (Figure 3B).
- Gently slide a pair of forceps dorsally towards the posterior, cutting the pupal case as the forceps move (Figure 3B'). Be careful not to rupture the underlying pupa. Liberate the pupa from the opened case and immediately transfer it to a drop of 1x PBS on a second microscope slide (Figure 3B",C).
- Repeat steps 3.3 and 3.4 for all pupae in the line, then set the double-stick tape slide aside.
- Using the fine scissors, cut the abdomen of the pupa away from the thorax and push it into a separate pile (Figure 3D,D'). Repeat for the remaining pupae.
NOTE: Begin timing the length of dissection with step 3.6, as soon as pupal integrity is disrupted. Dissect as many flies as possible in 20–30 min to prevent cell death and associated transcriptomic and proteomic changes. When dissecting 1 d adults or >90 h pupae, it is often convenient for later steps to additionally remove the head with the fine scissors. - Using a tissue paper, remove the majority of the 1x PBS (generally cloudy with suspended fat) as well as the pile of abdomens (Figure 3E). Add a drop of fresh, chilled 1x PBS to the remaining thoraxes.
- Use the scissors to cut the thorax in half (Figure 3F,F') by cutting from the head down the longitudinal body axis in a single motion. Alternately, if the head has been removed, first insert the scissors where the head was attached and cut the top half of the thorax longitudinally between the IFMs. Then, cut the ventral side of the thorax with a second cut in the same orientation.
- Repeat steps 3.7 and 3.8 for all pupae to be dissected, generating a pile of thorax hemisections near the center of the slide. Ensure there is enough chilled 1x PBS on the slide so that the hemisections do not dry out.
NOTE: After 48 h APF, IFMs are large enough to be visible under a standard dissecting microscope to the trained eye. At this point in the protocol, muscles with a fluorescent label can be moved to a fluorescent dissecting scope to aid in IFM identification or for training purposes, but this is not necessary. - Dissect the IFMs out of the thorax. Isolate one of the hemisections using the #5 forceps (Figure 3G,H). Gently insert the tips of one forceps above and below the middle of the IFMs (Figure 3G',H'). While holding the first forceps still, use fine scissors to cut one end of the IFM away from the cuticle and tendons. Then, cut the other end of the IFM free from the cuticle (Figure 3G'',H'').
NOTE: Depending on the orientation of the thorax after the first IFM cut, it is useful to rotate the thorax 180° so that the second IFM cut is easier to perform. - Remove the IFM bundle from the thorax with forceps (Figure 3G''',H'''), transferring it to the edge of the PBS bubble to use water tension to hold it in place (Figure 3I). Push the carcass to the opposite side of the slide. Repeat for the remaining thorax hemisections, generating a collection of dissected IFMs.
NOTE: If the IFMs do not stay in a neat pile, remove some of the 1x PBS with a tissue. Be careful not to let all of the PBS evaporate, and ensure that the dissected IFMs and hemithoraxes remain covered by buffer. - After dissecting all IFMs, quickly perform a quality control on the dissected muscle. Using #5 forceps, remove any jump muscle or cuticle fragments that may have found their way into the sample (Figure 3J-K'').
NOTE: Jump muscle appears different from IFM. If dissecting Mef2-Gal4 labeled muscle under fluorescence, jump muscle has a weaker fluorescence and a different shape and texture. Under normal light, it appears nearly translucent while the IFMs are an opaque, milky yellow (Figure 3J-J'',K). - Using water tension, capture (but do not squish) the dissected IFMs between a pair of forceps (Figure 3L). Transfer the IFMs to a 1.5 mL microcentrifuge tube pre-filled with 250 μL of chilled 1x PBS (Figure 3M). Proceed immediately with section 4.
NOTE: When forceps tips are brought into proximity of each other and lifted out of a buffer solution, water tension causes a bubble of buffer to be captured between the forceps tips. If IFMs are also present in this bubble, they can be lifted out of the solution and easily transferred to another buffer-filled receptacle. It is important to squeeze the forceps to bring the tips near one another without touching each other, to avoid macerating the tissue captured in the buffer bubble.
4. Pellet and Preserve the IFM Sample
- Pellet the IFMs by centrifuging the 1.5 mL microcentrifuge tube for 3–5 min at 2,000 x g in a table-top centrifuge (Figure 4A,B).
- Remove the buffer using a pipette tip (Figure 4C).
- For RNA applications, resuspend the IFM pellet in 50–100 μL of the desired RNA isolation buffer (see Table of Materials, Figure 4D). Otherwise, proceed to step 4.4.
NOTE: IFMs can be dry-frozen after step 4.2 for mass spectrometry preparations or isolation of RNA with commercial kits (see representative results). For RNA applications, better results are obtained by immediately resuspending and freezing the IFM pellet in isolation buffer. - Freeze sample on dry ice or snap freeze in liquid nitrogen (Figure 4E). Store at -80 °C until ready for subsequent steps in sample preparation for downstream analysis.
NOTE: After cryopreservation, samples can be stored for several months before processing for downstream investigation.
Results
The dissection protocols presented above are useful to generate IFM-enriched samples from 16 h after puparium formation (APF) until the adult stage. Dissected flight muscle samples can be used for multiple applications, and have so far been successfully applied for RT-PCR4,17, RNA-Seq16,32, ChIP36,37, Western blotting14,41 and mass spectrometry experiments (see below). To help potential users dissecting for RNA-based applications, we first present our results highlighting important considerations specifically for isolation of RNA from IFMs. To more broadly demonstrate the utility of our dissection protocols, we then illustrate some of the possible –omics applications using our data on the RNA-binding protein Bruno1.
IFM dissection protocol yields high quality RNA
It is important to determine the number of flies to be dissected in advance, as coding mRNA is estimated to constitute only 1–5% of total RNA42. We obtained on average 24 ± 9 ng of total RNA per fly from IFM dissected from 1 d adults (Figure 4F and Supplemental Figure 1A), with yields typically increasing with experience. This yield of total RNA per fly is relatively constant, fluctuating around 25 ng for IFM dissected at 16 h APF, 24 h APF, 30 h APF, 48 h APF, 72 h APF and 90 h APF (Figure 4F and Supplemental Figure 1B,D,E). These observations also reflect any RNA isolated from contaminating fat, tendon, trachea or other cell types, which may be higher in samples isolated from earlier timepoints. Thus, we obtained >1 μg of total RNA from IFM from 50 flies and typically dissect IFM from 100−150 flies to generate >3 μg of total RNA for RNA-Seq samples.
The method of RNA isolation affects the quantity and quality of recovered RNA, and we encourage users to validate their isolation approach. For example, while isolation using method 1 produces on average 1143 ± 465 ng of total RNA from IFM from 50 1 d adult flies, isolation with various commercial kits yields anywhere from 186 ± 8 ng to 1261 ± 355 ng of total RNA (Figure 4G and Supplemental Figure 1C). RNA isolated from commercial kits is generally of good quality (Figure 4H and Supplemental Figure 1F), but low recoveries suggest that RNA may not be efficiently eluted from the columns. RNA integrity can also be compromised by use of a kit as done in method 2 (Figure 4H, second plot), likely due to buffer constitution and heat treatments, leading to severe fragmentation that can impact downstream experiments.
It is also important to observe proper RNase-free technique when isolating and handling RNA samples. Although freeze-thaw cycles and a 4 h room temperature incubation do not dramatically impact RNA integrity profiles, even small amounts of RNase lead to rapid RNA degradation (Figure 4I and Supplemental Methods). Users are still encouraged to work on ice and limit freeze-thaw to prevent RNA hydrolysis and fragmentation. This was not detected here but preventing RNase contamination by using filter tips and DEPC-treated buffers is absolutely essential.
The efficiency of reverse transcription also impacts the success of downstream applications. We obtained reliable results with two of three commercial RT kits we tested, which both amplify strong RT-PCR bands for ribosomal gene rp49 (Figure 4J). However, RT Kit #2 may be more sensitive for the detection of low-expressed transcripts, as we obtained stronger bands for the RNA-binding protein bru1 for all three biological replicates (Figure 4J). Taken together, these results illustrate that high-quality RNA can be isolated from IFMs dissected with this procedure.
Dissected IFMs produce high quality mRNA-Seq and proteomics data
Using IFM dissected according to the above protocol at 30 h APF, 72 h APF and from 1 d adult flies, we previously showed that the RNA-binding protein and CELF1-homologue Bruno1 (Bru1, Arrest, Aret) controls an IFM-specific splicing pathway downstream of the transcription factor Spalt major (Salm)16. IFMs from null mutants as well as flies with muscle-specific bruno1 RNAi (bru1-IR) display sarcomere growth defects, misregulation of myosin activity and ultimately hypercontraction and loss of muscle fibers16,17. Below we demonstrate the utility of dissected IFMs for whole proteome mass spectrometry and show that several of the expression changes we observed on the RNA level are also evident on the protein level. We further highlight a specific developmental splice event in Mhc that was found to be regulated by Bruno1, illustrating that mRNA-Seq and RT-PCR from dissected IFMs can be used to demonstrate the regulation of alternative splice events.
Depending on library quality and depth, mRNA-Seq data can be analyzed on the level of gene units (averaging read counts over all exons of a gene), individual exons, or splice junctions. mRNA-Seq data from bru1-IR IFMs compared to wildtype shows weak changes in expression on the gene unit level16 (Figure 5A). At 72 h APF, there is already a trend for sarcomere genes such as muscle LIM protein at 60A [Mlp60A], actin 57B [Act57B], muscle-specific protein 300 kDa [Msp300], or Stretchin-Mlck [Strn-Mlck]) that are important for proper muscle development to be downregulated in bru1-IR muscle (Figure 5A and Supplemental Table 1). However, we have shown previously that on the level of individual exons, there is a much stronger downregulation of specific sarcomere gene isoforms16, suggesting the major function of Bruno1 is to control alternative splicing (Supplemental Table 1).
Using whole-proteome mass spectrometry on dissected IFMs, we can show similar regulation on the protein level (Figure 5B and Supplemental Table 2). Of the 1,895 peptide groups detected, 524 (28%) of them are misregulated in Bru1M2 mutant IFM in 1 d adults (Supplemental Table 2). Downregulation of both Strn-Mlck and Mlp60A protein is also observed, matching observations at the transcript level in our mRNA-Seq data. Despite the limited number of database peptides that map to specific protein isoforms (see Supplemental Methods for analysis details), for sarcomere proteins Tropomyosin 1 (Tm1), upheld (up/TnT), Mhc, bent (bt/projectin) and Paramyosin (Prm) we observe upregulation of peptides from one isoform and downregulation of another (Figure 5B), confirming our previous observations of similar regulation on the RNA level16. This demonstrates that dissected IFMs are useful for both mRNA-Seq and proteomics applications.
As a further example of how omics data can complement traditional approaches to enhance and extend biological insight, we chose to focus on splicing at the C-terminus of Mhc. A previously characterized protein trap line called weeP26 is inserted in the final intron of Mhc43,44 (see Supplemental Methods for exact location). weeP26 contains a strong splice acceptor and is incorporated into presumably all Mhc transcripts (Figure 5C). However, the GFP labeled protein in IFM is incorporated into two "dots" on either side of the M-line, while in leg muscle, it incorporates uniformly across the M-line and weakly across the thick filaments (Figure 5E). Orfanos and Sparrow showed these "dots" in IFM form due to a developmental Mhc isoform switch: the Mhc isoform expressed before 48 h APF is GFP-labeled as the weeP26 exon inserts in the open read frame, while the Mhc isoform expressed after 48 h APF is unlabeled, as the weeP26 exon is included downstream of the stop codon in the 3'-UTR44.
Our mRNA-Seq data allowed us to characterize C-terminal Mhc isoform expression in greater detail. While two different Mhc terminations have been reported43,44, our mRNA-Seq data and current Flybase annotation (FB2019_02) suggest that there are actually three possible alternative splice events at the Mhc C-terminus (Exon 34-35, 34-36, or 34-37) (Figure 5C), which is confirmed by RT-PCR (Figure 5D). weeP26 GFP is inserted in the intron between Exon 36 and 37; thus, as both Exon 34-35 and Exon 34-36 isoforms contain stop codons, GFP can only translated in the Exon 34-37 isoform (resulting in Exon 34-GFP-37). We further could see both temporal and spatial regulation of all Mhc isoforms. In IFM, we observe an Mhc isoform switch from Exon 34-37 to Exon 34-35 between 30 h APF and 48 h APF (Figure 5C,D,F) at 27 °C, even though this is not yet visible by immunofluorescence at 48 h APF (Figure 5E). Legs already express a mixture of Exon 34-37 and Exon 34-35 at 30 h APF, and by 72 h APF express all three Mhc isoforms (Figure 5D,F). Adult jump muscle (TDT) also expresses all three Mhc isoforms (Figure 5F), suggesting this is generally true for tubular somatic muscles. Thus, our mRNA-Seq data allow extension of previous findings by narrowing the timeframe for the Mhc isoform switch in IFM and characterizing Mhc isoform use in tubular muscles.
Mhc isoform regulation in salm and bru1 mutant IFM were then examined. In both cases, we saw misregulation of weeP26. Salm mutant IFMs fail to complete the developmental switch in Mhc isoform expression and phenocopy leg splicing patterns at later stages, including gain of the Exon 34-36 event (Figure 5F). This agrees with previous findings that loss of Salm results in a near-complete fate transformation of IFM to tubular muscle16. Bru1-IR and bru1 mutant IFM, similar to salm-/- IFM, retains the Exon 34-37 splice event through adult stages (Figure 5E,F), resulting in a weeP26 GFP labeling pattern resembling leg muscle, but it does not gain the Exon 34-36 event. This suggests that Bruno1 is necessary in IFM to at least partially control the developmental switch in Mhc alternative splicing, but it indicates that additional splicing factors are also misregulated in the salm-/- context. Furthermore, this example illustrates how RT-PCR and mRNA-Seq data from dissected IFM can be valuable in gaining a deeper understanding of developmental splicing mechanisms and observed morphological defects.
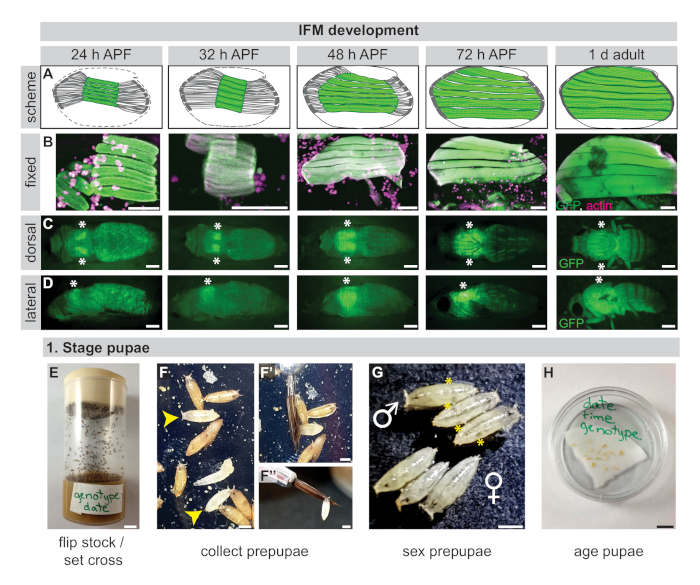
Figure 1: IFM development and staging of pupae. (A) Schematic of IFM development at 24 h APF, 32 h APF, 48 h APF, 72 h APF, and 1 d adults showing compaction of flight muscles (green) at ~32 h APF and subsequent fiber growth to fill the thorax. Tendons are in dark grey. (B) Confocal images of fixed IFMs from open book dissections (24 h, 32 h, 48 h)19 or thorax hemisections (72 h, 1 day) stained for actin (rhodamine phalloidin, magenta) and GFP (green). (C,D) Images of GFP fluorescence in live pupae illustrating intact IFM morphology of the dissection fly line in the dorsal (C) or lateral (D) plane. Asterisks mark IFM location. (E) To prepare for dissections, fly stocks should be flipped or crosses set 3–4 days in advance. (F) Prepupae are selected by their white color (yellow arrowheads) and isolated using a wetted paintbrush (F',F''). (G) Prepupae should be sexed to separate females from males based on the presence of testes which appear as posteriorly located translucent balls (yellow asterisks). (H) Pupae are aged on wetted filter paper in 60 mm dishes. Scale bars = 100 µm (B), 1 cm (C,D,E,H), 1 mm (F,F'',G). Please click here to view a larger version of this figure.
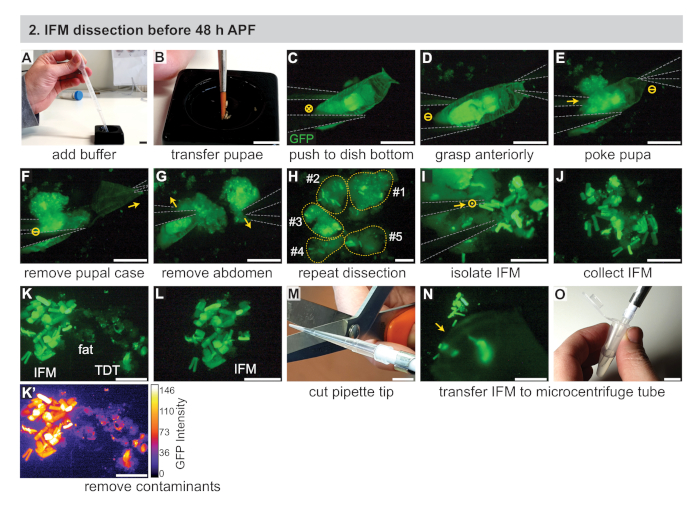
Figure 2: Dissection of IFMs before 48 h APF. (A) Addition of 1x PBS buffer to a black dissecting dish with a transfer pipette. (B) Transfer of staged pupae using a paintbrush. (C) Under a fluorescent dissecting microscope to visualize GFP, gentle pushing of the pupa to the bottom of a dissecting dish using #5 forceps (outlined in grey). The "X" in a circle denotes motion into the image. (D,E) Grasping of the pupae anteriorly (D), then poking of the pupae just behind the thorax (E). Dash in a circle denotes no motion. (F,G) Pulling with the anterior forceps (arrow) to remove the pupal case (F), then removal of the abdomen (G). (H) Repetition of C-G for several pupa. Yellow dotted lines are numbered denoting contributing pupae. (I, J) Use of the forceps (I) to isolate IFMs from surrounding tissue (J). Dot in a circle denotes motion out of the page. (K,L) Removal of contaminants including fat and jump (TDT) muscles (K) to generate a clean IFM sample (L). TDT has lower GFP expression and a different shape than IFM fibers (K'). (M,N,O) Use of a clipped pipette tip (M) to collect dissected IFMs (N) and its transfer to a microcentrifuge tube (O). Scale bars = 1 cm (A,B,M,O), 1 mm (C-G), 500 µm (H-L,N). Please click here to view a larger version of this figure.
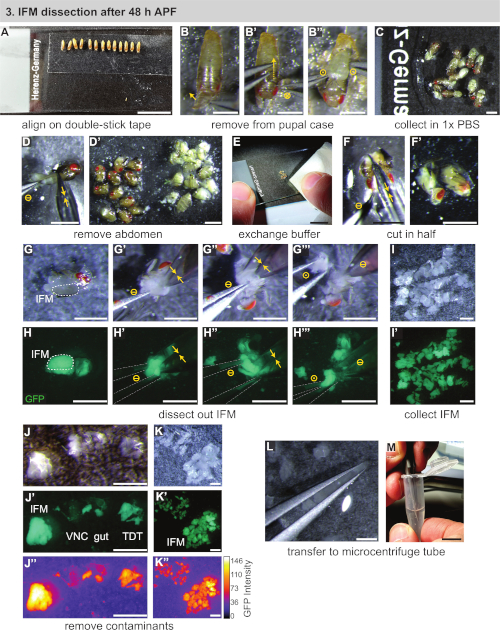
Figure 3: Dissection of IFMs after 48 h APF. (A) Aligning of pupae on double-stick tape. (B) Removal of pupae from the pupal case by opening anteriorly (B), cutting the case dorsally (B'), and lifting out the pupa (B''). Circle symbols represented the same as Figure 2. (C) Transfer of pupae to buffer. (D) Removal of the abdomen by cutting with scissors (yellow double arrows) and separation from thoraxes (D'). (E, F) Addition of clean buffer (E), then cutting of thoraxes in half longitudinally (F,F'). (G,H) Dissections can be performed under white light (G) or fluorescence to visualize the GFP (H); cutting of the IFMs on one side (G'), then the other side (G''); lifting out of the thorax with forceps (outlined in grey) (G'''). (I,J,K) Collection of IFMs in buffer (I) and removal of contaminating ventral nerve cord (VNC), gut, and jump muscle (TDT) (J) to generate a clean IFM sample (K). TDT has lower GFP expression and a different shape than IFM fibers (J'', K'). (L,M) Use of forceps to transfer IFMs (L) to a microcentrifuge tube (M). Scale bars = 1 cm (A,E,M), 1 mm (B-D',F-L). Please click here to view a larger version of this figure.
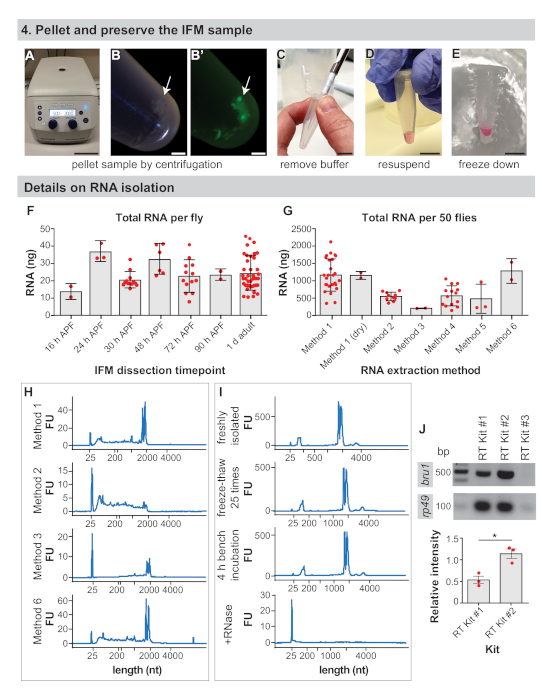
Figure 4: IFM preservation and RNA isolation details. (A) IFMs are pelleted by centrifugation for 5 min at 2000 x g. (B) IFM pellet (arrow) and pellet under fluorescence (B'). (C) Removal of all buffer with a pipette tip. (D) For RNA extraction, resuspension of pellet in isolation buffer. This step can be skipped to dry-freeze dissected IFMs. (E) Freezing of sample in liquid nitrogen or on dry ice and storage at -80 °C. Scale bars = 10 cm (A), 1 mm (B,B’), 1 cm (C,D,E). (F) Nanograms (ng) of total RNA from dissected IFM obtained per fly at 16 h APF, 24 h APF, 30 h APF, 48 h APF, 72 h APF, 90 h APF, and 1 d adult. Error bars = SD. (G) Total RNA isolated from IFM dissected from 50 1 d adult flies using different extraction methods. Error bars = SD. (H) Representative traces to assay RNA integrity after different extraction methods. The ribosomal bands run just below 2000 nucleotides (nt) and the marker band at 25 nt. Additional traces available in Supplemental Figure 1. (I) Representative traces of a freshly isolated RNA sample (top), a sample freeze-thawed 25x on dry ice (second plot), a sample left for 4 h on the bench (third plot), and a sample treated with RNase A (bottom plot). Note complete degradation of RNA upon addition of RNase A. (J) RT-PCR gel from kits as labeled for bru1 and rp49. The relative intensity of the bru1 band normalized against rp49 is plotted below. Error bars = SEM (unpaired t-test, p = 0.0119). Please click here to view a larger version of this figure.
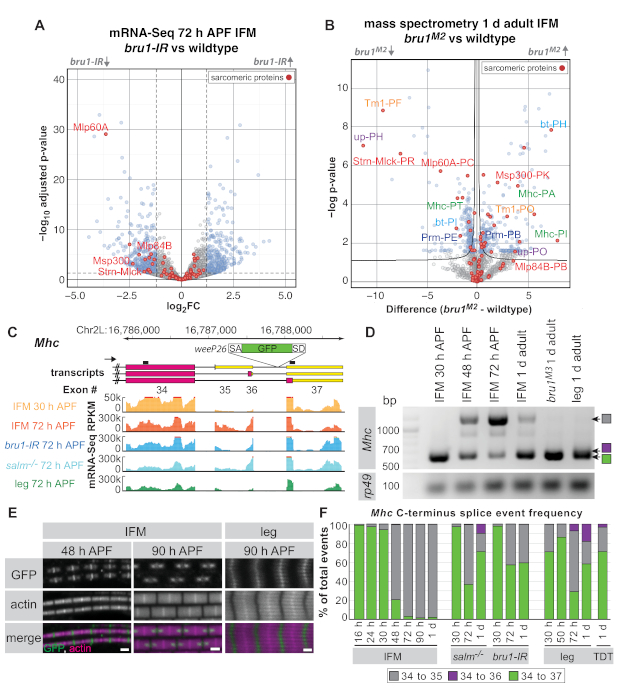
Figure 5: Application of IFM dissections to investigate Bruno1 function in alternative splicing. (A) Volcano plot of mRNA-Seq data (gene unit) from IFMs dissected at 72 h APF. Genes that are significantly differentially regulated between bru1-IR and wildtype IFM (padj < 0.05, abs(log2FC) >1.5) are shown in blue, and non-significant genes in grey. Sarcomere proteins are highlighted in red, and select genes are labeled. (B) Volcano plot of whole proteome mass spectrometry results from 1 d adult IFMs. Proteins significantly different between bruM2 mutants and wildtype (FDR < 0.05) are shown in blue, nonsignificant proteins in grey. Sarcomeric proteins are highlighted in red. Peptides corresponding to genes in (A) are labeled in red. Sets of peptides mapping to different isoforms of the same protein are labeled in the same color. (C) Scheme of the C-terminus of Mhc illustrating distinct transcript isoforms and insertion location of the weeP26 gene trap (see Supplemental Methods for insertion point). RT-PCR primers are denoted as black lines above transcripts. Read counts per kilobase per million bases (RPKM) from mRNA-Seq are shown for IFMs dissected from wildtype at 30 h APF (orange) and 72 h APF (red), from bru1-IR (blue) and salm-/- (cyan) at 72 h APF and from whole leg (green) at 72 h APF. (D) RT-PCR with primers against Mhc showing the isoform switch in IFM between 30 h APF and later timepoints. The Exon 34-35 splice event is only weakly observed in bruM3 mutant IFM or in the adult leg. (E) Confocal images of weeP26 GFP localization in wildtype IFM sarcomeres at 48 h APF and 90 h APF compared to 90 h APF leg muscle. Scale bars = 1 µm. (F) Splice junction quantification from mRNA-Seq data for genotypes and timepoints as labeled. Junction reads are presented as the ratio of a specific splice event (Exon 34 to 35 in grey, 34 to 36 in purple, and 34 to 37 in green) to the total number events sharing the exon 34 splice donor. Please click here to view a larger version of this figure.
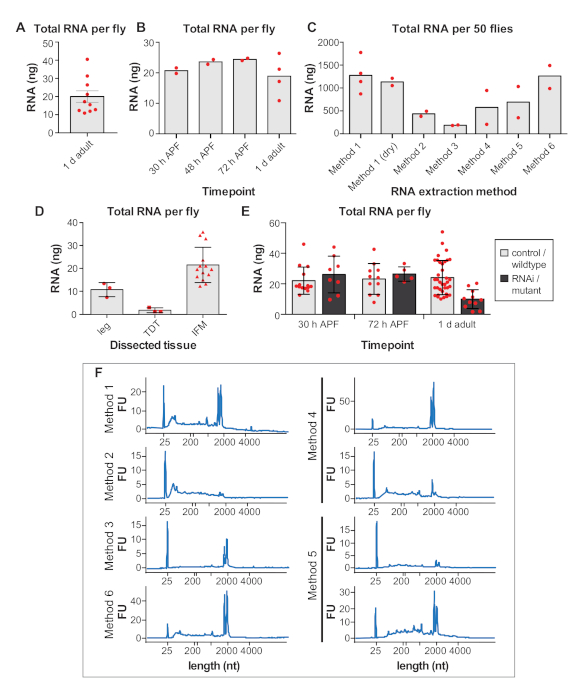
Supplemental Figure 1: (A,B,C) RNA yields from samples of the same genotype dissected by the same researcher in the same week. After all samples were dissected, RNA was isolated and measured the same day. (A) Nanograms (ng) of total RNA obtained from IFM dissections per 1 d adult fly. Error bars = SEM. (B) Total RNA obtained from dissected IFM per fly at 30 h APF, 48 h APF, 72 h APF and 1 d adult. (C) Total RNA isolated from IFM dissected from 50 1 d adult flies using different extraction methods. (D) Total RNA concentrations per fly from dissected legs, jump muscle (TDT) and IFM. More RNA is obtained from the larger IFMs. Error bars = SD. (E) Total RNA concentrations per fly of IFM dissected from controls compared to RNAi or mutant samples at 30 h APF, 72 h APF and 1 d adult. For mutants, w1118 was used as wildtype control. Mutant data are compiled from bru1-IR, salm-/- and another RNA-binding protein mutant. Note that for these manipulations, RNA yields are decreased in 1 d adult due to muscle atrophy and loss, so more flies need to be dissected to obtain sufficient quantities for omics approaches. Errors bars = SD. (F) Additional traces showing RNA integrity for the RNA isolation methods shown in Figure 4G and in Supplemental Figure 1C. Please click here to view a larger version of this figure.
Supplemental Methods: A detailed description of the methods and reagents used throughout the text and, in particular, to generate the data shown in Figure 1A-D, Figure 4F-K, Figure 5, Supplemental Table 1, and Supplementary Table 2. These data motivate the dissection protocol and demonstrate its utility for RNA isolation, mRNA-Seq, RT-PCR, and proteomics. Please click here to download this file.
| Related to Figure 5 and associated paragraphs in the main text | |
| Tab Name | Data Summary |
| Sarcomere Proteins | List of sarcomere genes from Spletter et al. Elife 2018; Here we list the current FBgn and gene name. |
| SP gene units_DESeq2_72h | Using data from Spletter et al. EMBO Rep 2015, we looked specifically at the sarcomere genes in the mRNA-Seq data at 72 h APF. This is from the DESeq2 analysis detecting differential expression on the gene unit level between control (Mef2-Gal4, UAS-GFM-Gma crossed to w1118) and Mef2-Gal4, UAS-GFM-Gma x Bruno1-IR. Rows highlighted in yellow are signficantly up or down regulated genes (above/below a threshold of log2FC=abs(1.5)). These data are the red dot overlay in Figure 5A. For each sarcomere gene, we provide identifier information, the log2FC from DESeq2, P value and adjusted P value, as well as DESeq2 normalized expression counts. |
| SP exon_DEXSeq_72h | Using data from Spletter et al. EMBO Rep 2015, we looked specifically at sarcomere gene exon use in the mRNA-Seq data at 72 h APF. This is from the DEXSeq analysis detecting differential exon use between control (Mef2-Gal4, UAS-GFM-Gma crossed to w1118) and Mef2-Gal4, UAS-GFM-Gma x Bruno1-IR. Rows highlighted in yellow are signficantly up or down regulated exons (above/below a threshold of log2FC=abs(1.5)). We provide exon and gene identifier information, the log2FC from DEXSeq, P value and adjusted P value, as well as a list of associated transcripts. |
| Please note that many genes show regulation of one or more exons in the DEXSeq analysis, often with high log2FC values and low P value/adjust P values, while a limited list of genes shows changes at 72 h APF. This supports a strong effect of loss of Bruno on the regulation of alternative splicing. | |
Supplemental Table 1: Table of 72 h APF mRNA-Seq data for sarcomere proteins identifying differentially expressed genes (via DESeq2) and exons (via DEXSeq) in bru1-IR vs. wildtype IFMs.
| Related to Figure 5B and associated paragraphs in the main text | |
| Tab Name | Data Summary |
| Perseus output | This is a processed data spreadsheet presenting the mass spectrometry data used to generate Figure 5B. IFM samples are from 1 d adult control (w1118) and mutant (bruno1-M2) flies. Important columns are the transformed intensity values for each of the 4 replicates for each sample, the t-test statistic and significance, peptide IDs and corresponding gene names and Flybase IDs. Signifance was calculated using standard settings in Perseus (FDR<.05). There are 1859 proteins/peptides detected, of which 524 (28%) are significantly different between the samples. |
| Downregulated | These are ALL the 252 proteins/peptides from the Perseus output that are downregulated in bruno1-M2 mutant IFM. As the Flybase IDs and gene names are outdated, we additionally provide the current Flybase gene ID and gene name. |
| Upregulated | These are ALL the 272 proteins/peptides from the Perseus output that are upregulated in bruno1-M2 mutant IFM. As the Flybase IDs and gene names are outdated, we additionally provide the current Flybase gene ID and gene name. |
| Please note that the sarcomere proteins highlighted in red in Figure 5B are present in the above lists. The list of genes considered part of the sarcomere is available in one of the tabs in Supplementary Table 1. | |
Supplemental Table 2: Table of whole proteome mass-spectrometry data from 1 d adult identifying differentially expressed proteins and protein isoforms in bruM2 mutant vs. wildtype IFMs.
Discussion
In this protocol, we present the basic technique to dissect Drosophila IFMs from early and late-stage pupae for downstream isolation of protein, DNA, RNA or other macromolecules. The protocol can be easily adapted to dissect IFM from adult flies. We demonstrate the utility of our dissection protocol for mRNA-Seq, proteomics and RT-PCR applications. With the continuous improvement of omics technologies to allow analysis of samples with less starting material and lower input concentrations, these dissections will likely become valuable for many additional applications. As IFMs are an established model for human myopathies4,24 and muscle-type specific development9,12, we envision, for example, IFM-enriched metabolomics, investigations of chromatin conformation via 3C or 4C, splicing network evaluation via CLiP interactions or phospho-proteomics of myofibrillogenesis.
It is important to consider that these dissections produce a sample enriched for IFM instead of a pure IFM sample. This is unavoidable due to motor neuron innervation, tendon attachments and tracheal invasion of muscle fibers. Bioinformatics analysis can be used to identify IFM enriched genes or proteins, but further experiments are required to demonstrate that they are in fact IFM-specific. Sample purity can be assayed using published tissue-specific markers such as Stripe45 (tendon), Act79B4,44 (tubular muscle), Act88F15 (IFM), or syb46 (neuronal specific). It may be possible to use such markers to normalize datasets to the IFM-specific content, but users are cautioned that temporal changes in expression of genes used for normalization, for example of IFM-specific genes or tubulin, may bias such an approach.
Genetically encoded tissue-specific labeling methods, for example EC-tagging47,48 or PABP-labeling49,50 for isolating RNA have been developed in recent years, which may help obtain a truly tissue-specific RNA sample. However, EC-tagging requires constant feeding of flies47 and thus is not applicable during pupal stages. The sensitivity and completeness of PABP-labeled transcriptomes may have limitations51. FACS approaches to isolate individual muscle fibers are complicated by the large size and syncytial nature of IFMs. INTACT52,53 style approaches may be applied to isolate specific subcellular-compartments from IFMs, which may prove useful for isolating pure populations of IFM nuclei or mitochondria. Manual dissections are still the current standard to obtain intact IFM tissue for most downstream applications.
Sample quality depends on several critical steps in the dissection process. The dissections are technically demanding, with dissection speed and sample purity increasing with experience. Dissecting for short periods of time (20–30 min) in chilled buffer without detergent and immediately freezing helps to preserve sample integrity, as has been observed previously for mouse tendon isolation54. IFMs can be successfully dry-frozen after removing all buffer from the pellet, but specifically for RNA isolation, freezing samples in isolation buffer tends to produce better results. IFMs from up to 20 separate dissections are combined prior to RNA or protein isolation, allowing scaling up and collecting enough material, even from early timepoints or mutants16,32, for downstream analysis.
For RNA applications, the most critical step may be the isolation of the RNA itself. Guanidinium thiocyanate-phenol-chloroform isolation (method 1 above) outperforms most commercial kits tested and, as previously noted, is considerably less expensive55. The variability observed in RNA isolation yields with commercial kits is in agreement with previous observations56,57. We further add glycogen during isopropanol precipitation to help recover all RNA. Beyond RNA yield, it is important to verify RNA integrity to ensure that the sample has not been fragmented or degraded during the dissection and isolation processes. It is also essential to work RNase-free. Lastly, the choice of RT-kit can impact the sensitivity of the reverse transcription process. While not often discussed in detail, all of these points influence the quality of the IFM sample and the data obtained from downstream applications.
Several important modifications set the protocol apart from existing IFM dissection protocols. Although a detailed dissection protocol for IFM immunofluorescence exists19, this protocol presents a different approach to pupal dissections that allows more rapid isolation of IFM tissue. This allows collection of large amounts of IFM tissue (relatively speaking) with limited dissection times to prevent proteome or transcriptome changes. Other protocols describe dissection of adult IFM for visualizing GFP staining in individual myofibrils39 or for staining of larval body-wall muscles58, but they do not address dissection at pupal stages or for isolation of RNA or protein. This approach is also distinct from the existing protocol for microdissection of pupal IFMs from cryosections38, which may generate a purer IFM sample but is more labor intensive and produces less material. As compared to other rapid adult IFM dissection protocols38,39, IFMs are isolated in PBS buffer without detergent to limit stress induction and other major expression changes.
The key advance in this protocol is the inclusion of a live, fluorescent reporter, allowing isolation of the IFMs at early pupal stages. We standardly use Mef2-GAL459 driving either UAS-CD8::GFP or UAS-GFP::Gma60. This allows differential labelling of IFM (flight muscles are more strongly labeled and differently shaped than other pupal muscles) as well as performance of GAL4-UAS-based manipulations, for instance rescue or RNAi experiments. It is also possible to combine Mef2-GAL4 with tub-GAL80ts to avoid RNAi-associated early lethality or with UAS-Dcr2 to increase RNAi efficiency40.
There are additional GAL4 drivers or GFP-lines available that vary in muscle-type specificity, temporal expression pattern, and driver strength19,61 that may be used instead of Mef2-GAL4. For example, Act88F-GAL4 is first expressed around 24 h APF, so it cannot be used for earlier timepoints; however, it strongly labels IFM and may be useful to avoid RNAi-associated early lethality. Him-GFP or Act88F-GFP label IFM, again with temporal restrictions, but they avoid GAL4 dependence of marker expression and may be useful in combination with a mutant background of interest. Lists of other possible marker lines are available19. It should also be noted that use of transgenes and the GAL4/UAS system may cause gene expression artifacts, so it is important to use appropriate controls, for example the driver line crossed to the wild-type background strain, so that such artifacts are presumably the same in all samples.
With the accompanying video, this detailed protocol aims to make pupal IFM dissection more accessible and promote the use of omics approaches to study muscle development. Coupling the power of Drosophila genetics and cell biology with the biochemistry and omics assays accessible through dissected IFM has the potential to advance mechanistic understanding of myogenesis and muscle function. Future studies linking systems-level observations of transcriptome and proteome regulation to metabolic and functional outputs will provide a deeper understanding of muscle-type specific development and the pathogenesis of muscle disorders.
Disclosures
The authors have nothing to disclose.
Acknowledgements
We are grateful to Andreas Ladurner and Frank Schnorrer for generous support. We thank Sandra Esser for excellent technical assistance and Akanksha Roy for generating the mass spectrometry data. We acknowledge the Bloomington and Vienna stock centers for providing flies. We thank the Core Facility Bioimaging for help with confocal imaging and the Zentrallabor für Proteinanalytik for analysis of mass spectrometry samples, both at the LMU Biomedical Center (Martinsried, DE). Our work was supported by the Deutsche Forschungs Gemeinschaft (MLS, SP 1662/3-1), the Center for Integrated Protein Science Munich (CIPSM) at the Ludwig-Maximilians-University München (MLS), the Frederich-Bauer Stiftung (MLS), and the International Max Planck Research School (EN).
Materials
| Name | Company | Catalog Number | Comments |
|---|---|---|---|
| 5x High Fidelity (HF) buffer | Thermo Fisher | F518L | |
| 60 mm culture dishes | Sigma-Aldrich | Z643084-600EA | Greiner dishes, 60 mm x 15 mM, vented |
| Black dissecting dish (glass) | Augusta Laborbedarf | 42021010 | Lymphbecken, black glass, 4 cm x 4 cm |
| Black silicon dissecting dishes: activated charcoal powder | Sigma-Aldrich | C9157 | Also available from most pharmacies |
| Black silicon dissecting dishes: Sylgard 184 | Sigma-Aldrich | 761036 | Dishes are made by mixing the Sylgard (~50g) with activated charcoal powder (200 mg) and curing it in Petri dishes (~4 60 mm dishes). |
| Blue pestle | Sigma-Aldrich | Z359947-100EA | Any pellet pestle that can sterilized, also can be used with a motor-driven grinder |
| Cell phone camera, Samsung Galaxy S9 | Samsung | SM-G960F/DS | used for photos not taken under a microscope |
| Chloroform | PanReac AppliChem | A3691,0500 | |
| Confocal microscope, Leica SP8X upright confocal | Leica | www.leica-microsystems.com | |
| Confocal microscope, Zeiss LSM 780 inverted confocal | Zeiss | www.zeiss.com | |
| Double stick tape | Scotch/3M | 3M ID 70005108587 | Double-sided tape, available at most office supply handlers |
| Dumont #5 Forceps | Fine Science Tools | 11252-20 | Inox straight tip 11 cm forceps, Biology grade with 0.05 mm x 0.02 mm tip |
| EtOH (100%, RNase free) | Sigma-Aldrich | 32205-M | |
| fluorescent dissecting microscope camera, Leica DFC310 FX camera | Leica | www.leica-microsystems.com | |
| Fluorescent dissecting microscope software, Leica Application Suite (LAS) version 4.0.0 | Leica | www.leica-microsystems.com | |
| Fluorescent dissecting microscope, Leica M165 FC | Leica | www.leica-microsystems.com | |
| Fly: Bru1[M2] | Fly stock; This paper | ||
| Fly: Bru1[M3] | Fly stock; This paper | ||
| Fly: Mef2-GAL4 | Bloomington Stock Center | BDSC:27390 | Fly stock |
| Fly: salm[1] | Bloomington Stock Center | 3274 | Fly stock |
| Fly: salm[FRT] | Fly stock; see Spletter et al., Elife, 2018 | ||
| Fly: UAS-Bru1IR | Vienna Drosophila Research Center | GD41568 | Fly stock, RNAi hairpin |
| Fly: UAS-GFP::Gma | Bloomington Stock Center | BDSC:31776 | Fly stock |
| Fly: UAS-mCD8a::GFP | Bloomington Stock Center | BDSC:5130 | Fly stock |
| Fly: w[1118] | Bloomington Stock Center | 3605 | Fly stock |
| Fly: weeP26 | Fly stock; see Clyne et al., Genetics, 2003 | ||
| GFP detection reagent, GFP-Booster | ChromoTek | gba488-100 | |
| Glycogen | Invitrogen | 10814-010 | |
| Image processing software, Photoshop CS6 | Adobe | www.adobe.com | |
| Isopropanol | Sigma-Aldrich | I9516-25ML | 2-propanol |
| Method 1 (RNA isolation): TRIzol | Life Technologies | 15596018 | Guanidinium isothiocyanate and phenol monophasic solution |
| Method 2 (RNA isolation): Method 1 + TURBO DNA-free Kit | Invitrogen | AM1907 | TRIzol isolation followed by treatment with a kit to remove DNA |
| Method 3 (RNA isolation): Direct-zol RNA Miniprep Plus Kit | Zymo Research | R2070S | RNA isolation in TRIzol, but over commercial columns instead of using phase separation. Recommended DNase treatment performed with Monarch Dnase I in Monarch DNase I Reaction buffer. |
| Method 4 (RNA isolation): RNeasy Plus Mini Kit | Qiagen | 74134 | We used the provided DNase treatment. IFM pellets were homogenized in RTL buffer as suggested for animal tissues. |
| Method 5 (RNA isolation): ReliaPrep RNA Tissue Miniprep System | Promega | Z6110 | We applied the protocol for ‘Purification of RNA from Fibrous Tissues’. |
| Method 6 (RNA isolation): Monarch Total RNA Miniprep Kit | New England Biolabs | T2010G | We applied the protocol for tissues/leukocytes and lysed in 300 μL of RNA Protection Reagent. |
| Microcentrifuge tubes | Thermo Fisher | AM12400 | RNase-free Microfuge Tubes, 1.5 mL |
| Microscope slides | Thermo Fisher | 12342108 | Standard slides, uncharged, 1 mm |
| Microtome blades | PFM Medical | 207500003 | C35 feather 80 mm |
| Monarch DNase I | New England Biolabs | T2004-21 | |
| Monarch DNase I Reaction Buffer | New England Biolabs | T2005-21 | |
| Normal goat serum | Thermo Fisher | 16210072 | |
| OneTaq Polymerase | New England Biolabs | M0480X | |
| Paintbrush | Marabu | 1910000000 | Marabu Fino Round No. 0, or similar brush from any art supply |
| Paraformaldehyde | Sigma-Aldrich | 158127 | |
| PBS buffer (1x) | Sigma-Aldrich | P4417 | Phosphate buffered saline tablets for 1 L solutions, pH 7.4 |
| PFA PureTip Pipette Tips | Elemental Scientific | ES-7000-0101 | Optional substitute for standard pipette tips to reduce sample loss; 100 mL, 0.8 mm orifice |
| Phusion High Fidelity Polymerase | Thermo Fisher | F-530XL | |
| Pipette tips | Sigma-Aldrich | P5161 | Universal 200 mL pipette tips |
| Preomics iST 8x Kit | Preomics | P.O.00001 | peptide preparation kit for mass spectrometry |
| Q Exactive mass spectrometer | Thermo Fisher | 725500 | mass spectrometry was performed at the Protein Analysis Unit of the LMU Biomedical Center |
| Qubit RNA Assay Kit | Life Technologies | Q32855 | |
| Rhodamine-phalloidin | Invitrogen, Molecular Probes | 10063052 | |
| RNA concentration Approach 1 & RNA integrity traces, Bioanalyzer | Agilent Technologies | G2939BA | |
| RNA concentration Approach 2, Nanodrop | Thermo Fisher | ND-2000 | |
| RNA concentration Approach 3, Qubit 4 Fluorometer | Invitrogen | Q33238 | |
| RNA Pico Chips | Agilent Technologies | 5067-1513 | |
| RNase A | Promega | A7937 | |
| RNase-free water, Diethyl pyrocarbonate (DEPC) | Sigma-Aldrich | D5758 | DEPC treat water overnight and then autoclave, to remove all RNase. |
| RT Kit #1: Super Script III Reverse Transcriptase Kit | Invitrogen | 18080-044 | reverse transcription kit |
| RT Kit #2: LunaScript | New England Biolabs | E3010S | reverse transcription kit |
| RT Kit #3: QuantiNova Reverse Transcription Kit | Qiagen | 205410 | reverse transcription kit |
| Slide mounting buffer, Vectashield | Vector Laboratories | H-1200 | containing DAPI |
| Statistical software: GraphPad Prism | GraphPad Prism | www.graphpad.com | |
| Statistical software: Microscoft Excel | Microsoft | Purchased as part of the bundle: Office Home & Student 2019 | |
| Table-top centrifuge | Eppendorf | 5405000760 | Eppendorf Centrifuge 5425 or equivalent |
| Tissue/ Kimwipes | Sigma-Aldrich | Z188956 | Standard tissue wipes |
| Transfer pipette | Sigma-Aldrich | Z350796 | Plastic pipette |
| Triton-X100 | Sigma-Aldrich | T9284-500ML | |
| Vannas spring scissors | Fine Science Tools | 15000-00 | 3 mm cutting edge, tip diameter 0.05 mm, length 8 cm |
| Whatman paper | Sigma-Aldrich | 1004-070 | Filter paper circles, Grade 4, 70 mm |
References
- Rexiati, M., Sun, M., Guo, W. Muscle-Specific Mis-Splicing and Heart Disease Exemplified by RBM20. Genes. 9 (1), 18(2018).
- Guo, W., et al. RBM20, a gene for hereditary cardiomyopathy, regulates titin splicing. Nature Medicine. 18 (5), 766-773 (2012).
- Guo, W., et al. Splicing Factor RBM20 Regulates Transcriptional Network of Titin Associated and Calcium Handling Genes in The Heart. International Journal of Biological Sciences. 14 (4), 369-380 (2018).
- Nikonova, E., Kao, S. -Y., Ravichandran, K., Wittner, A., Spletter, M. L. Conserved functions of RNA-binding proteins in muscle. The International Journal of Biochemistry & Cell Biology. 110, 29-49 (2019).
- Wang, E. T., et al. Dysregulation of mRNA Localization and Translation in Genetic Disease. The Journal of Neuroscience. 36 (45), 11418-11426 (2016).
- Wang, E. T., et al. Antagonistic regulation of mRNA expression and splicing by CELF and MBNL proteins. Genome Research. 25 (6), 858-871 (2015).
- Kalsotra, A., et al. A postnatal switch of CELF and MBNL proteins reprograms alternative splicing in the developing heart. Proceedings of the National Academy of Sciences of the United States of America. 105 (51), 20333-20338 (2008).
- Ho, T. H., et al. Muscleblind proteins regulate alternative splicing. The EMBO Journal. 23 (15), 3103-3112 (2004).
- Lemke, S. B., Schnorrer, F. Mechanical forces during muscle development. Mechanisms of Development. 144, Pt A 92-101 (2017).
- Iwamoto, H. Structure, function and evolution of insect flight muscle. Biophysics. 7, 21-28 (2011).
- Schnorrer, F., Dickson, B. J. Muscle building; mechanisms of myotube guidance and attachment site selection. Developmental Cell. 7 (1), 9-20 (2004).
- Spletter, M. L., Schnorrer, F. Transcriptional regulation and alternative splicing cooperate in muscle fiber-type specification in flies and mammals. Experimental Cell Research. 321 (1), 90-98 (2014).
- Benoist, P., Mas, J. A., Marco, R., Cervera, M. Differential muscle-type expression of the Drosophila troponin T gene. A 3-base pair microexon is involved in visceral and adult hypodermic muscle specification. Journal of Biological Chemistry. 273 (13), 7538-7546 (1998).
- Schönbauer, C., et al. Spalt mediates an evolutionarily conserved switch to fibrillar muscle fate in insects. Nature. 479 (7373), 406-409 (2011).
- Bryantsev, A. L., et al. Extradenticle and Homothorax Control Adult Muscle Fiber Identity in Drosophila. Developmental Cell. 23 (3), 664-673 (2012).
- Spletter, M. L., et al. The RNA-binding protein Arrest (Bruno) regulates alternative splicing to enable myofibril maturation in Drosophila flight muscle. EMBO Reports. 16 (2), 178-191 (2015).
- Oas, S. T., Bryantsev, A. L., Cripps, R. M. Arrest is a regulator of fiber-specific alternative splicing in the indirect flight muscles of Drosophila. The Journal of Cell Biology. 206 (7), 895-908 (2014).
- Kim, J. H., Jin, P., Duan, R., Chen, E. H. ScienceDirect Mechanisms of myoblast fusion during muscle development. Current Opinion in Genetics & Development. 32, 162-170 (2015).
- Weitkunat, M., Schnorrer, F. A guide to study Drosophila muscle biology. Methods. 68 (1), San Diego, Calif. 2-14 (2014).
- Rai, M., Nongthomba, U., Grounds, M. D. Skeletal Muscle Degeneration and Regeneration in Mice and Flies. Mechanisms of Regeneration. 108, Elsevier Inc. 247-281 (2014).
- Swank, D. M., Wells, L., Kronert, W. A., Morrill, G. E., Bernstein, S. I. Determining structure/function relationships for sarcomeric myosin heavy chain by genetic and transgenic manipulation of Drosophila. Microscopy Research and Technique. 50 (6), 430-442 (2000).
- de Joussineau, C., Bataillé, L., Jagla, T., Jagla, K. Diversification of muscle types in Drosophila: upstream and downstream of identity genes. Current Topics in Developmental Biology. 98, 277-301 (2012).
- Maqbool, T., Jagla, K. Genetic control of muscle development: learning from Drosophila. Journal of Muscle Research and Cell Motility. 28 (7-8), 397-407 (2008).
- Jagla, K., Kalman, B., Boudou, T., Hénon, S., Batonnet-Pichon, S. Beyond mice: Emerging and transdisciplinary models for the study of early-onset myopathies. Seminars in Cell & Developmental Biology. 64, 171-180 (2017).
- Haigh, S. E., et al. Drosophila indirect flight muscle specific Act88F actin mutants as a model system for studying congenital myopathies of the human ACTA1 skeletal muscle actin gene. Neuromuscular Disorders. 20 (6), 363-374 (2010).
- Batonnet-Pichon, S., et al. Myofibrillar Myopathies: New Perspectives from Animal Models to Potential Therapeutic Approaches. Journal of Neuromuscular Diseases. 4 (1), 1-15 (2017).
- Kreipke, R. E., Kwon, Y. V., Shcherbata, H. R., Ruohola-Baker, H. Drosophila melanogaster as a Model of Muscle Degeneration Disorders. Current Topics in Developmental Biology. 121, 83-109 (2017).
- Souidi, A., Zmojdzian, M., Jagla, K. Dissecting Pathogenetic Mechanisms and Therapeutic Strategies in Drosophila Models of Myotonic Dystrophy Type 1. International Journal of Molecular Sciences. 19 (12), 4104(2018).
- Sparrow, J., Hughes, S. M., Segalat, L. Other Model Organisms for Sarcomeric Muscle Diseases. Advances in Experimental Medicine and Biology. 642, 192-206 (2008).
- Lloyd, T. E., Taylor, J. P. Flightless flies: Drosophila models of neuromuscular disease. Annals of the New York Academy of Sciences. 1184, 1-20 (2010).
- Swank, D. M. Mechanical analysis of Drosophila indirect flight and jump muscles. Methods. 56 (1), 69-77 (2012).
- Spletter, M. L., et al. A transcriptomics resource reveals a transcriptional transition during ordered sarcomere morphogenesis in flight muscle. eLife. 7, 1361(2018).
- Weitkunat, M., Kaya-Çopur, A., Grill, S. W., Schnorrer, F. Tension and force-resistant attachment are essential for myofibrillogenesis in Drosophila flight muscle. Current Biology. 24 (7), 705-716 (2014).
- Gunage, R. D., Dhanyasi, N., Reichert, H., VijayRaghavan, K. Drosophila adult muscle development and regeneration. Seminars in Cell & Developmental Biology. 72, 56-66 (2017).
- Weitkunat, M., Brasse, M., Bausch, A. R., Schnorrer, F. Mechanical tension and spontaneous muscle twitching precede the formation of cross-striated muscle in vivo. Development. 144 (7), 1261-1272 (2017).
- Zappia, M. P., Rogers, A., Islam, A. B. M. M. K., Frolov, M. V. Rbf Activates the Myogenic Transcriptional Program to Promote Skeletal Muscle Differentiation. Cell Reports. 26 (3), 702-719 (2019).
- Zappia, M. P., Frolov, M. V. E2F function in muscle growth is necessary and sufficient for viability in Drosophila. Nature Communications. 7 (1), 10509(2016).
- Bryantsev, A. L., et al. Myogenesis in Drosophila melanogaster: Dissection of Distinct Muscle Types for Molecular Analysis. Methods in Molecular Biology. 1889 (5), 267-281 (2019).
- Xiao, Y. S., Schöck, F., González-Morales, N. Rapid IFM Dissection for Visualizing Fluorescently Tagged Sarcomeric Proteins. Bio-Protocol. 7 (22), (2017).
- Kaya-Çopur, A., Schnorrer, F. RNA Interference Screening for Genes Regulating Drosophila Muscle Morphogenesis. Myogenesis. 1889, Chapter 20 331-348 (2019).
- Chechenova, M. B., et al. Functional redundancy and non-redundancy between two Troponin C isoforms in Drosophila adult muscles. Molecular Biology of the Cell. 28 (6), 760-770 (2017).
- Alberts, B. Molecular Biology of the Cell. , Garland Science. New York, NY. (2017).
- Clyne, P. J., Brotman, J. S., Sweeney, S. T., Davis, G. Green fluorescent protein tagging Drosophila proteins at their native genomic loci with small P elements. Genetics. 165 (3), 1433-1441 (2003).
- Orfanos, Z., Sparrow, J. C. Myosin isoform switching during assembly of the Drosophila flight muscle thick filament lattice. Journal of Cell Science. 126 (1), 139-148 (2013).
- Volohonsky, G., Edenfeld, G., Klambt, C., Volk, T. Muscle-dependent maturation of tendon cells is induced by post-transcriptional regulation of stripeA. Development. 134 (2), 347-356 (2007).
- Estes, P. S., Ho, G. L., Narayanan, R., Ramaswami, M. Synaptic localization and restricted diffusion of a Drosophila neuronal synaptobrevin--green fluorescent protein chimera in vivo. Journal of Neurogenetics. 13 (4), 233-255 (2000).
- Hida, N., et al. EC-tagging allows cell type-specific RNA analysis. Nucleic Acids Research. 45 (15), 138(2017).
- Thomas, A., et al. A versatile method for cell-specific profiling of translated mRNAs in Drosophila. PLoS ONE. 7 (7), 40276(2012).
- Yang, Z. Isolation of mRNA from specific tissues of Drosophila by mRNA tagging. Nucleic Acids Research. 33 (17), 148(2005).
- Jiao, Y., Moon, S. J., Montell, C. A Drosophila gustatory receptor required for the responses to sucrose, glucose, and maltose identified by mRNA tagging. Proceedings of the National Academy of Sciences of the United States of America. 104 (35), 14110-14115 (2007).
- Blazie, S. M., et al. Comparative RNA-Seq analysis reveals pervasive tissue-specific alternative polyadenylation in Caenorhabditis elegans intestine and muscles. BMC Biology. 13 (1), 1775-1821 (2015).
- Henry, G. L., Davis, F. P., Picard, S., Eddy, S. R. Cell type-specific genomics of Drosophila neurons. Nucleic Acids Research. 40 (19), 9691-9704 (2012).
- Deal, R. B., Henikoff, S. The INTACT method for cell type-specific gene expression and chromatin profiling in Arabidopsis thaliana. Nature Protocols. 6 (1), 56-68 (2011).
- Grinstein, M., Dingwall, H. L., Shah, R. R., Capellini, T. D., Galloway, J. L. A robust method for RNA extraction and purification from a single adult mouse tendon. PeerJ. 6 (8), 4664(2018).
- Green, M. R., Sambrook, J. Molecular Cloning. , (2012).
- Brown, R. A. M., et al. Total RNA extraction from tissues for microRNA and target gene expression analysis: not all kits are created equal. BMC Biotechnology. 18 (1), 16(2018).
- Ford, K. L., et al. Optimisation of laboratory methods for whole transcriptomic RNA analyses in human left ventricular biopsies and blood samples of clinical relevance. PLoS ONE. 14 (3), 02136855(2019).
- Ramachandran, P., Budnik, V. Dissection of Drosophila larval body-wall muscles. Cold Spring Harbor Protocols. (8), 5469(2010).
- Ranganayakulu, G., Schulz, R. A., Olson, E. N. Wingless signaling induces nautilus expression in the ventral mesoderm of the Drosophila embryo. Developmental Biology. 176 (1), 143-148 (1996).
- Dutta, D., Bloor, J. W., Ruiz-Gómez, M., VijayRaghavan, K., Kiehart, D. P. Real-time imaging of morphogenetic movements in Drosophila using Gal4-UAS-driven expression of GFP fused to the actin-binding domain of moesin. Genesis. 34 (1-2), 146-151 (2002).
- Lemke, S. B., Schnorrer, F. In Vivo Imaging of Muscle-tendon Morphogenesis in Drosophila Pupae. Journal of Visualized Experiments. (132), e57312(2018).
Reprints and Permissions
