This paper presents four of the most common techniques for visualizing BrdU positive cells to measure adult neurogenesis in rats. This work includes instructions for reagent preparation, thymidine analog administration, transcardial perfusion, tissue preparation, peroxidase immunohistochemical reaction, immunofluorescence, signal amplification, counterstaining, microscopy imaging, and cell analysis.
Method Article
Immunohistochemistry Techniques to Analyze Cellular Proliferation and Neurogenesis in Rats Using the Thymidine Analog BrdU
* These authors contributed equally
In This Article
Summary
Abstract
One of the most important things in the field of adult hippocampal neurogenesis (AHN) is the identification of the newly generated cells. The immunodetection of thymidine analogs (such as 5-Bromo-2'-deoxyuridine (BrdU)) is a standard technique used for visualizing these newly generated cells. Therefore, BrdU is usually injected in small animals intraperitoneally, so the thymidine analog gets incorporated into dividing cells during DNA synthesis. Detection is performed by immunohistochemical analysis of brain slices. Every research group that has been using this technique can appreciate that it requires special attention to minute details to achieve a successful stain. For instance, an important step is DNA denaturation with HCl, which allows it to reach the cell nucleus to stain it. However, the existing scientific reports describe very few of such steps in detail. Therefore, standardizing the technique is challenging for new laboratories as it can take several months to yield positive and successful outcomes. The purpose of this work is to describe and elaborate the steps to obtain positive and successful outcomes of the immunostaining technique in detail when working with the thymidine analog BrdU. The protocol includes the reagent preparation and setup, administration of thymidine analog in a rodent, transcardial perfusion, tissue preparation, peroxidase immunohistochemical reaction, use of avidin-biotin complex, immunofluorescence, counterstaining, microscopy imaging, and cell analysis.
Introduction
The idea that new neurons are generated in the adult human brain throughout the lifespan has fascinated the scientific community for decades. The knowledge that the brain generates new neurons throughout its lifespan was attained through the detection of cells under division1,2. Detection of newly generated neurons in the adult brain was first identified by intracranially injecting tritiated thymidine (thymidine-H3) in rats and detecting cells in the cell cycle by autoradiograms1,2. Cell division of glia and the presence of neuroblasts was reported, which was the first promising data on the postnatal neurogenesis1. Nevertheless, the use and detection of thymidine-H3 implied the use of radioactivity, which can be harmful to the people who manage it. The first effort examining the suitability of BrdU immunohistochemistry in the study of proliferation, migration, and origin of cells in the nervous systems appeared in 1988 by Miller and Nowakowski3. In 1998, a paper published by Eriksson and colleagues showed that new neurons were visualized postmortem in the human adult brain of patients injected with 5-Bromo-2′-deoxyuridine (BrdU)4. These patients received the BrdU injection (250 mg intravenous) to label the growth of tumors4. This technique was adopted into animal models. The introduction of these methods marked a milestone for the field since this allowed detection of newly generated cells without the use of radioactive compounds. This procedure became the gold standard to measure cell proliferation in adult brain niches to promote further research in the field.
The limitation of the thymidine analog technique is that it does not allow the determination of cellular identity for the newly generated cells. However, immunohistochemistry allows us to carry out double- or triple- labeling technique of the same cell, which validates the cellular fate of the newly generated cells and even their stages of maturation, leading to further evolution of the field. This method was characterized to differentiate newly generated cells into glia, undifferentiated neurons, or a fully mature granular cell, and even to determine if they are participating actively in the circuitry. Another breakthrough in the field was the use of transgenic models to identify undifferentiated cells under the domain of nestin. The nestin-GFP transgenic mice express an enhanced green fluorescent protein (GFP), which is under the control of the nestin promoter. Nestin is an intermediate filament characterized by progenitor cells5. The nestin-GFP transgenic mice allowed to establish early developmental steps involved in neurogenesis6. However, a significant limitation is to be able to maintain a nestin-GFP transgenic mice colony under special conditions in a laboratory facility that becomes cost-effective for some scientific groups, especially those from developing countries.
The techniques mentioned above have advantages and disadvantages. However, identification of proliferating cells by immunohistochemistry (IHC) and the possibility to carry out double- or triple- labeling technique by immunofluorescence to identify cell maturation stage or cell fate represents the most feasible way to measure adult neurogenesis, so far. The identification process using immunohistochemistry consists of labeling proteins, protein domain, or nucleotides with a specific antibody that allows their recognition known as primary antibody. The latter is recognized by the secondary antibody, which is marked with a chromogen (e.g., horseradish peroxidase) or a fluorochrome (e.g., FITC) coupled with the secondary antibody. Microscopes can detect both chromogens and fluorochromes signals. Using IHC, it is possible to identify membrane proteins, cytoskeleton proteins, or nuclear components such as BrdU. On the other hand, BrdU can be found in the cellular nucleus since it is incorporated into the DNA during S-phase by competition. Therefore, a crucial step is the DNA denaturation with HCl, which opens DNA bonds to allow the BrdU antibody access to BrdU within the DNA. It is essential to know that BrdU is present in a saturated concentration in mice and rat serum for 15 and 60 min respectively, after intraperitoneal administration, then drops rapidly to undetectable levels at 60 and 120 min respectively7.
Here, we describe four different but closely related IHC techniques: chromogenic indirect detection using horseradish peroxidase (HRP) reaction with DAB (3,3'-diaminobenzidine) sans signal amplification (step 4.1), avidin-biotin complex (ABC) amplification (step 4.1), indirect immunofluorescence detection without signal amplification (step 4.4) and labeled streptavidin-biotin (LSAB) amplification (step 4.3). Each method has advantages and disadvantages and could be useful for specific tissue requirements (see Table 1). We decided to follow indirect ICH methods due to their affordability and simplicity to make changes from chromogenic to fluorescent detection methods when using unconjugated primary antibodies. The HRP approach is a commonly used IHC method due to its affordability, high stability, high turnover rate, and substrates' full availability. Nevertheless, we recommend using a positive control to confirm that the staining method works accurately and the use of negative control to test the antibody function effectively. Multiple immunostainings or multiplex IHC methods (see step 6) are potent tools to acquire large amounts of data from the tissue section in a single experiment. This technique is particularly important when the availability of samples is limited. Another advantage is the possibility to simultaneously identify specific proteins co-expressed in the same cellular space while preserving tissue integrity. Multiplex allows to stain different markers expressed during specific proliferative stages (e.g., nestin, GFAP, DCX, Ki-67), enabling us to reach a more detailed proliferation and differentiation research8. It is crucial to choose antibodies compatible with the fixation technique used to avoid cross-reactivity. We recommend testing each new antibody (including BrdU) individually to adjust and refine the method. Then, introduce the double sequential staining and, finally, start the simultaneous immunostaining process when the sequential method is entirely dominated. It is crucial to choose appropriate secondary antibodies for this method.
| Method | Specific Method | Advantages | Disadvantages |
| Indirect Detection Method | Peroxidase reaction with DAB | 1. Higher sensitivity than the direct detection and indirect fluorescence method. 2. Higher resistance to Photobleaching than fluorochromes. 3. Lower cost than fluorescence detection method | 1. Difficult for Multiplexing with fewer color dyes. 2. Complicated for Co-expressed targets in the same cellular space. 3. Reduced Dynamic Range for simultaneous scarce and high abundant targets on the same tissue. |
| Fluorescence | 1. Best and easiest for Multiplexing with more color dyes. 2. Best for Co-expressed targets in the same cellular space. 3. Better Dynamic Range for simultaneous scarce and high abundant targets on the same tissue. 4. No Additional Steps. | 1. Lower sensitivity than the indirect peroxidase reaction with DAB method. 2. Weak resistance to Photobleaching over time. 3. More expensive. | |
| Signal Amplification Method | Avidin-Biotin Complex (ABC) | 1. Higher sensitivity than the direct and indirect detection method. 2. Reduce background | 1. Additional Steps. 2. More expensive than not amplification. |
| Labeled Streptavidin-Biotin (LSAB) | 1. Higher sensitivity than the direct and indirect detection method. 2. More substantial tissue penetration than the ABC method. 3. Reduce background | 1. Additional Steps. 2. More expensive than the ABC method. | |
| Not additional amplification method | 1. Lower cost. 2. No additional steps. 3. Ideal for high abundant targets. | 1. Lower sensitivity: problematic with no abundant targets. |
Table 1: Advantages/disadvantages of IHC techniques. This table shows the advantages/disadvantages for indirect detection methods: Peroxidase reaction with (3,3'-diaminobenzidine) DAB and fluorescence; and signal amplification methods: avidin-biotin complex (ABC), labeled streptavidin-biotin (LSAB), and not additional amplification method.
A high-resolution image is fundamental to perform proper analysis and present the outcomes. There are two approaches to improve the resolution: 1) use of a better microscope design (e.g., confocal, multiphoton) or 2) numerically inverting the blurring process to enhance images using deconvolution9. Unfortunately, confocal microscopy is not affordable due to the high costs of equipment and its servicing10. A wide-field epifluorescence microscope and the subsequent deconvolution of the z-stack images provide a suitable, low-cost alternative to confocal microscopy8,9. As noted above, deconvolution goal is to restore the original signal that was degraded by the acquisition system9, by reducing blur, out-of-focus haze and distortion shown in the image obtained by an epifluorescence or confocal microscope using mathematical removal algorithms10. The acquired blurred image can be mathematically modeled as the result of convolving the observed objects with a 3D point-spread function (PSF). PSF is a theoretical diffraction pattern of the points of light emitted by the tissue sample and collected by the microscope. PSF file is created with the specific conditions of each image, such as the CCD cell spacing of the camera, refractive index of the media used, the numerical aperture of the objective lens, the emission wavelength of the fluorophore, image sizes, number of images in the z-stack processing method and the space between them (see technical specification in Table 2). In other words, the PSF file summarizes the effects of the imaging setup on the microscope observations9. However, we use the diffraction PSF 3D Plugin (https://imagej.net/Diffraction_PSF_3D) to create our own specific PSF file for each z-stack image. Z-stack images are a series of digitized optical sections from defined depths (z-axis) at the same XY location of the slide. A computer compiles the information obtained from the focus plane by reassigning signals which have originated from objects located in other focal planes. To create z-stack images, it is necessary to take images from different focused layers of the slides (e.g., ten different images of the same XY area every 1 μm depth). Then, we use microscopy software provided by the manufacturer or Fiji to create a z-stack or 3D image. The result will be a single stack image file (e.g., ten images with different focuses). There are several customer-specific tools and software solutions, such as open-source software for deconvolution microscopy. We will show the outputs of the deconvolution process using DeconvolutionLab29 which is a Fiji11 plugin (distribution of ImageJ12). Deconvolution will help improve the resolution of final micrographs (see Figure 1B,C ). For further information and instruction, we strongly recommend reading reference13.
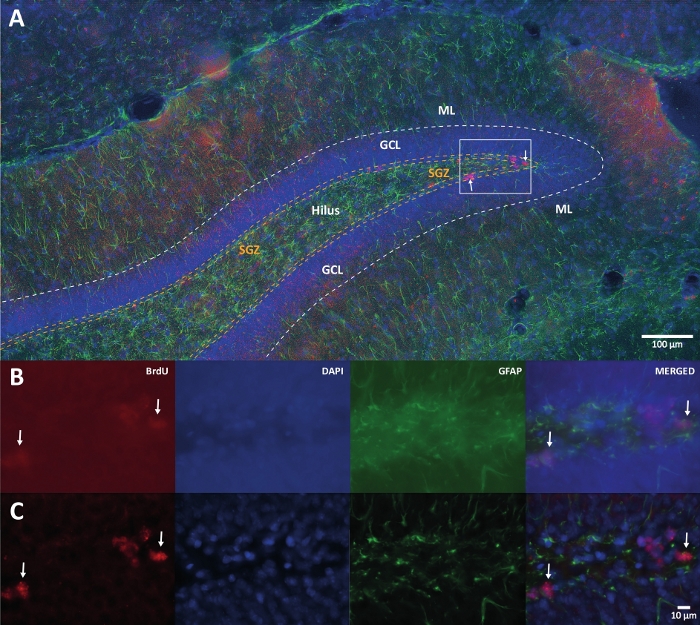
Figure 1: Representative image of 3D deconvolution for multiple color channels. (A) DG at low magnification. (B) The original z-stack images for each channel and the merged image. (C) 3D deconvoluted z-stack images for each channel and the merged image. This brain was from the rat that was the part of physical activity group. Labeled streptavidin-biotin (LSAB) amplification method was used. It showed Cy3 streptavidin conjugated antibody for indicating BrdU (red), DAPI as a counterstaining (blue), and glial fibrillary acidic protein (GFAP) as an astroglial marker (green). ML = molecular layer; GCL = granular cell layer; SGZ = subgranular zone. Please click here to view a larger version of this figure.
The purpose of this work is to provide a detailed description of the steps to obtain positive and successful outcomes with immunostaining and to list commonly used steps in BrdU-based studies, without the use of a confocal microscope. BrdU staining is a technique that requires several steps that must be carefully followed to achieve a successful stain. Standardizing these staining techniques typically takes months and is time and resource intensive. We anticipated that this article could provide information to the groups starting out within this field by reducing time and errors.
Protocol
All procedures follow the National Institutes of Health guide for the care and use of laboratory animals (NIH Publications N°. 8023, revised in 1978) and local Mexican laws to minimize the number of animals used and their suffering. The Ethics Committee of the Universidad Iberoamericana approved the experimental protocols for using animals in this study.
1. Reagent preparation and setup
NOTE: Most of the solutions can be prepared days before use unless specified otherwise.
- BrdU solution
- Retrieve the BrdU solution from -20 °C freezer and allow it to equilibrate at room temperature (RT).
- Calculate the mass of BrdU needed for a dose of 50 mg/kg according to the body weight of the rat. Calculate volume of 0.9% saline solution (0.9 g NaCl in 100 mL of sterile H2O) needed for a working solution of 20 mg/mL. Prepare an excess to provide at least 0.5 mL per rat per injection.
NOTE: The dose administered to experimental animals should be safe, with minimal side effects, and effective. It has been reported that duration of staining with 100 mg/kg BrdU does not outweigh the potentially higher toxicity compared with the 50 mg/kg dose7. No significant differences were found in the number of BrdU-labeled cells/mm3 for 50 and 100 mg/kg i.p. in rats7. It is preferable to inject a small dose to minimize the suffering of the animals. - Weigh out BrdU solution and add it to the saline solution in a conical tube and vortex.
NOTE: Pre-heat the saline solution at 45‒50 °C in a water bath for volumes bigger than 1 mL. - Place the tube in a water bath at 50 °C for 10‒15 min and vortex every 2‒3 min until completely dissolved. Filter the solution with a syringe filter for sterile injection. Cover the tube with tin foil, cool it down at room temperature and use immediately.
CAUTION: BrdU solution is toxic and potentially carcinogenic. Prepare it in the fume hood. BrdU solution must be handled with proper protective equipment (PPE). It is recommended to prepare the solution immediately before use. However, the solution is stable for 24 h under RT. Please protect it from light.
- To prepare 1 L of 0.1 M phosphate buffered saline (PBS) at pH 7.4, add 240 mg of potassium phosphate monobasic (KH2PO4), 1.44 g of sodium phosphate dibasic (Na2HPO4), 200 mg of potassium chloride (KCl), and 8 g of sodium chloride (NaCl) to 800 mL of double distilled water (ddH2O) under constant stirring. Adjust the pH to 7.4 and add double distilled H2O up to total volume of 1 L. Store at 4 °C for up to 1 week.
- For 100 mL of PBS+, add 3% (3 mL) of normal horse serum and 0.3% (300 µL) of Triton X-100 to 0.1 M PBS (pH 7.4). Store in 20‒50 mL aliquots at -20 °C for up to 3 months.
NOTE: Alternatively, TBS can be used instead of PBS. Any other serum different from the host’s antibodies and experimental tissue is suitable. - For 100 mL of PBS++, add 10% (10 mL) of normal horse serum and 0.3% (300 µL) of Triton X-100 to 0.1 M PBS pH 7.4. Store in 20‒50 mL aliquots at -20 °C for up to 3 months.
- For 1 L of cryoprotectant solution, mix 250 mL of ethylene glycol and 250 mL of glycerol, constantly stir until mixed. Slowly bring to 1 L with PBS. Filter with grade 4 (20‒25 μm) filter paper. Store at 4 °C or RT for up to 1 year.
- Prepare 4% paraformaldehyde in 0.1 M PBS (PFA solution) as follows. For 1 L of solution, add 40 g of paraformaldehyde powder slowly to 800 mL of 60‒65 °C 0.1 M PBS under constant stirring. Stir until paraformaldehyde is completely dissolved while controlling the temperature (60‒65 °C). If necessary, add a few drops of 1 M NaOH to clarify the solution. When the solution reaches room temperature, filter with grade 4 (20-25 μm) filter paper.
CAUTION: Paraformaldehyde is toxic and is suspected of being a carcinogen, prepare in the fume hood. Store at 4 °C for and preferably use within to 2 days. PFA ready-to-use solution is commercially available. - For 1 L of 10 mM Sodium citrate buffer (SCB) at pH 6, add 1.204 g of sodium citrate (dihydrate), and 1.134 g of citric acid to 800 mL of double distilled H2O under constant stirring. Adjust the pH to 6.0 and add ddH2O up to 1 L. Store at 4 °C for up to 6 months.
- Prepare 50 mL of 2 N HCl by slowly adding 8.25 mL of 12 N HCl (concentrated stock solution) to 41.75 mL of ddH2O under constant stirring.
CAUTION: Prepare in the fume hood. Solution must be prepared immediately before use.
NOTE: 2 N HCl will be used for DNA denaturation, a crucial step. As BrdU is incorporated into the DNA, HCl is used to open the DNA bonds allowing BrdU antibody access BrdU within the DNA. - Prepare endogenous peroxidase blocking solution as follows. Prepare 100 mL of 0.6% hydrogen peroxide by mixing 2 mL of 30% hydrogen peroxide with 98 mL of ddH2O under constant stirring.
NOTE: The solution must be prepared immediately before use. Keep it in the dark as H2O2 is light sensitive. PBS or TBS can be used instead of water. - Prepare avidin-biotin complex (ABC) solution as per the instructions from the manufacturer. For 5 mL of ABC in 0.1 M PBS, add 2 drops (≈100 µL) of reagent A and mix, and then add 2 drops (≈100 µL) of reagent B and mix.
NOTE: Solution must be prepared and allowed to tumble-roll for 20‒30 min before use. - Prepare DAB (Diaminobenzidine) Peroxidase (HRP) substrate using the kit by following the instructions of the manufacturer. To 5 mL of ddH2O, add 2 drops (≈ 84 µL) of reagent 1 and mix, add 4 drops (≈ 100 µL) of reagent 2 and mix, then add 2 drops (≈ 80 µL) of reagent 3 and mix. Finally, if desired, add 2 drops (≈ 80 µL) of reagent 4 (Nickel) and mix.
NOTE: Solution must be prepared immediately before use.
CAUTION: DAB is toxic and potentially carcinogenic. It must be handled with care and discarded as per the hazardous waste regulation at each institution. To inactivate DAB, add several drops of bleach (sodium hypochlorite); the solution will turn black. - Prepare 100 mL of cresyl violet solution by adding 100 mg of cresyl violet acetate and 250 μL of acetic acid to 80 mL of ddH2O at 55‒60 °C. Adjust the volume to 100 mL, filter, and store at 4 °C in a dark-colored vessel.
NOTE: The user is encouraged to test different concentrations of the cresyl violet solution before using it on valuable tissue samples. The result may be darker for counterstaining with some tissue samples, which may decrease the ability to count BrdU positive cells accurately.
2. Thymidine analog BrdU administration
- Restrain the experimental animal (e.g., 90-day-old male Wistar rat weighing 350 g), by immobilizing the lower abdominal cavity.
- Administer the BrdU solution (50 mg/kg) intraperitoneally (i.p.) using a 23 G needle and 1 mL syringe.
NOTE: Adjust the injection volume as per weight of the animal. Use a 23‒27 G needle and a 1‒5 mL syringe for adult rats. The maximum tolerable intraperitoneal injection volume in the adult rat is 10 mL. Different routes can be used to administer the BrdU solution14. For example, intraperitoneal injection or oral administration through drinking water.
3. Tissue preparation
NOTE: Three-month-old rats were allowed ad libitum access to physical activity (endless wheel) for seven days. On the day 6, rats were injected with BrdU (step 2) 3 times at intervals of 12 h. Perform steps in section 3 after 8 h from the last BrdU injection.
- Inject pentobarbital (50 mg/kg i.p.) and wait a few minutes until the animal is deeply anesthetized.
NOTE: Make sure that the animal is completely anesthetized before continuing. Carefully pinch one of the legs or the tail. If the animal reacts to the stimulus, wait a few more minutes. If the animal does not react to the pinch, go to the next step. - Expose the heart by cutting the abdominal cavity skin below the breastbone, taking apart the ribs, and cutting the diaphragm.
- Transcardial perfusion fixation
- Insert a needle into the left ventricle and make a small incision in the right atrium. Using a pump or gravity, perfuse (flow rate 5‒7 mL/min.) 0.1 M PBS until entire blood is drained out, and the solution becomes clear.
- Using a pump or gravity, perform cold perfusion (flow rate 5‒7 mL/min) with PFA solution to fix the tissue until the tail becomes rigid.
NOTE: Usually, a 300 g rat requires around 100‒150 mL of the PFA solution. The tissue fixation is optional. Thereby, the brain can be extracted for use in various processes to minimize animal usage in the experiments.
- Dissection and post-fixation
- Decapitate the animal, and gently extract the brain from the skull. Immerse the brain into a conical tube containing PFA solution (~40 mL for a 250 mg rat) for 1‒2 days at 4 °C.
NOTE: Do not over-fixate (more than 48 h), because this can deplete the tissue staining due to the unavailability of antigens. - Prepare 100 mL of 30% sucrose solution, adding 30 g of sucrose to 70 mL of 0.1 M PBS solution under constant stirring. Add 0.1 M PBS solution to 100 mL. Immerse the brain into a conical tube with a 30% sucrose solution (35 mL) for approximately 1‒2 days at 4 °C until the brain sinks to the bottom of the tube.
- Decapitate the animal, and gently extract the brain from the skull. Immerse the brain into a conical tube containing PFA solution (~40 mL for a 250 mg rat) for 1‒2 days at 4 °C.
- Cutting coronal brain sections
NOTE: Using a cryostat-microtome requires guidance and training. For detailed instructions, see reference15.- Submerge the whole brain into iso-pentane at -80 °C and keep it at -80 °C for 10 min. Place the brain in an embedding matrix on a cryostat-microtome plate.
NOTE: Under certain conditions, rapid freezing of the brain at -80 °C can cause fracture or damage to the tissue. The user should be aware of this problem. If this is the case, use -20 °C iso-pentane to freeze the brain. - Using a cryostat-microtome (temperature at -25 to -20 °C) cut coronal sections of 40 μm thickness. Sequentially transfer sections into a 24-well cell culture plate with cryoprotection solution following the guide in Figure 2. Store at -20 °C until use, for up to few months.
NOTE: Hereafter, process all tissue in free-floating serial sections of 40 µm in 12-well plates with mesh inserts in gentle and continuous agitation (10 rpm). It is possible to store brain sections for years under the right conditions.
- Submerge the whole brain into iso-pentane at -80 °C and keep it at -80 °C for 10 min. Place the brain in an embedding matrix on a cryostat-microtome plate.
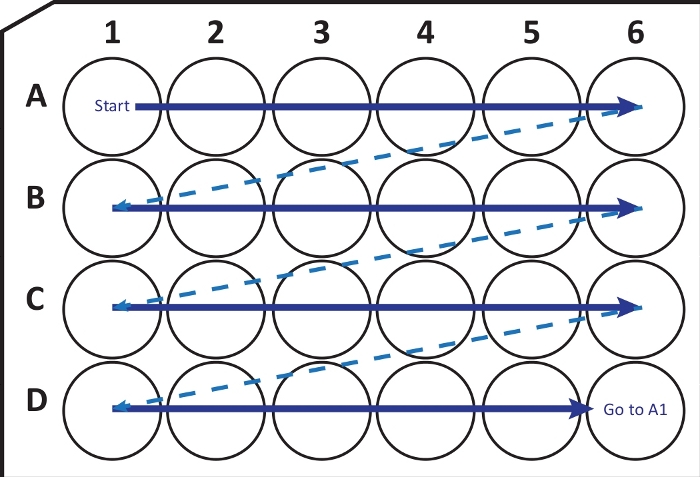
Figure 2: Schematic illustration of sequentially transferring sections from cryostat-microtome into a 24-well cell culture plate with cryoprotection solution. Begin at A1-well and place the next slices into row A; after A6-well move to the next row B, so on. When arriving D6, go back to A1 and continue. This arrangement allows Nth (e.g., sixth for neurogenesis, equivalent to the content of one column) section quantification of an entire brain region. Please click here to view a larger version of this figure.
4. Immunostaining
NOTE: See Table 1 for the summary of the advantages and disadvantages of each technique.
- Detection of BrdU using peroxidase reaction with DAB
NOTE: Perform steps 4.1.1 to 4.1.5 on day 1.- Transfer slices from the cryoprotection solution to 0.1 M PBS at room temperature. Rinse three times for 10 min each, with 0.1 M PBS.
- Incubate slices for 30 min in endogenous peroxidase blocking solution to inactivate endogenous peroxidase. Rinse 3 times, 10 min each, with 0.1 M PBS. Optionally, perform antigen retrieval (see section 5). Incubate slices for 20 min with 2 N HCl at 37 °C. Rinse in 0.1 M borate buffer (8.5 pH) for 10 min. Rinse 3 times for 10 min each, with ice-cold 0.1 M PBS.
- Incubate slices for 2 h at room temperature with PBS++ (blocking solution). Incubate with anti-BrdU primary antibody (mouse host) at concentration of 1:250 in PBS+ overnight at 4 °C.
- On day 2, rinse the slices 3 times for 10 min each with 0.1 M PBS.
- Incubate with 1:250 HRP-conjugated secondary antibody (anti-mouse) in PBS+ for 2‒4 h at room temperature. Rinse 3 times for 10 min each with 0.1 M PBS.
- Transfer slices to DAB Peroxidase (HRP) Substrate solution and incubate for 2‒10 min. When slices become dark grey, visualize the tissue with a magnifying glass or a microscope. If positive cells are present, rinse 3 times (for 15 min each) with tap water (to reduce background). Wash 3 times for 10 min each with 0.1 M PBS.
- Carefully mount slices on gelatinized slides using a soft brush, air dry overnight at room temperature. Counterstain (see section 7.1), add permanent mounting medium and place coverslips. Store at 4 °C for up to 6 months.
- Detection of BrdU using peroxidase reaction with the avidin-biotin-peroxidase complex
NOTE: Perform steps 4.2.1 to 4.2.5 on day 1.- Transfer slices from the cryoprotection solution to 0.1 M PBS to bring to room temperature. Rinse 3 times for 10 min each with 0.1 M PBS.
- Incubate for 30 min with endogenous peroxidase blocking solution to inactivate endogenous peroxidase. Rinse 3 times for 10 min each in 0.1 M PBS. Optionally, perform antigen retrieval (see section 5).
- Incubate for 20 min with 2 N HCl at 37 °C. Rinse in 0.1 M borate buffer (pH 8.5) for 10 min. Wash 3 times for 10 min each with ice-cold 0.1 M PBS.
- Incubate for 2 h at room temperature in PBS++ (blocking solution).
- Incubate with anti-BrdU primary antibody (mouse host) 1:250 in PBS+ overnight at 4°C.
- On day 2, rinse 3 times for 10 min each with 0.1 M PBS.
- Incubate with 1:250 biotinylated secondary antibody (anti-mouse) in PBS+ for 2‒4 h at room temperature. Rinse 3 times for 10 min each with 0.1 M PBS.
- Incubate in the ABC solution for 1 h at room temperature. Rinse 3 times for 10 min each with 0.1 M PBS.
- Transfer slices to DAB peroxidase (HRP) substrate solution and incubate for 2‒10 min. When slices become dark grey, visualize the tissue with a magnifying glass or a microscope. If positive cells are present, rinse 3 times (15 min each) with tap water (to reduce background) followed by 3 times with 0.1 M PBS wash for 10 min each.
NOTE: Solution must be prepared immediately before use. Care should be taken to avoid brain slices sticking to each other due to irregular dark spots in the tissue. - Carefully mount slices on gelatinized slides using a soft brush and then air dry overnight at room temperature.
- Counterstain if needed (see step 7.1), add permanent mounting medium and place coverslips. Store at 4 °C for up to 6 months.
- Detection of BrdU by immunofluorescence using labeled Streptavidin-Biotin (LSAB) amplification
NOTE: Perform steps 4.3.1 to 4.3.4 on day 1.- Transfer slices from the cryoprotection solution to 0.1 M PBS at room temperature. Rinse 3 times for 10 min each with 0.1 M PBS. Optionally, perform antigen retrieval (see section 5).
- Incubate for 20 min in 2 N HCl at 37 °C. Rinse in 0.1 M borate buffer (8.5 pH) for 10 min. Rinse 3 times for 10 min each in ice-cold 0.1 M PBS.
- Incubate for 2 h at room temperature in PBS++ (blocking solution). Incubate with 1:250 anti-BrdU primary antibody (mouse host) in PBS+ overnight at 4 °C.
- On day 2, rinse 3 times for 10 min each with 0.1 M PBS.
- Incubate with 1:250 biotinylated secondary antibody (anti-mouse) in PBS+ for 2‒4 h at room temperature. Rinse 3 times for 10 min each with 0.1 M PBS. Incubate with 1:250 fluorochrome-conjugated streptavidin (Cy3) in PBS (do not use serum) for 1‒2 h at room temperature. Rinse 3 times for 10 min each with 0.1 M PBS.
NOTE: Serum can contain biotin and should not be added to diluents. Instead, use PBS containing 0.3% of Triton X-100. - Carefully mount slices on gelatinized slides using a soft brush, air dry overnight at room temperature, or mount immediately with an appropriate mounting medium.Counterstain (see step 7.2), add permanent mounting medium and place coverslips. Store at 4 °C for up to 6 months.
- Detection of BrdU by indirect immunofluorescence
NOTE: Perform step 4.4.1 to 4.4.4 on day 1.- Transfer slices from the cryoprotection solution to 0.1 M PBS until it reaches room temperature. Rinse 3 times for 10 min each with 0.1 M PBS. Perform antigen retrieval if required (optional, see section 5).
- Incubate for 20 min in 2 N HCl at 37 °C. Rinse in 0.1 M borate buffer (8.5 pH) for 10 min. Rinse 3 times for 10 min each with ice-cold 0.1 M PBS. Incubate for 2 h at room temperature with PBS++ (blocking solution). Incubate with 1:250 anti-BrdU primary antibody (mouse host) in PBS+ overnight at 4 °C.
- On day 2, rinse 3 times for 10 min each with 0.1 M PBS.
- Incubate with 1:250 fluorochrome-conjugated secondary antibody (anti-mouse) in PBS+ for 2‒4 h at room temperature. Rinse 3 times for 10 min each with 0.1 M PBS.
- Carefully mount slices on gelatinized slides using a soft brush, air dry overnight at room temperature, or mount immediately with an appropriate mounting medium. Counterstain (see step 7.2), add permanent mounting medium and place coverslips. Store at 4 °C for up to 6 months.
5. Antigen retrieval (optional)
NOTE: Antigen Retrieval is an optional step intended to correct the loss of antigenicity caused by fixation that modifies the tertiary and quaternary structure of many antigens, making them undetectable by antibodies. This step can be added to the original protocol.
- In a microwave or water bath, pre-heat 10 mM sodium citrate buffer (SCB) pH 6 solution to 90‒95 °C (depending on altitude, the solution starts boiling around this temperature). Fill 80% of a 50 mL conical tube (40 mL) with pre-heated SCB. Transfer slices to mesh inserts into the conical tube with SCB. Cover the tube with a screw cap with holes made with an 18‒20 G needle.
- Keep slices for 30 min in SCB at 80‒85 °C alternating warming cycles in the microwave at the minimum power level. If needed, refill the conical tube with SCB. Transfer slices immediately after along with the mesh inserts into ice-cold 0.1 M PBS and rinse 3 times for 10 min each.
6. Multiple immunostainings (optional)
NOTE: See the introduction section for the rationale behind this step.
- Simultaneous multiple immunostainings
- Prepare a cocktail with the primary antibodies to the target (e.g., mouse anti-BrdU, and rabbit anti -GFAP) in PBS+. Use different hosts for each primary antibody used. Incubate overnight at 4 °C. Continue with the same next steps for each protocol.
- Prepare a cocktail with the corresponding secondary antibodies for each primary antibody used (e.g., goat anti-mouse FITC, goat anti-rabbit TRITC) in the same diluent solution for each protocol. Continue with the same next steps for each protocol. Ideally, use secondary antibodies that come from the same hosts to avoid cross-reaction.
- Sequential multiple immunostainings.
- Follow the protocol for the first antibody target (e.g., mouse anti-BrdU) and stop before the mounting the slices. Incubate for 2 h at room temperature with PBS++ (blocking solution).
- Incubate the second primary antibody (e.g., rabbit anti -GFAP) in PBS+ overnight at 4 °C. Follow the next steps for each protocol, including the incubation of the second secondary antibody (e.g., goat anti-rabbit TRITC). Continue with the next steps for each protocol to the end.
7. Counterstaining (optional)
- For protocols using peroxidase reaction, pre-heat the cresyl violet solution to 60 °C. Hydrate the slides with ddH2O for 1 min. Incubate the slides in the hot cresyl violet solution for 5‒20 min.
- Rinse the slides with ddH2O for 1 min. Rinse the slides with 70%, 80%, 90% and 100% ethyl alcohol for 1‒3 min each. Rinse the slides with xylene for 1‒3 min.
- Add permanent hydrophobic mounting medium and place coverslips.
NOTE: Store at 4 °C for up to 6 months. Self-made mounting medium containing PVA (Polyvinyl alcohol)-DABCO can be employed.
- For protocols using immunofluorescence, add a small volume (25‒50 μL) of hydrophilic mounting medium with DAPI, propidium iodide or similar. Seal around the perimeter with nail polish or a plastic sealant. Store at 4 °C for up to 6 months.
8. Imaging and analysis
NOTE: See Table 2 for microscope setup specifications. Usually, counting the stained new cells is done using the peroxidase reaction stained slices (cheaper method), but it can also be performed using immunofluorescence.
- To quantify cells, first, identify the dentate gyrus properly with the 4x magnification lens (for further instructions on DG anatomical detail, see Amaral et al.16).
- Search the granular cell layer of the dentate gyrus for nuclei labeled with BrdU (using the 40x magnification lens). Perform cell search exhaustively along the z-axis since new cells can be distributed in different layers (see Video 1).
- Select an interval section for cell searching all over the dentate gyrus (e.g., every 6th section of tissue, equivalent to every 240 μm).
- Count all BrdU positive cells. The morphology of the labeled nucleus can change depending on how much BrdU the cell incorporated (see Figure 3 as a guide). Move slowly over the z-axis to quantify all several nuclei that integrate a cluster (see Video 2).
- Multiply the total number of counted cells with the interval section selected (e.g., 6) to estimate the total number of BrdU-labeled new cells.
- Ideally, in a regular experiment, count at least ten sections per animal and at least five animals per group.
- Image deconvolution (optional)
NOTE: Refer to the introduction section for important information about this step. This procedure needs monochromatic images (grayscale). Transform color images to grayscale. If the images are an RGB composite, first split the channels and merge them as a single image (not composite), then transform to 8-bit grayscale.- Create a z-stack file from micrographs.
- Create a point spread function (PSF) file opening the Diffraction PSF 3D plugin (https://imagej.net/Diffraction_PSF_3D) from the option Plugins menu. Fill out all the required data (see Table 2). Press OK and save the file.
- Open the DeconvolutionLab29 plugin from the option Plugins menu (http://bigwww.epfl.ch/deconvolution/deconvolutionlab2/). Drag the matched z-stack image and PDF file to the corresponding window slot.
- Select the deconvolution algorithm (e.g., Richardson-Lucy) and the number of iterations (e.g., 20). Press RUN.
- Combine the deconvoluted images into a single z-stack image selecting Stacks from the Image menu at the top. Then click Z Project. Select Max Intensity from the Projection Type dropdown menu, press OK and save the file.
- Create an RGB image using the single z-stack image file created in the step above with the desired pseudocolor selecting Color from the Image menu at the top. Then click on Merge Channels. Set the corresponding image to the desire color channel from the dropdown menu. Uncheck the box Create Composite, press OK and save the file (see Figure 4).
- If there is more than one channel image, repeat the steps 8.2.1‒8.2.5. Create an RGB image file following the step 8.2.6, opening at least two image files and selecting different color channels for each image file (see Figure 4).
Results
The methods described above were applied to quantify newborn cells in adult rat hippocampus after voluntary physical activity, in contrast with a control group without any extra physical activity. We used the postnatal rat hippocampus as a positive control. Male rats 3 months of age were under a voluntary physical activity protocol (endless wheel) for seven days. On day 6, rats were injected with BrdU (section 2), and every 12 h after until three complete injections. To complete three cell cycle divisions, the animals were transcardially perfused (section 3) 8 h after the last BrdU injection. The same procedure was used on three-month old rats which did not undergo physical activity to be used as a comparative control. As a positive control, one-day-old rat pups (postnatal day 1) were injected with BrdU one time, as described in section 2 above. One day after the injection (postnatal day 2), pups were euthanized, and their heads were immersed in PFA solution, as described in step 3.4. Adult rats were deeply anesthetized (step 3.1), transcardially perfused, as described in step 3.2. Brains were dissected and post-fixated (step 3.4). Brains were cut into 40 μm coronal sections (step 3.5). Sections were processed for BrdU immunohistochemistry, as described in step 4.
We used horseradish peroxidase reaction with DAB IHC for staining (step 4.1) and counting BrdU-positive cells in DG. Figure 5 shows a DG section with BrdU-labeled cells. Figure 5C,D shows a representative part of the DG section at higher magnification. Labeled cells showed intense dark staining, which were marked with arrows. The inset shows the average numbers of labeled cells in the experimental and control groups (counted positive cells multiplied by six as described in step 8.1). A Student’s t-test revealed significance differences between the numbers of BrdU-positive cells (t(10) = 2.704, p = 0.0222). The control group that did not undergo physical activity showed 2,040 ± 314 cells (n = 6 rats). In comparison, the physical activity group showed, on average, 3,606 ± 486 (n = 6 rats) BrdU-positive cells. As observed, physical activity exposure increases BrdU-positive cells. Therefore, these results are consistent with other reported results that show that physical activity increased cellular proliferation in the adult dentate gyrus17.
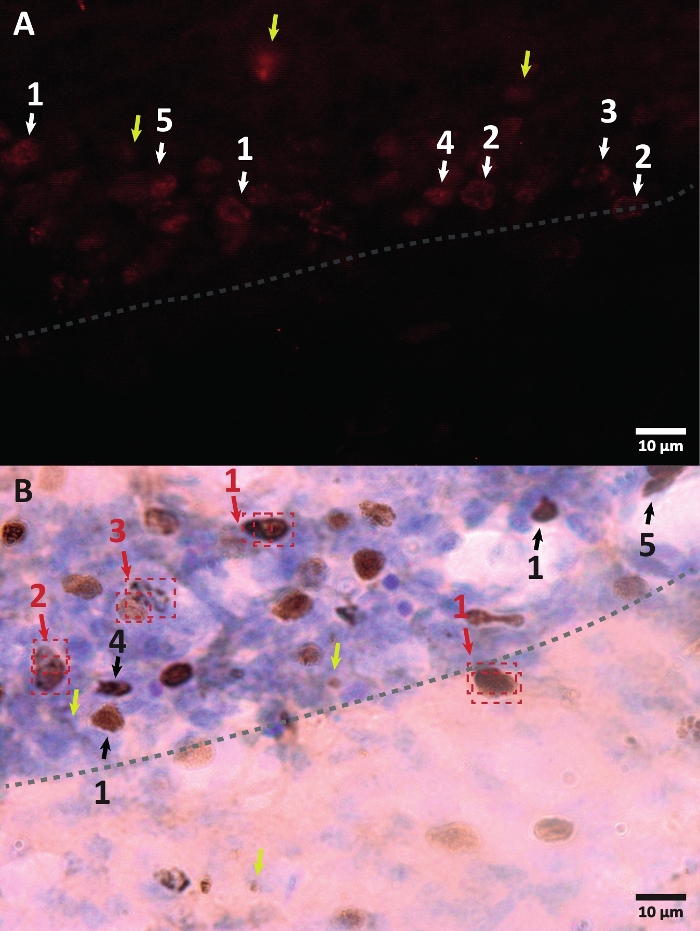
Figure 3: Examples of different morphology of BrdU-labeled cell nucleus. BrdU is a DNA synthesis marker which labels the nucleus. In the hippocampus region, the BrdU-positive nuclei had a semi-oval shape located in the dentate gyrus sub-granular zone. Since BrdU is incorporated by competition, the amount incorporated for every cell will have a variation that will later be reflected in how the nucleus will be visualized. (A) Immunofluorescence image. (B) An image using peroxidase reaction without an additional amplification method is presented. Yellow arrows show artifacts and non-specific signals. Black or white arrows show BrdU+ cells. 1 – Fully filed nucleus, semi-oval nuclei highly colored. 2 – Nuclei with dots, the border of the nuclei is marked and has inside several dots. 3 – Nuclei with few dots, the border of the nuclei are marked and have a small number of dots inside. 4 – Small nucleus is possible cells in a different differentiation stage but still part of the niche. 5 – Clusters are precursor cells under division, therefore several cells together in condensed groups can be observed. Within these groups, the counting must be done especially carefully to avoid mislabeling positive cells. Red arrows show the nucleus under division that can be confused to be a single cell. Each cell is enclosed in a box and can be distinguished in a Z-axis plane in real-time. Please click here to view a larger version of this figure.
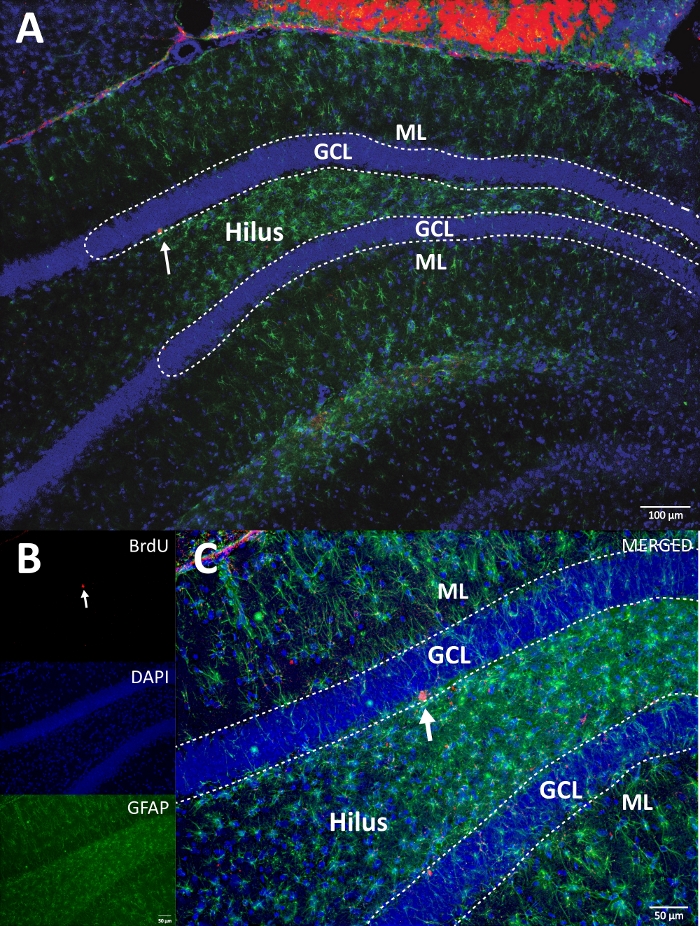
Figure 4: Representative RGB image for single and merged channels. The top image shows the original z-stack image, and the lower image shows the 3D deconvoluted z-stack image. (A) Low magnification of the DG. (B) RGB image for each channel, and (C) RGB merged image. This was a brain from the control group. Immunofluorescence was used without an additional amplification method. BrdU (red), DAPI as a counterstaining (blue), and GFAP (glial fibrillary acidic protein) as an astroglial marker (green). ML = molecular layer; GCL = granular cell layer; SGZ = subgranular zone. Please click here to view a larger version of this figure.
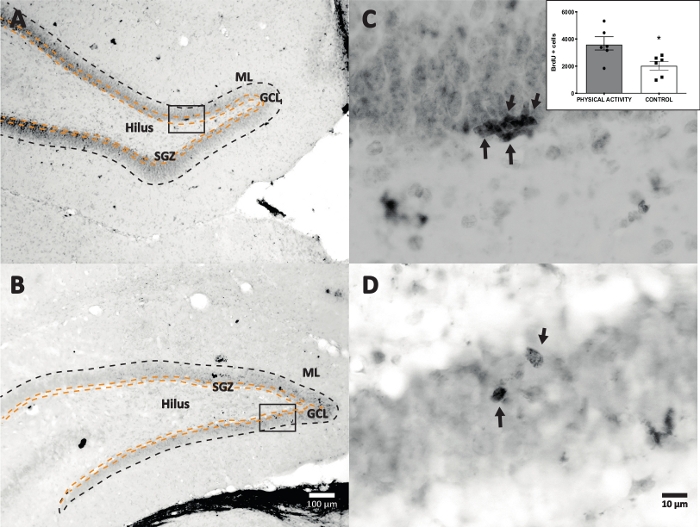
Figure 5: Representative DG section with BrdU labeled cells (intense dark) for each experimental group. The peroxidase reaction was used with the avidin-biotin-peroxidase complex amplification method. (A, B) Show a low magnification of the DG, and (C, D) show the box area at higher magnification. Panels A and C are tissues from the physical activity group, panels B and D are from the control group. The inset shows the average numbers of labeled cells in the physical activity and control groups (counted positive cells multiplied by six as described in step 8.1). ML = molecular layer; GCL = granular cell layer; SGZ = subgranular zone; arrows indicate BrdU+ cells. Please click here to view a larger version of this figure.
Video 1: Video showing a different focus of positive cells along the z-axis distributed in different layers. Please click here to download this video.
Video 2: Video showing a different focus of positive cell clusters along the z-axis distributed in different layers. Move slowly over the z-axis to quantify all several nuclei that integrate a cluster. Please click here to download this video.
| Microscope Type: | Epifluorescence Microscope Olympus BX53 | ||||
| Light Source: | High-pressure 130 W mercury arc lamp (U-HGLGPS) | ||||
| Acquisition Software: | CellSens Standard | ||||
| Filters Sets: | Catalog Number | Excitation Range | Dichromatic mirror | Suppression Range | |
| U-FUW | 340 - 490 nm | 410 nm | 420 nm | ||
| U-FBW | 460 - 495 nm | 505 nm | 510 nm | ||
| U-FGW | 530 - 550 nm | 570 nm | 575 nm | ||
| Camera: | Model: | CCD-camera UC50 | |||
| Spectral range: | 290 – 1000 nm | ||||
| CCD chip size: | 2/3 in, 2588 (Width *7) X 1960 (Height *8) pixels | ||||
| Pixel Size: | 3.4 X 3.4 µm | ||||
| Fluorochrome: | Name | Excitation Wavelength (nm) | Emission *3 Wavelength (nm) | Emission Color | |
| 4, 6-diamidino-2-phenyl-indole HCI (DAPI) | 345 | 455 | Blue | ||
| Tetramethylrhodamine-isothyocyanate (TRITC) | 541 | 572 | Red | ||
| Fluorescein-isothiocyanate (FITC) | 494 | 519 | Green | ||
| Cy3 | 552 | 565 | Red | ||
| Mounting Medium and immersion oil: | Name | Index of refraction of the media *1 | |||
| Air (nothing between the slide and the lens) | 1.00029 | ||||
| Antifade Mounting Medium with DAPI | 1.45 | ||||
| Permount Mounting Medium | 1.519 | ||||
| Low autofluorescence immersion oil (MOIL-30 Type F) | 1.518 | ||||
| Magnification Lens (Plan Fluorite) | Magnification | Numerical Aperture (NA) *2 | Resolution (µm) | Image pixel spacing (nm) *5 | Slice spacing Z-axis (nm) *6 |
| 4X | 0.13 | 2.12 | 850 | 3000 | |
| 10X | 0.3 | 0.92 | 340 | 3000 | |
| 20X | 0.5 | 0.55 | 170 | 2000 | |
| 40X | 0.75 | 0.37 | 85 | 1000 | |
| 100X | 1.3 | 0.21 | 34 | 1000 | |
Table 2: Microscope setup specifications and point spread function (PSF) file creation requirements. There are 11 slots in the diffraction PSF 3D plugin window to create the PSF file. Each slot is described as follows: *1 - Index of refraction of the media: index of refraction for the medium between the slide and the lens (e.g., air = 1.00029). *2 - Numerical Aperture: NA of lens used (it must be corrected when a different immersion media is used and lens was assigned to). *3 - Wavelength: Fluorochrome maximum emission wavelength (nm). *4 - Longitudinal Spherical Aberration: 0.00. *5 - Image pixel spacing: CCD pixel size (nm)/Magnification (e.g., 3.4 µm and 100X lens, 3400/100 = 34 nm). *6 - Distance between images Z-axis. *7 - Width: Enter the width of the image to be deconvolved in pixels. *8 - Height: Enter the height of the image to be deconvolved in pixels. *9 - Depth, slices: the number of images in the z-stack. *10 - Normalization: Sum of pixel values = 1. *11 - Title: Desired name for the PSF file. The file should match up with the unique given z-stack image.
Discussion
Adult neurogenesis is a process that occurs most frequently in niches of adult neural precursor cells that have the potential to generate new neurons throughout their lifespans. Bromodeoxyuridine (BrdU) labeling is widely used in immunology to characterize the number of newly generated cells in an adult brain. BrdU will be mainly incorporated into cells of discrete brain regions (neurogenic zones). These cells are located in the sub-ventricular zone (SVZ), the dentate gyrus of the hippocampus—between the hilus and granular cells know as sub-granular zone (SGZ)1,2,18. Moreover, there are different brain regions characterized by a lower proliferative capacity in adulthood, including the hypothalamus, striatum, neocortex, and amygdala19. As mentioned before, BrdU staining is the commonly used method for adult neurogenesis research to detect cell proliferation. However, the use of BrdU as a marker has limitations and pitfalls. The first one is that BrdU is a cell cycle marker. Therefore, double or triple staining must be performed to identify the cell fate and include cell markers to detect the specific developmental stage of the cells labeled. One more concern about BrdU is that it is a toxic and mutagenic solution that modifies DNA stability may alter cellular function and cell cycles. Consideration should be given to the previous information when deciding to follow an administration protocol and administration doses (50‒600 mg/kg). Another crucial feature is that BrdU is a DNA synthesis marker, not a cell proliferation marker14. Therefore, it is relevant to distinguish cell proliferation from other events such as a DNA repair, abortive cell cycle re-entry, and gene duplication. Researchers must follow appropriate controls to ensure the appropriate use of BrdU. For a more detailed discussion about these problems and limitations, we recommend reviewing Taupin's work14. The standardization process of an immunohistochemistry protocol could be slow and challenging. In this work, we have presented all the general steps to manage a successful IHC protocol. However, we recommend that every research group test and evaluate tissue, antibodies, and conditions in advance. Tests and evaluations must be carried out with at least three different levels of incubations, washing steps, and strengths for each antibody and tissue tested. We also recommend that researchers review additional protocols to be able to choose the best one that meets specific needs and requirements20,21,22,23,24,25.
As mentioned previously, the procedure involves several steps and methodological considerations that are commonly used and mentioned in scientific articles, which will be later discussed. We recommend that researchers choose the antibodies carefully and correctly in terms of technique, budget, equipment, setup, and main research goal. Antibodies must be tested with the same type of tissue that will be later tested in the experiment. We also recommend the use of an antibody that was tested for the same purpose (IHC) (i.e., not just in western blot or flow cytometry techniques) to test its compatibility with the fixation technique. Different routes could be used to administer the BrdU staining such as intraperitoneal injection, intraperitoneal infusion, oral ingestion, or intraventricular infusion (for a more detailed description of each technique, see reference26). If the intraperitoneal injection is selected, make sure that BrdU is administrated into the peritoneal cavity avoiding the intestine area. Since the intestine has several cells in duplication that can exhaust the BrdU before it gets to the brain which will affect the number of labeled cells. It is crucial to obtain thin sections since they allow a better penetration of solutions. Coronal slices of 40 µm thick were cut rostro-caudally and were transferred into a 24-well cell culture plate, following the stereological procedure proposed by Kempermann et al.27. The immunohistochemistry can be carried out with tissue mounted on slides or as free-floating sections. Since BrdU is located deep in cells nuclei, it allows the penetration of solutions in free-floating sections which provides better results and better access to the area of interest. It is important to open DNA bonds (DNA denaturation) to allow the primary anti-BrdU antibody access. In this work, we carried out these specific procedures with the use of HCI incubation. On the other hand, the process of blocking unspecific epitopes allowed a more accurate identification of cell signal.
The good membrane permeabilization allows the antibodies to properly penetrate the interest area. Adding a permeabilizer such as Triton X-100 to PBS++ and PBS+ solutions improves membrane permeabilization. Both PBS and Tris-buffered saline (TBS) reagents can be used in this protocol. In terms of budget, the TBS could be relativity cheaper than the PBS. However, PBS could interfere with anti-phosphate antibodies and inhibit alkaline phosphatase-conjugated antibodies, so avoid the use of PBS if the target is post translationally modified by phosphorylation (i.e., phosphorylated). We used the PBS for this work, and we found out that tissue washing steps gave a more specific signal. We also recommend researchers to carry out at least three washing cycles using either TBS o PBS. The solutions must be freshly prepared. Antigen retrieval (AR) is a method intended to reduce the loss of antigenicity caused by the fixation which modifies the tertiary and quaternary antigens' structure. This reduction makes antigens undetectable by antibodies28,29. The heat-induced epitope retrieval (HIER) used in this protocol attempted to reverse the chemical reactions between formaldehyde and proteins by high temperature or strong alkaline hydrolysis (with other buffer solutions as EDTA pH 8.5 or Tris pH 9.5). It is essential to test new antibodies with different AR protocols to compare results and choose the best one for the protocol. This last step might be optional in a regular protocol; however, we treated tissues with an antigen retrieval protocol to provide better results for this protocol.
It is crucial to select the correct final contrasting color and the counterstain technique in consideration of the primary staining color and method used to make a non-staining structure visible and avoid masking the primary staining color from the immune reaction. For the fluorescence microscopy, the DAPI (4', 6-diamidino-2-phenylindole) is a very popular nuclear and chromosome counterstain that emits blue fluorescence (absorption: 360 nm, emission: 460 nm) upon binding to AT regions of DNA. DAPI-containing mounting medium is available and is easy to use; this provides excellent signal retention for image acquisition. For the peroxide reaction, IHC was available in different options such as cresyl violet, hematoxylin, neutral red, or methyl green staining. For multiple immunostaining techniques, it is crucial to choose a compatible antibody with the fixation technique used to avoid cross-reactivity30. When issues and complications with single staining are solved, administer another color staining as deemed necessary. It is crucial to control the non-specific binding between the secondary antibodies. This could be done by saturating the primary antibodies before using a secondary antibody produced in the same host species of the primary antibodies. For example, when using anti-mouse produced in rabbit and anti-rabbit produced in goat secondary antibodies, the anti-rabbit produced in goat antibody must be used before the anti-mouse produced in rabbit antibody. When the sequential method is dominated completely, then the simultaneous immunostaining process can be initiated. In this method, it is essential to choose secondary antibodies appropriately. Ideally, all those antibodies must come from the same host animal to avoid cross-reactivity. We recommend running a positive control to confirm that the staining method works accurately in postnatal hippocampus tissue (abundant neurogenesis around this age). If the positive control tissue shows staining problems, review and go over the procedure, make corrections and adjustments, and repeat until a good staining is produced. Then, run a negative control to test that the antibody works correctly by omitting or replacing a particular primary antibody with normal serum (same species as the primary antibody). As mentioned in the introduction, image deconvolution is a powerful tool and provides an alternative when a confocal microscope is not available. It can apply the image deconvolution to all images gained using transmitted light bright-field, wide-field fluorescence, and confocal fluorescence microscopy. The ultimate purpose of image deconvolution is to reconstruct the original signal that the acquisition system deteriorates10.
In summary, the identification of the newly generated cells visualized by the immunodetection of thymidine analog BrdU is a complicated but powerful technique. This work is an attempt to help scientists, particularly in the field of adult hippocampal neurogenesis, to quantify new cells more accurately. We hope that this effort has been helpful to the scientific community and makes it easier to fine-tune the study of cell proliferation by the immunohistochemistry technique.
Disclosures
The authors have nothing to disclose.
Acknowledgements
We would like to thank Mr. Miguel Burgos, and Gustavo Lago for providing technical assistance. We also want to thank Dr. Clorinda Arias, Dr. Karla Hernandez and Dr. Oscar Galicia for their kind support in providing reagents and material. We also thank División de Investigación y Posgrado of the Universidad Iberoamericana Ciudad de México for providing funding for the performance of this work and for covering video production expenses.
Materials
| Name | Company | Catalog Number | Comments |
|---|---|---|---|
| REAGENT PREPARATION AND SETUP | |||
| Donor Horse Serum | BioWest | S0900 | Blocking and incubation solutions in PBS |
| Paraformaldehyde reagent grade, crystalline (PFA) | Sigma-Aldrich | P6148 | toxic, flammable |
| Potassium Chloride | Sigma-Aldrich | 746436-500G | |
| Potassium Phosphate, monobasic | J.T Bker | 3246-01 | |
| Sacarose | J.T Baker | 4072-01 | |
| Sodium Chloride | Meyer | 2365-500G | |
| Sodium Hydroxide | Sigma-Aldrich | S5881-500G | Corrisive, to calibrate pH |
| Sodium Phophate Dibasic | Sigma-Aldrich | S9763-5KG | |
| Triton-x 100 | Sigma-Aldrich | T8787 | |
| THYMIDINE ANALOGUE BRDU ADMINISTRATION | |||
| 5-Bromo-2′-deoxyuridine, BrdU | Sigma-Aldrich | B9285 | toxic (mutagenic, teratogenic) |
| 23–27G hypodermic needle | BD PrecisionGlide | ||
| Saline solution | PiSA | 30130032 | |
| Syringes 1 mL | NIPRO | ||
| TISSUE PREPARATION | |||
| 15-ml polypropylene conical tube | Thermo Scientific | 339650 | |
| 50-ml polypropylene conical tube | Thermo Scientific | 339652 | |
| Dissecting tools | |||
| Guillotine | Stoelting | ||
| Microtome Cryostat | MICROM | HM525 | |
| Netwell 15 mm polyester mesh membrane inserts | Corning | 3477 | pre-loaded in 12-well culture plates |
| Netwell plastic 12-well carrier kit | Corning | 3520 | for 15 mm polyester mesh membrane inserts |
| Netwell plastic 6-well carrier kit | Corning | 3521 | |
| Perfusion pump | Cole-Parmer | 7553-70 | |
| Shaker | IKA | ROKCER 3D Digital | |
| IMMUNOSTAINING | |||
| Cresyl violet | Sigma-Aldrich | C5042 | 1%, Light sensitive |
| DAB Peroxidase (HRP) Substrate Kit (with Nickel), 3,3’-diaminobenzidine | Vector Laboratories | SK-4100 | carcinogenic, light sensitive |
| Hydochloric Acid | J.T.Baker | 9535-05 | Corrosive, to calibrate pH |
| Hydrogen Peroxide, 50% | Meyer | 5375-1L | Toxic, oxidative |
| Permount Mounting Medium | Fisher Chemical | SP15-500 | |
| VECTASHIELD Antifade Mounting Medium with DAPI | Vector Laboratories | H-1200 | Light sensitive |
| VECTASTAIN® Elite® ABC Kit Peroxidase (HRP) | Vector Laboratories | PK-6100 | enzymatic, avidin/biotin based amplification system |
| Primary antibodies | |||
| Anti-GFAP antibody produced in rabbit | Sigma-Aldrich | HPA056030 | 1:500 |
| Monoclonal Anti-BrdU antibody produced in Mouse | Sigma-Aldrich | B2531 | 1:250 |
| Secondary antibodies | |||
| Biotin-SP (long spacer) AffiniPure Donkey Anti-Mouse IgG (H+L) | Jackson ImmunoResearch | 715-065-151 | 1:250 |
| Goat anti-Mouse IgG (H+L) Cross-Adsorbed Secondary Antibody, HRP | Invitrogen | G-21040 | 1:1000 |
| Goat Anti-Mouse IgG (whole molecule), TRITC | Sigma-Aldrich | T5393 | 1:250 |
| Goat Anti-Rabbit IgG (H+L) Cross-Adsorbed, FITC | Invitrogen | F-2765 | 1:250 |
| Streptavidin, Cy3 | Vector Laboratories | SA-1300 | 1:250 |
| IMAGING AND ANALYSIS | |||
| Computer | Dell Computer Company | T8P8T-7G8MR-4YPQV-96C2F-7THHB | For controlling and monitoring protocols’ processes |
| CCD-camera | Olympus | UC50 | |
| CellSens Standard software | Olympus | cellSens Standard Edition | Acquisition Software |
| Epifluorescent microscope | Olympus | BX53 | |
| High-pressure 130 W mercury arc lamp | Olympus | U-HGLGPS | |
| low autofluorescence immersion oil | Olympus | MOIL-30 Type F | |
| Micro cover-glasses (VWR, cat no 48404 454; 24 60 mm) | |||
| Microscope slides (VWR, cat no 48323-185; 76 26 mm) | |||
| U-FBW filter cube | Olympus | U-FBW | excitation 460 - 495 nm, dichroic mirror 505 nm, suppression 510 nm |
| U-FGW filter cube | Olympus | U-FGW | excitation 530 - 550 nm, dichroic mirror 570 nm, suppression 575 nm |
| U-FUW filter cube | Olympus | U-FUW | excitation 340 - 490 nm, dichroic mirror 410 nm, suppression 420 nm |
References
- Altman, J. Are new neurons formed in the brains of adult mammals. Science. 135 (3509), 1127-1128 (1962).
- Altman, J., Das, G. D. Autoradiographic and histological evidence of postnatal hippocampal neurogenesis in rats. The Journal of Comparative Neurology. 124 (3), 319-335 (1965).
- Miller, M. W., Nowakowski, R. S. Use of bromodeoxyuridine-immunohistochemistry to examine the proliferation, migration and time of origin of cells in the central nervous system. Brain Research. 457 (1), 44-52 (1988).
- Eriksson, P. S., et al. Neurogenesis in the adult human hippocampus. Nature Medicine. 4 (11), 1313-1317 (1998).
- Filippov, V., et al. Subpopulation of nestin-expressing progenitor cells in the adult murine hippocampus shows electrophysiological and morphological characteristics of astrocytes. Molecular and Cellular Neuroscience. 23 (3), 373-382 (2003).
- Kempermann, G., Jessberger, S., Steiner, B., Kronenberg, G. Milestones of neuronal development in the adult hippocampus. Trends in Neurosciences. 27 (8), 447-452 (2004).
- Matiašová, A., et al. Flow cytometric determination of 5-bromo-2'-deoxyuridine pharmacokinetics in blood serum after intraperitoneal administration to rats and mice. Histochemistry and Cell Biology. 142 (6), 703-712 (2014).
- Von Bohlen Und Halbach, O. Immunohistological markers for proliferative events, gliogenesis, and neurogenesis within the adult hippocampus. Cell and Tissue Research. 345 (1), 1-19 (2011).
- Sage, D., et al. DeconvolutionLab2: An open-source software for deconvolution microscopy. Methods. 115, 28-41 (2017).
- Manz, W., Arp, G., Schumann-Kindel, G., Szewzyk, U., Reitner, J. Widefield deconvolution epifluorescence microscopy combined with fluorescence in situ hybridization reveals the spatial arrangement of bacteria in sponge tissue. Journal of Microbiological Methods. 40 (2), 125-134 (2000).
- Schindelin, J., et al. Fiji: An open-source platform for biological-image analysis. Nature Methods. 9 (7), 676-682 (2012).
- Abràmoff, M. D., Magalhães, P. J., Ram, S. J. Image processing with imageJ. Biophotonics International. 11 (7), 36-41 (2004).
- Giannini, A., Giannini, J. 2D and 3D Fluorescence Deconvolution Manual. , Available from: https://pages.stolaf.edu/wp-content/uploads/sites/803/2016/12/Giannini_Giannini_Deconvolution_Manual_20161215.p (2016).
- Taupin, P. BrdU immunohistochemistry for studying adult neurogenesis: Paradigms, pitfalls, limitations, and validation. Brain Research Reviews. 53 (1), 198-214 (2007).
- Revilla, V., Jones, A. Cryostat sectioning of brains. International Review of Neurobiology. 47, 61-70 (2002).
- Amaral, D. G., Scharfman, H. E., Lavenex, P. The dentate gyrus: fundamental neuroanatomical organization (dentate gyrus for dummies). Progress in brain research. 163, 3-22 (2007).
- Eadie, B. D., Redila, V. A., Christie, B. R. Voluntary exercise alters the cytoarchitecture of the adult dentate gyrus by increasing cellular proliferation, dendritic complexity, and spine density. Journal of Comparative Neurology. 486 (1), 39-47 (2005).
- Leal-Galicia, P., Romo-Parra, H., Rodríguez-Serrano, L. M., Buenrostro-Jáuregui, M. Regulation of adult hippocampal neurogenesis exerted by sexual, cognitive and physical activity: An update. Journal of Chemical Neuroanatomy. 101, 101667(2019).
- Gould, E. How widespread is adult neurogenesis in mammals. Nature Reviews Neuroscience. 8 (6), 481-488 (2007).
- Ngwenya, L. B., Peters, A., Rosene, D. L. Light and electron microscopic immunohistochemical detection of bromodeoxyuridine-labeled cells in the brain: Different fixation and processing protocols. Journal of Histochemistry and Cytochemistry. 53 (7), 821-832 (2005).
- Ansorg, A., Bornkessel, K., Witte, O. W., Urbach, A. Immunohistochemistry and multiple labeling with antibodies from the same host species to study adult hippocampal neurogenesis. Journal of Visualized Experiments. (98), e52551(2015).
- Tuttle, A. H., et al. Immunofluorescent detection of two thymidine analogues (CldU and IdU) in primary tissue. Journal of Visualized Experiments. (46), e2166(2010).
- Tischler, A. S. Triple immunohistochemical staining for bromodeoxyuridine and catecholamine biosynthetic enzymes using microwave antigen retrieval. Journal of Histochemistry and Cytochemistry. 43 (1), 1-4 (1995).
- Taupin, P. Protocols for studying adult neurogenesis: Insights and recent developments. Regenerative Medicine. 2 (1), 51-62 (2007).
- Leuner, B., Glasper, E. R., Gould, E. Thymidine analog methods for studies of adult neurogenesis are not equally sensitive. Biosystems. 517 (2), 123-133 (2010).
- Magavi, S. S., MacKlis, J. D. Identification of newborn cells by BrdU labeling and immunocytochemistry in vivo. Methods in Molecular Biology. 438, 335-343 (2008).
- Kempermann, G., Gast, D., Kronenberg, G., Yamaguchi, M., Gage, F. H. Early determination and long-term persistence of adult-generated new neurons in the hippocampus of mice. Development. , 391-399 (2003).
- Ramos-Vara, J. A., Beissenherz, M. E. Optimization of immunohistochemical methods using two different antigen retrieval methods on formalin-fixed, paraffin-embedded tissues: Experience with 63 markers. Journal of Veterinary Diagnostic Investigation. 12 (4), 307-311 (2000).
- Ramos-Vara, J. A. Principles and methods of immunohistochemistry. Methods in Molecular Biology. 1641, 115-128 (2017).
- Wojtowicz, J. M., Kee, N. BrdU assay for neurogenesis in rodents. Nature Protocols. 1 (3), 1399-1405 (2006).
Reprints and Permissions
