We present a method specifically tailored to image the whole brain of adult Drosophila during behavior and in response to stimuli. The head is positioned to allow optical access to the whole brain, while the fly can move its legs and the antennae, the tip of the proboscis, and the eyes can receive sensory stimuli.
Method Article
Preparing Adult Drosophila melanogaster for Whole Brain Imaging during Behavior and Stimuli Responses
In This Article
Summary
Abstract
We present a method developed specifically to image the whole Drosophila brain during ongoing behavior such as walking. Head fixation and dissection are optimized to minimize their impact on behavior. This is first achieved by using a holder that minimizes movement hindrances. The back of the fly’s head is glued to this holder at an angle that allows optical access to the whole brain while retaining the fly’s ability to walk, groom, smell, taste and see. The back of the head is dissected to remove tissues in the optical path and muscles responsible for head movement artefacts. The fly brain can subsequently be imaged to record brain activity, for instance using calcium or voltage indicators, during specific behaviors such as walking or grooming, and in response to different stimuli. Once the challenging dissection, which requires considerable practice, has been mastered, this technique allows to record rich data sets relating whole brain activity to behavior and stimulus responses.
Introduction
Imaging brain activity using various techniques have deepened the understanding of brain function. In humans, brain imaging techniques have important limitations: while functional magnetic resonance imaging (fMRI) offers spatio-temporal resolution far below single neuron resolution, fast techniques such as electroencephalography (EEG) only allows indirect and partial access to the brain1. In sufficiently big animal models such as rodents, recording of fluorescent activity sensors (e.g., GCaMP) using head-mounted microscopes permits to observe brain activity while the animal is moving in its environment2. Nevertheless, these techniques currently give access only to a small portion of the brain. Head-fixed animals can be imaged more comprehensively, but coverage is still partial (e.g., the cortex surface3). It is only in small animals, such as the zebrafish larvae, C. elegans and Drosophila that the whole brain can be imaged with temporal and spatial resolution at the level of or close to single neurons4.
D. melanogaster is particularly promising because it has long been used as a genetic model organism5 and powerful genetic tools have been developed6. Complemented by the new large scale anatomical network derived from electron microscopy7, the fly could provide unique opportunities to study complex brain dynamics generated on a large scale network8. Although the cuticle is not transparent, and must thus be removed to image the brain, in vivo functional imaging has become more and more common place since the first study in 20029 and several protocols have already been published. However, these methods involve either separating the fly head from the body10, severely restricting the fly’s movements and/or responses to stimuli11,12,13,14,15, or only permitting a small part of the brain to be imaged9,16,25,26,27,17,18,19,20,21,22,23,24. To complement these nevertheless powerful approaches, we recently developed a preparation to image the whole brain during behavior and responses to various stimuli28.
Here, we build upon this study to present a method specifically developed to image the whole brain while the fly performs semi-naturalistic behavior (i.e. walking and grooming) and responds to sensory stimuli. This is achieved by using an observation holder designed to give access to the whole brain from the dorsal-posterior side, while leaving the antennae and proboscis intact, and permitting the fly to move its legs to walk (e.g., on an air-cushioned ball). Steps for dissecting the back of the head have been refined for speed, reproducibility, and to minimize their effect on the viability and mobility of the fly.
Protocol
All steps are performed under a stereomicroscope.
1. Preparing the holder
- Print the holder ‘FlyholderVJove.stl’ (see Supplementary Material) with a 3D printer or have it printed using online services (Figure 1A). Both SLS (Nylon PA12) and multijet fusion (PA12) are suitable.
- Create the head slot.
- Place a piece of sticky tape rectangularly on a flat surface. Cut a slice of approximately 5 mm x 1 cm. Cut the neck slot (~400 x 400 µm) in the middle of the longer side of the tape using fixed parallel blades (two scalpel blades stuck together) to ensure the same width in every holder (Figure 1B).
- Place the tape over the flatter side of the hole in the holder on the bottom side (see Figure 1C and Figure 1D). The tape can be deformed by pushing it down with forceps ~500 µm around the hole; this will further minimize hindering later fly movements.
- Cover the tape and the holder from the top with black nail polish to prevent the buffer from leaking out. The black nail polish will also protect the fly’s eyes from the excitation light of the microscope. Let the nail polish dry at least an hour before using the holder.
- Once the nail polish is dry, add ~1 µL of grease in the head slot using a rolled tissue to ensure the glue will not wet the back of the fly’s head (Figure 2A). Make sure not to put grease outside of the slot that would prevent the glue from sticking.
- Create the body slot (Figure 2B).
- Optionally, prepare the tape that will be used to position the fly’s body (see below) in advance. Use the design shown in Figure 2B (top) to cut a piece of ~2 cm wide tape in two and cut 1.5 mm wide slices. Cut out 0.3 mm deep shoulders and body slot. Make sure that it fits the holder.
NOTE: The variability between fly sizes (in particular with sex, age, genotype or species) can make it necessary to adjust the tape design. If the head tends to be ill-centered, it can be helpful to add a V-shaped piece of tape temporarily over the neck slot (Figure 3). Also apply a few microliters of grease inside the neck slot and on the V-shaped tape.
- Optionally, prepare the tape that will be used to position the fly’s body (see below) in advance. Use the design shown in Figure 2B (top) to cut a piece of ~2 cm wide tape in two and cut 1.5 mm wide slices. Cut out 0.3 mm deep shoulders and body slot. Make sure that it fits the holder.
2. Placing the fly
NOTE: One to four days old female flies are ideal because the female head is bigger and thus easier to dissect than the male head, and younger flies have softer cuticle. For walking experiments the activity of the fly can be increased by matching the experiments with times of higher circadian activity (ZT0 or ZT11), by using saline containing glucose (such as 103 mM NaCl, 3 mM KCl, 5 mM TES, 8 mM trehalose 2 H2O, 10 mM glucose, 26 mM NaHCO3, 1 mM NaH2PO4, 2.5 mM CaCl2·2 H2O, 4 mM MgCl2·6 H2O), by starving the fly up to 24 h with a water only environment, and by heating the environment to ~28 °C during the experiment. Clipping the wings at least one day in advance also helps to decrease attempts to fly and thus increase the frequency of walking bouts7,29,30.
- Fill a Petri dish or pipette tip box lid with ice, place a laboratory tissue on top of the ice and set the holder upside down on it.
- Transfer a fly on ice to paralyze it by sucking it from its vial into a tube and blowing it onto the ice (make sure the ice is not melted which would drown the fly).
- When the fly stops moving, use dull forceps to slide it into the holder with the neck inside the slot (the fly can be held at the basis of the wing) as in Figure 4 (left). The eyes should be at equal positions in respect to the sides of the slot (Figure 4, middle). If needed, add 1 µL grease on the top of the head to prevent the glue (see next step) from reaching the back of the head and remove later.
- Cover the body with a tissue and some ice to make sure the fly does not move during this step and the next (Figure 4, right). Another option to prevent the legs from reaching the head is to use a piece of tape just below the head (see Figure 6).
3. Securing the head
- Place the head at a ~20° angle from a fully posterior view (around the lateral axis, see Figure 5A). This is a compromise between decreasing the depth to image and on the other side maintaining the front leg free to move and minimizing the stretch of the neck.
- With a rolled-up tissue (Figure 5B), put UV-glue around the head while avoiding soiling the sensory area of interest (antennae, proboscis and/or eyes). For taste experiments, pull the proboscis out and add glue at its base to prevent movement. If no taste experiment is planned, the proboscis is best pushed into the head and fixed with glue to minimize movement (Figure 6).
- Cure the glue with UV-light for 5 s. Carefully clean the surrounding of the head with a rolled-up tissue to remove remaining liquid glue that could stick to the legs and/or soil sensory areas.
NOTE: The tape can be roughed with sandpaper to increase glue adhesion if necessary. - Use a thin strip of tape or a rolled-up tissue to move the legs to the front (if they are not already), so they will not be damaged by the next step.
4. Positioning the body
NOTE: This step needs to be performed fast; before the fly recovers from anesthesia.
- Remove the ice container and turn the holder around. Remove the water around the fly with a tissue.
- Place the body slot tape (created in step 1) over the hole and gently push the fly’s body down (Figure 7). Be careful to not stretch the neck too much.
5. Sealing the hole
- Cover any remaining large holes with tape.
- Add ~1 µL of grease to the back of the head and in the neck area to make sure no glue will wet there.
- With a rolled-up tissue, paint UV-glue around and on top of the tape and on the thorax (upper dorsal part of the mesonotum) to fix it. Cure the glue with UV-light for ~5 s.
NOTE: It is important to minimize the use of UV light as it can strongly affect the fly’s health. - Carefully clean grease and uncured glue with a laboratory tissue.
- Put ~1 mL of saline on top of the head. Push air bubbles aside with forceps. Look for leaks by placing a coverslip over the saline and turning the holder around to check for saline on the front side. If there are any leaks, remove the saline and fix the hole (either by adding more glue or more grease).
NOTE: This can be a good time to pause if necessary. The fly can be offered a small piece of tissue or Styrofoam ball to walk on to prevent flailing and calm the fly down.
6. Dissecting the head
NOTE: Use sharpened forceps for the following steps. Very fine forceps are critical as dull forceps will make it more difficult to open the head cuticle and may lead to additional injuries on the fly’s head or brain. Strong magnification can help at this stage. To that aim, one can replace the oculars of the binocular microscope with 30x oculars.
- Make two cuts at the base of the central dark cuticular triangle on each side of the neck (see crosses in Figure 8A).
- Cut around the dark triangle and remove this part of the cuticle.
- The hole in the brain through which muscle 16 and the esophagus go should now be visible and move rhythmically (Video 1 presents this rhythmic movement in a fly with fluorescent muscles). Carefully pinch the top of this area to cut muscle 16 without puncturing the esophagus. If the rhythmic movement of the brain stopped, muscle 16 was likely removed, however, the movement sometimes pauses and restarts later. It is thus important to pay attention to rhythmic movements and perform this step again if necessary.
- Cut the remaining cuticle in small pieces and remove them carefully. Try not to pull on the cuticle too much. Instead use the forceps like a pair of scissors, to cut pieces of tissue. One can start on the medial edges, where the dark triangle was removed before and work one’s way to the sides.
NOTE: Pieces of cuticle can be used to gently scrape of fat bodies if present. - Remove the air sacks one piece after the other by grabbing them with the forceps and pulling slowly and steadily.
Results
The preparation described above allows observation of the whole brain under a microscope for large scale 3D imaging such as classical 2 photons or confocal microscopy, but also faster techniques such as light sheet31 and other structured illumination microscopy techniques (reviewed in32), or light field microscopy28.
The access to the whole brain while observing the behavior and maintaining functional sensory organs allows to answer several questions.
First, what is the overall brain activity when the fly is at rest, during behavior, and when it responds to stimuli? As an example, we include data obtained with a light field microscope showing brain activation during responses to stimuli and behavior. For example, in Video 2, a calcium probe was expressed in all neurons (nsyb-GAL4 and UAS-syt-GCaMP6s (left) or UAS-GCaMP6M (right)) and a puff of odor was presented. Notice how the preparation allows to get an overview of brain activity during the response to the stimulus. The powerful genetic tools in Drosophila can be used to restrict the expression of these sensors to specific neuronal subtypes. In Video 3, we restricted the expression of a calcium sensor to dopaminergic and serotoninergic neurons (TH-GAL4, DDC-GAL4 and UAS-GCaMP6M). Notice the strong synchronous activity over the brain tightly correlated with the fly walking, allowed by observing the whole brain during behavior. In addition to calcium activity, other physical or chemical signals can be imaged (using for example sensors for voltage28,33, metabolism products34,35 or specific neuromodulators36).
To understand brain activity’s role more specifically, we can ask what regions are involved in what behavior, response to stimuli or spontaneous patterns of activity. The data can indeed be used as an unbiased screen to extract functional regions using techniques such as principal component analysis and independent component analysis. Figure 9A shows different functional regions in different colors. The shape and localization of the functional regions allow to map them to anatomical templates to identify brain regions and in some cases neuron type. Furthermore, once aligned to the anatomical template, fluorescence values can be averaged in anatomical brain regions for quantitative analysis (see Figure 9B). For example, a hierarchical gaussian model applied to data in Figure 9B shows that regions are more active during walk (with a ΔF/F median of 0.029, 95% credible interval=[0.017 0.041]) but not during groom (ΔF/F median = -0.0049 with 95% credible interval=[-0.016 0.0059]).
Adding to the understanding depth, the simultaneous recordings of the different functional regions allowed by the preparation can be used to study the dynamical properties of the functional network. This is important because brain regions in all brains studied so far are highly recurrently interconnected and more and more studies show that even sensory areas respond to the animal’s behavioral state. Several aspects can be looked at such as functional graph properties (e.g., modules) and spatio-temporal patterns that can be fit with dynamical systems (see8 for examples).
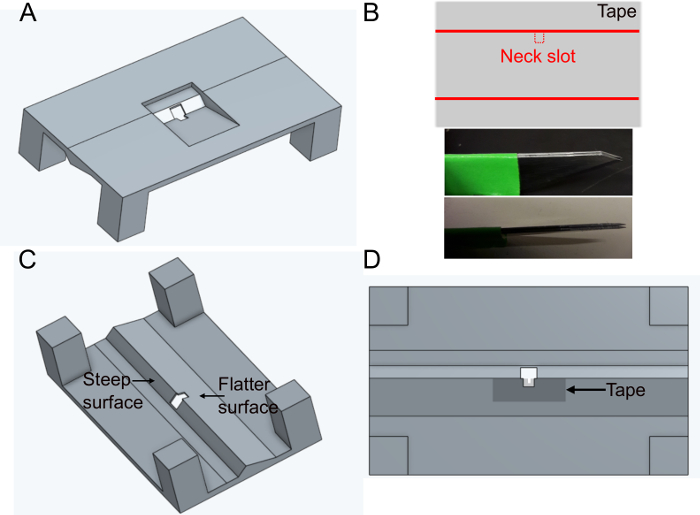
Figure 1: Preparing the holder (step 1). A) Holder design (view from the top). B) Neck slot preparation. top: tape design, bottom: parallel blades used to cut the neck slot. C) View of the holder from below. D) Bottom view indicating where to add the neck slot tape. Please click here to view a larger version of this figure.
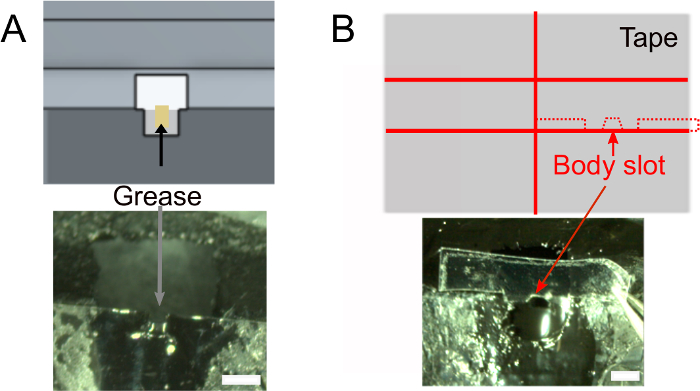
Figure 2: Further preparations (step 1). A) Add grease into the neck slot to prevent glue to cover the back of the head and to prevent saline leaks. Scale bars, 1 mm. B) Top: shape of the piece of tape that will be used to push the body down. Bottom: make sure the tape fits the holder. Please click here to view a larger version of this figure.
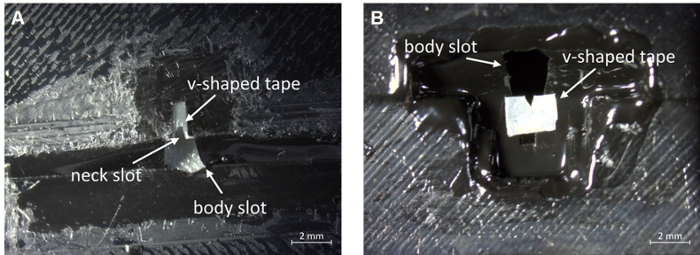
Figure 3: Placement of a v-shaped piece of tape to aid centering. (A) Bottom view. (B) Top view. Scale bar, 2 mm. Please click here to view a larger version of this figure.
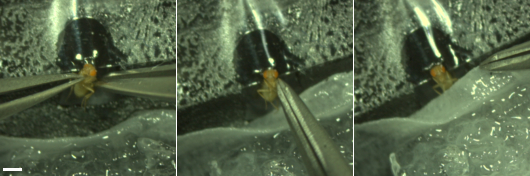
Figure 4: Place the fly (step 2). Left, use two dull forceps to place the body so that the neck is in the neck slot. Middle, align the head. The eyes lie on both sides on the edges of the slot. The fly’s head is straight. Right, tuck the fly with a tissue covered with ice to keep it from moving. Scale bar, 1 mm. Please click here to view a larger version of this figure.
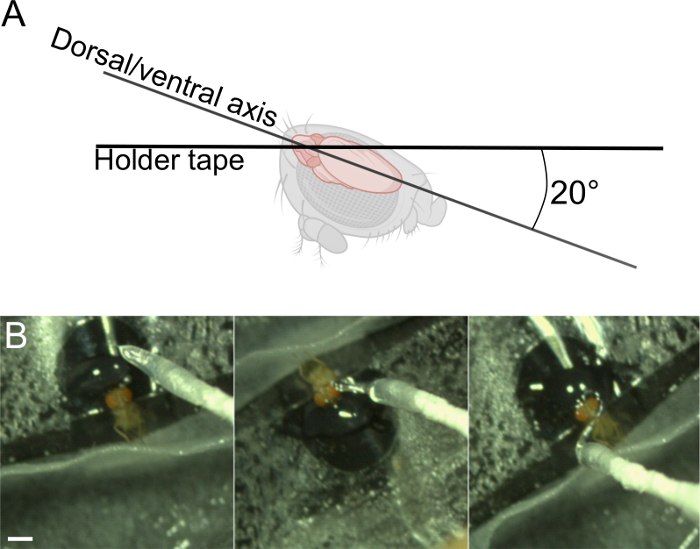
Figure 5: Fix the head (step 3). A) Ideal angle of the head. B) Add UV glue around the head, avoiding sensory areas of interest. Scale bar, 1 mm. Please click here to view a larger version of this figure.
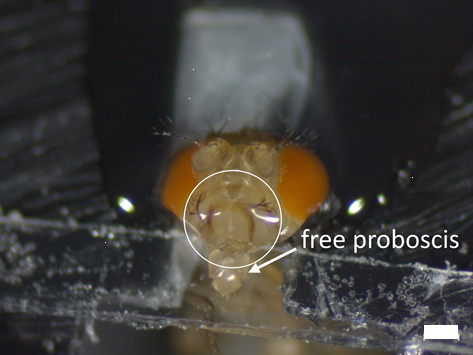
Figure 6: The proboscis’ tip and the antennae can be kept free from glue (step 3). The white circle indicates the area where the UV-glue has been applied. The arrow shows which parts are left free from glue for olfactory and gustatory experiments. Note the optional tape that prevents the legs from touching the glue area. Scale bar, 200 µm. Please click here to view a larger version of this figure.
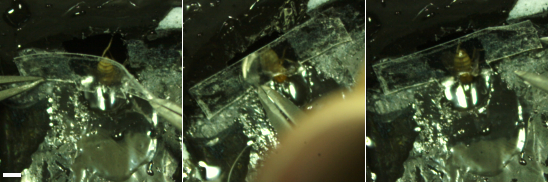
Figure 7: Place the back tape (step 4.2). The tape created in step 1 (see Figure 2, left) is used to place the body and cover the large hole in the holder. Scale bar, 1 mm. Please click here to view a larger version of this figure.

Figure 8: Dissection steps (step 6). A-B) Cut on each side at the base of the dark triangle (crosses) and remove this part of the cuticle C). D) and E) remove muscle 16. Then gently remove the rest of the cuticle F), the air sacks G), and muscles. H) Dissected head. Scale bar, 200 µm. Please click here to view a larger version of this figure.
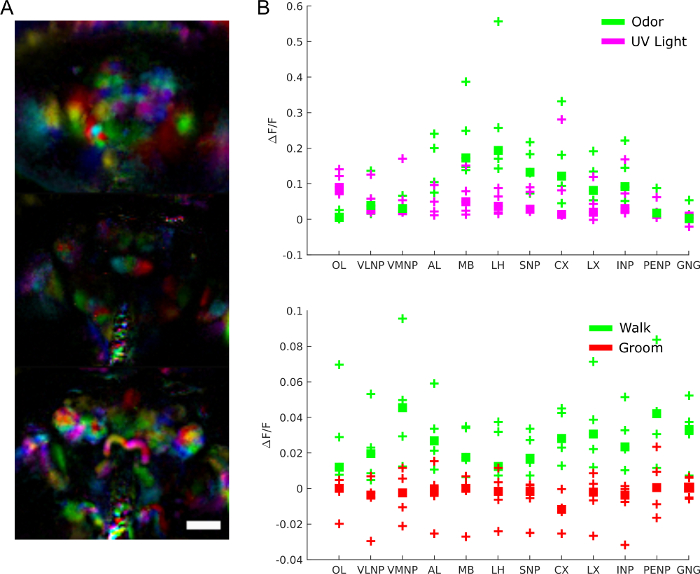
Figure 9: Representative results. A) Functional regions (extracted using PCA and ICA as in28) for a fly expressing GCaMP6 pan-neuronally imaged with a light field microscope (25x, NA=0.95 with a matching f/12 micro lens array). Scale bar, 100 µm. B) Average calcium activity in large brain regions during responses to stimuli and behavior (reproduced from28). Please click here to view a larger version of this figure.
Video 1: Muscle 16 movements (step 6.3). GFP was expressed in muscles. Note the pumping movement that comes from the hole just above the trachea. Please click here to download this video.
Video 2: Pan-neuronal calcium activity during response to odor for two different preparations. Balsamic vinegar was puffed onto the fly. Pan-neuronal calcium activity (nsyb-GAL4 driver, UAS-syt-GCaMP6s left and UAS-GCaMP6M right) was imaged with a light field microscope (25x, NA=0.95 with a matching f/12 microlens array). Light field images were then reconstructed as described in ref.28,37. Please click here to download this video.
Video 3: Calcium activity in a neuron type subset during behavior. GCaMP6 was expressed in dopaminergic and serotoninergic neurons (with TH-GAL4 and DDC-GAL4). In combination with the fly genetic tools, the preparation allows to observe a strong increase in activity in many regions during walk. Please click here to download this video.
Supplementary Material. Please click here to download this file.
Discussion
Drosophila is one of the rare adult animals where the whole brain can be imaged during complex behaviors. Here, we present a method to prepare the fly and expose its whole brain to image ongoing whole brain activity. Several important points should be noted.
Dissecting a small animal such as D. melanogaster is challenging. The method thus requires a lot of practice and patience to master it. However, after training, the procedure takes less than 30 minutes and produces reproducible results.
The method we presented has additional limitations. First, tilting the fly head from its natural position leads to stretching the neck which could be damaging to connective tissue, nerves or muscle. Second, although the ventral subesophageal zone (SEZ) is optically accessible, it is below the semi-transparent esophagus, which decreases the intensity and resolution in this area. Finally, although the holder is out of reach in most directions, the fly still sometimes realizes its presence and pushes on it to try to escape.
Despite these limitations, the comprehensive data obtained from whole brain imaging during behavior and responses to stimuli will make it possible to decipher brain function at the level of the whole network when the animal interacts with and navigates complex, naturalistic environments.
Disclosures
The authors have nothing to disclose.
Acknowledgements
We thank Heidi Miller-Mommerskamp for technical help and Iveth Melissa Guatibonza Arevalo for helpful comments on the manuscript. Initial versions of the protocol were developed in the laboratory of Ralph Greenspan. This work was supported by the German research foundation (DFG), in particular through a grant FOR2705 (TP3) to IGK, and by the Simons foundation (Aimon – 414701) and the Kavli Institute for Brain and Mind (grant number #2017-954) received by SA.
Materials
| Name | Company | Catalog Number | Comments |
|---|---|---|---|
| #5 forceps | FST by DUMONT | 11252-30 | straight tip 0.05 x 0.02 mm, Dumoxel, 11 cm long |
| #55 forceps | FST by DUMONT | 11255-20 | straight tip 0.05 x 0.02 mm, Inox, 11 cm long |
| 30x oculars | yegren | WF30-9-30-H | WF30X/9 High Eye-point Eyepiece Wide Field View Ocular Optical Lens for Stereo Microscope or Biological Microscope 30X, 30mm without Reticle |
| AHOME/UV flashlight | Shenzhen Yijiawan Technology Co., Ltd | B07V2W9543 (ASIN) | 365 nm |
| Fotoplast Gel/UV Glue | Dreve Otoplastik GmbH | 44791 | GHS07, GHS08 |
| Gloss Finish Transparent Tape | 3M Scotch | ||
| KIMTECH Science/Precision wipes | Kimberly-Clark Professional | 7552 | 11 x 21 cm |
| KL 1500 LCD/Microscope light | Schott | ||
| Leica MS5 Microscope | Leica | WF30X/9 | |
| Nail Lacqueur | Opi Products Inc., N. Hollywood | 6306585338 | black |
| Saline: Hepes NaH2PO4 NaHCO3 MgCl2 CaCl2 NaCl KCl sucrose threalose | Sigma Aldrich | ||
| Scalpel | Werner Dorsch GmbH | 78 621; B07SXCXWFS (ASIN) | soft handle |
| Vacuum grease | Dow corning | 0020080 /100 gr | Moly Kote 111 Compound Grease Grease Valve Stamp 100 g |
References
- Papanicolaou, A. C. The Oxford Handbook of Functional Brain Imaging in Neuropsychology and Cognitive Neurosciences. , Oxford University Press. (2017).
- Zong, W., et al. Fast high-resolution miniature two-photon microscopy for brain imaging in freely behaving mice. Nature Methods. 14, 713-719 (2017).
- Musall, S., Kaufman, M. T., Juavinett, A. L., Gluf, S., Churchland, A. K. Single-trial neural dynamics are dominated by richly varied movements. Nature Neuroscience. 22, 1677-1686 (2019).
- Ahrens, M. B., Engert, F. Large-scale imaging in small brains. Current Opinion in Neurobiology. 32, 78-86 (2015).
- Sokolowski, M. B. Drosophila: Genetics meets behaviour. Nature Reviews Genetics. 2, 879-890 (2001).
- Venken, K. J. T., Bellen, H. J. Emerging technologies for gene manipulation in Drosophila melanogaster. Nature Reviews Genetics. 6, 167-178 (2005).
- Zheng, Z., et al. A Complete Electron Microscopy Volume of the Brain of Adult Drosophila melanogaster. Cell. 174, 730-743 (2018).
- Aimon, S., Grunwald Kadow, I. C. Studying complex brain dynamics using Drosophila. Journal of Neurogenetics. 34, 171-177 (2020).
- Fiala, A., et al. Genetically Expressed Cameleon in Drosophila melanogaster Is Used to Visualize Olfactory Information in Projection Neurons. Current Biology. 12, 1877-1884 (2002).
- Wang, J. W., Wong, A. M., Flores, J., Vosshall, L. B., Axel, R. Two-Photon Calcium Imaging Reveals an Odor-Evoked Map of Activity in the Fly Brain. Cell. 112, 271-282 (2003).
- Mann, K., Gallen, C. L., Clandinin, T. R. Whole-Brain Calcium Imaging Reveals an Intrinsic Functional Network in Drosophila. Current Biology. 27, 2389-2396 (2017).
- Liang, X., Holy, T. E., Taghert, P. H. Synchronous Drosophila circadian pacemakers display nonsynchronous Ca2+ rhythms in vivo. Science. 351, 976-981 (2016).
- Harris, D. T., Kallman, B. R., Mullaney, B. C., Scott, K. Representations of Taste Modality in the Drosophila Brain. Neuron. 86, 1449-1460 (2015).
- Yoshihara, M. Simultaneous recording of calcium signals from identified neurons and feeding behavior of Drosophila melanogaster. Journal of Visualized Experiments. , e1(2012).
- Strutz, A., Völler, T., Riemensperger, T., Fiala, A., Sachse, S. Calcium imaging of neural activity in the olfactory system of Drosophila. Neuromethods. 72, 43-70 (2012).
- Seelig, J. D., et al. Two-photon calcium imaging from head-fixed Drosophila during optomotor walking behavior. Nature Methods. 7, 535-540 (2010).
- Fisher, Y. E., Lu, J., D'Alessandro, I., Wilson, R. I. Sensorimotor experience remaps visual input to a heading-direction network. Nature. 576, 121-125 (2019).
- Green, J., Vijayan, V., Mussells Pires, P., Adachi, A., Maimon, G. A neural heading estimate is compared with an internal goal to guide oriented navigation. Nature Neuroscience. 22, 1460-1468 (2019).
- Shiozaki, H. M., Ohta, K., Kazama, H. A Multi-regional Network Encoding Heading and Steering Maneuvers in Drosophila. Neuron. 106, 126-141 (2020).
- Huang, C., et al. Long-term optical brain imaging in live adult fruit flies. Nature Communications. 9, 872(2018).
- Kohatsu, S., Koganezawa, M., Yamamoto, D. Female contact activates male-specific interneurons that trigger stereotypic courtship behavior in Drosophila. Neuron. 69, 498-508 (2011).
- Grover, D., Katsuki, T., Greenspan, R. J. Flyception: imaging brain activity in freely walking fruit flies. Nature Methods. 13, 569-572 (2016).
- Cohn, R., Morantte, I., Ruta, V. Coordinated and Compartmentalized Neuromodulation Shapes Sensory Processing in Drosophila. Cell. 163, 1742-1755 (2015).
- Fiala, A., Spall, T. In Vivo Calcium Imaging of Brain Activity in Drosophila by Transgenic Cameleon Expression. Science Signaling. 2003, (2003).
- Silbering, A. F., Bell, R., Galizia, C. G., Benton, R. Calcium imaging of odor-evoked responses in the Drosophila antennal lobe. Journal of Visualized Experiments. , (2012).
- Bilz, F., Geurten, B. R. H., Hancock, C. E., Widmann, A., Fiala, A. Visualization of a Distributed Synaptic Memory Code in the Drosophila Brain. Neuron. 106, 963-976 (2020).
- Berry, J. A., Cervantes-Sandoval, I., Chakraborty, M., Davis, R. L. Sleep Facilitates Memory by Blocking Dopamine Neuron-Mediated Forgetting. Cell. 161, 1656-1667 (2015).
- Aimon, S., et al. Fast near-whole-brain imaging in adult Drosophila during responses to stimuli and behavior. PLOS Biology. 17, 2006732(2019).
- Azevedo, A. W., et al. A size principle for recruitment of Drosophila leg motor neurons. Elife. 9, (2020).
- Haberkern, H., et al. Visually Guided Behavior and Optogenetically Induced Learning in Head-Fixed Flies Exploring a Virtual Landscape. Current Biology. 29, 1647-1659 (2019).
- Li, W., et al. SCAPE Microscopy for High Speed , 3D Whole-Brain Imaging in Drosophila Melanogaster. Biomed. Opt. Congr. 2016, 4-6 (2016).
- Wu, Y., Shroff, H. Faster, sharper, and deeper: structured illumination microscopy for biological imaging. Nature Methods. 15, 1011-1019 (2018).
- Bando, Y., Grimm, C., Cornejo, V. H., Yuste, R. Genetic voltage indicators. BMC Biology. 17, 71(2019).
- Plaçais, P. -Y., et al. Upregulated energy metabolism in the Drosophila mushroom body is the trigger for long-term memory. Nature Communications. 8, 15510(2017).
- Gándara, L., Durrieu, L., Behrensen, C., Wappner, P. A genetic toolkit for the analysis of metabolic changes in Drosophila provides new insights into metabolic responses to stress and malignant transformation. Scientific Reports. 9, 19945(2019).
- Andreoni, A., Davis, C. M. O., Tian, L. Measuring brain chemistry using genetically encoded fluorescent sensors. Current Opinion in Biomedical Engineering. 12, 59-67 (2019).
- Broxton, M., et al. Wave optics theory and 3-D deconvolution for the light field microscope. Optics Express. 21, 25418-25439 (2013).
Reprints and Permissions
