In this protocol, we discuss the implementation of a model of successful orthotopic liver transplantation (OLT) in mice. Additionally, adjuvants to further analyze allograft patency after successful OLT in a mouse are discussed as well, specifically utilizing microcomputed tomography (microCT) scans.
Method Article
Successful Orthotopic Liver Transplantation in Mice Utilizing Microcomputed Tomography Angiography
In This Article
Summary
Abstract
Microcomputed tomography (microCT) angiography is an invaluable resource to researchers. New advances in this technology have allowed for high-quality images to be obtained of micro-vasculature and are high-fidelity tools in the field of organ transplantation. In this model of orthotopic liver transplantation (OLT) in mice, microCT affords the opportunity to evaluate allograft anastomosis in real time and has the added benefit of not having to sacrifice study animals. The choice of contrast, as well as image acquisition settings, create a high-definition image, which gives researchers invaluable information. This allows for evaluation of the technical aspects of the procedure as well as potentially evaluating different therapeutics over an extended duration of time. In this protocol, we detail an OLT model in mice in a stepwise fashion and finally describe a microCT protocol that can give high-quality images, which aid researchers in in-depth analysis of solid organ transplantation. We provide a step-by-step guide for liver transplantation in a mouse, as well as briefly discuss a protocol for evaluating the patency of the graft through microCT angiography.
Introduction
Transplantation is the only effective therapy for end-stage liver disease. Undeniably, the benefit of liver transplantation is excellent, with a median survival of 11.6 years versus 3.1 years on the waiting list1. However, there are significant constraints, which limit the broad application of liver transplantation, and include most importantly, a lack of suitable, high-quality donor organs. Expanding the donor organ pool will, thus, require innovative strategies that allow for the use of allografts currently considered unsuitable today, increasing the margin of safety for transplantation. Therefore, to improve access to liver transplantation, it is imperative to conduct preclinical studies in small animals.
Particularly important to transplantation research are in vivo models of transplantation. Mouse orthotopic liver transplantation (OLT) has been around for almost 30 years2 and is vital to studying many aspects of transplantation, including the characterization of immune responses, ischemia-reperfusion injury, acute rejection, therapeutic effects of novel agents, and long-term survival3,4,5,6,7. The use of mice to study transplantation is vital as it allows for the use of transgenic mouse lines to study the impact of specific molecular pathways on the outcomes of transplantation. Established protocols of mouse liver transplantation have been well described previously8,9.
Multiple methods of anastomoses exist for the supra and infra hepatic inferior vena cava (IVC), portal vein (PV), and common bile duct (CBD). They typically rely on either hand anastomosis or a modified vascular cuff technique similar to murine lung transplantation10,11,12. An important step in the long-term study and survival of the recipient mice, as well as the development of a sustained mouse liver transplant program, is the ability to evaluate these critical anastomoses. Imaging modalities to evaluate liver allograft patency often rely on ultrasound and computer tomography (CT) in the clinical setting13,14. CT has a distinct advantage over ultrasound as it can offer views of the entire abdomen to include every anastomosis, although obtaining these views with ultrasound can be particularly difficult in small animals. Significant research and resources have been devoted to developing accurate microCT for the purpose of enhancing animal studies and the information we can gather from these models of injury and disease15,16. Here we describe a protocol for orthotopic mouse liver transplantation (Figure 1) and briefly describe a protocol for microCT to evaluate allograft patency and durability of anastomoses.
Protocol
Male C57BL/6J mice (30 g body weight) were housed under pathogen-free conditions at the Nationwide Children's Hospital Animal Facility. All procedures were humanely performed according to the NIH and the National Research Council's Guide for the Humane Care and Use of Laboratory Animals and with the approval of the Nationwide Children's Hospital Institutional Animal Care and Use Committee (IACUC Protocol AR17-00045). See the Table of Materials for details related to all materials, instruments, and equipment used in this protocol.
1. Initial setup for transplantation surgery
- Set up surgical devices.
- Set up surgical monitoring devices (i.e., heart-rate monitoring device, pulse-ox, modular monitor system) and anesthesia machines.
- If available, turn on the surgical warming board to 42 °C.
- Ensure that ventilation and anesthesia machines are turned on to warm the isoflurane evaporator. Fill the anesthesia reservoir with 30 mL of liquid isoflurane and ensure the ventilator machine is connected to the oxygen.
NOTE: In this protocol, we do not intubate the animal; only use a nose cone for oxygenation.
- Record the body weight of the recipient and donor mice.
- Turn on the high-power surgical microscope and adjust the height and focus to the surgeon's preferences. Ensure that the remaining surgical devices are turned on (i.e., electrocautery device).
- Prepare and lay out surgical instruments, as well as surgical ties of 10-0 nylon (Figure 2).
NOTE: All surgical instruments were autoclaved at 121 °C for 30 min. Additionally, different configurations of surgical instruments could be equally effective. - Prepare the cuffs for the portal vein (PV) and common bile duct (CBD) stents (Figure 3). Place the angiocatheter, as well as the PE10, on a sterile surface under the high-power microscope. Using a #11 surgical blade, cut the angiocatheter to form a 1.5 mm long cuff with a tab approximately 0.75 mm at the top of the cuff body; cut the polyethylene tubing (PE10) to 2.5 mm length. Store the cuffs and stent in sterile saline until ready for use.
NOTE: This transplantation model utilizes a 20 G angiocatheter to make cuffs for PV reconstruction, as well as a polyethylene tubing 10 (PE10) for the reconstruction of the CBD. All other anastomoses are hand-sewn. - Prepare solutions. Prepare a heparin injection that will be delivered at 100 U in 0.5 mL of histidine-tryptophan-ketoglutarate (HTK) solution. Store saline, heparin-saline, PBS, and HTK preservation solution on ice.
2. Donor mouse procurement
- Induce anesthesia in the donor mouse by placing it in an isoflurane inhalation chamber. Make sure that the isoflurane concentration is approximately 2.5% with an oxygen flow of 2 mL/min. Wait 5 min for a surgical plane of anesthesia to develop. To ensure the proper level of anesthesia, toe pinch the mouse to elicit a reaction; a lack of reaction indicates that the proper level of anesthesia has been met.
- Shave the abdomen of the mouse using electronic clippers and place the mouse in the supine position on the warming board. Clean the abdomen with povidone-iodine, then 70% ethanol. Place ophthalmic ointment under mice's eyes to prevent dryness.
- Place the mouse under the high-powered microscope and maintain the mouse under anesthesia using an isoflurane inhalation of 2% concentration with an oxygen flow of 2 mL/min.
- Perform a midline laparotomy with a pair of scissors (surgeon preference) from the xiphoid process to the pubic symphysis. Next, perform an additional transverse incision to create a 'cross-like' pattern inferior to the ribs. Using mosquito hemostatic forceps, retract the xiphoid process to achieve adequate exposure of the abdominal contents.
NOTE: Forceps can be secured depending on the surgeon's preference. - Eviscerate the intestines and place them on the left side of the abdominal cavity in a wet gauze sponge. Mobilize the liver by taking down all ligamentous attachments.
- Expose the proper hepatic artery (pHA). Skeletonize the vessel utilizing curve forceps and ligate it with 10-0 nylon suture.
- Dissect out the entire length of the CBD using a combination of sharp and blunt dissection. Perform a ductotomy (large enough for the CBD stent) as close to the superior border of the pancreas as possible to give an adequate length for future use (~1 cm from the inferior border of the liver). Insert the bile duct stent into the CBD with fine forceps and secure it with a 10-0 nylon suture. Ligate the distal aspect of CBD using a 10-0 nylon suture (Figure 4).
- Retract the right hepatic lobe towards the xiphoid using a wet gauze sponge and expose the IVC. Mobilize the infra-hepatic IVC (IHIVC) away from the retroperitoneum and cauterize the right adrenal vein using a handheld cautery device (see Table of Materials).
- Dissect out the right renal artery and vein and ligate with 7-0 and 10-0 nylon, respectively. Cut the right renal vein and artery and remaining ligamentous attachments. Finally, remove the right kidney.
NOTE: This is done to have better exposure when finally cutting the IHIVC. - Inject the 0.5 mL of cold HTK with 100 U heparin solution through the PV with a 30 G needle. Wait 1 min for the heparin to distribute systematically. Cut the portal vein just superior to the splenic vein and superior-mesenteric vein.
- Slowly inject cold HTK preservation solution with heparin in the IHIVC with a 30 G needle to perfuse the donor liver. Stop injecting the solution once the fluid coming from the PV is clear. After the injection is complete, place a micro clamp on IHIVC just superior to the right renal vein and cut just inferiorly to the clamp. Once this step is complete, turn off the ventilator and stop isoflurane as the animal has just been euthanized.
- Cut the CBD distally to the stent that was previously placed in step 2.7. Additionally, identify the cystic duct, and ligate the duct with a 10-0 Nylon suture. Next, grasp the dome of the gallbladder with a pair of forceps, and dissect free from the gallbladder fossa using a combination of sharp and blunt dissection. Once the gallbladder is adequately mobilized, using a pair of spring scissors, complete the cholecystectomy by cutting the cystic duct above the previously placed suture.
- Retract the liver inferiorly to expose the supra-hepatic IVC (SHIVC). Cut the SHIVC paying special attention to give an adequate length for the anastomosis in the recipient animal.
- Dissect free additional ligamentous attachments to the liver and deliver the donor liver ex-vivo and place the organ in a container with cold saline.
3. Back table preparation of liver allograft
- Place ice in an insulated container, and place a Petri dish on the bed of ice. Fill the Petri dish with cold saline. Place the liver allograft in the dish so that the visceral surface is exposed.
- Place the PV through the previously selected cuff, and evert the vein so that the inner endothelial surface is exposed. Secure the cuff with 10-0 nylon suture. Ensure that the suture lies within the grooves of the cuff for the best results (Figure 5).
- Adjust the liver allograft to expose the SHIVC and place two 8-0 nylon stay-sutures at 3' and 9 o'clock orientation, respectively, for eventual anastomosis in the recipient animal. Adjust the liver allograft again to expose the IHIVC and place two 8-0 nylon stay-sutures at 3' and 9 o'clock orientation, respectively, for eventual anastomosis in the recipient animal.
4. Recipient operation
NOTE: As this is a sterile operation, use gloves and proper personal protective equipment and administer antibiotics. Administer 0.1 mg/kg Buprenorphine subcutaneously as preoperative analgesia at the time of surgery.
- Expose the pHA as in the donor operation; only utilize a midline laparotomy instead of the previously described abdominal incision.
- Mobilize the liver and cut all ligamentous attachments. Additionally, ligate the left phrenic and paraoesophageal vessels with 10-0 nylon suture.
- Retract the liver inferiorly and dissect free the SHIVC from the retroperitoneum. Next, retract the liver superiorly and dissect free the IHIVC from the retroperitoneum. Cauterize small bridging veins and lumbar veins as necessary using the same technique as previously described.
- Cauterize the right adrenal vein with hand-held cautery and expose the liver hilum. Ligate the pHA with 10-0 nylon suture. Next, dissect the CBD free from the PV and ligate the CBD with 7-0 suture close to the bifurcation of the CBD to give an adequate length for the CBD anastomosis.
- Utilize a micro clamp to clamp infra-hepatic IVC and temporarily ligate the PV with a 7-0 suture. Start the an-hepatic phase. Stop isoflurane inhalation.
NOTE: After clamping the portal vein and IVC, the hepatic venous return is completely blocked in the anhepatic stage. The inhaled anesthetic isoflurane is metabolized by the liver; thus its inhalation is momentarily stopped as accumulation can lead to cardiopulmonary collapse. - Through the native liver's PV, inject 0.5 mL of heparin-saline with a 30 G needle to flush the organ.
- Place micro-vascular clamps on the SHIVC and IHIVC as proximally and distally as possible to leave an adequate length for anastomosis. Cut the native SHIVC, IHIVC, PV (close to the previously placed suture), and any remaining ligamentous attachments to the recipient's native liver and deliver the native liver ex vivo.
NOTE: The IHIVC clamp should be above the right renal vein. - Place the donor liver allograft inside the abdominal cavity and retract the hilum of the donor allograft to expose the PV. Flush both the donor and native PV with 0.5 mL of heparin saline using a 30 G needle to de-air the vessels to avoid air embolism. Then, insert the previously made cuff of donor PV into the lumen of the recipient liver PV and if necessary, place stay sutures to help with the anastomosis (8-0 suture). Secure the anastomosis with 7-0 suture (Figure 6).
- Rotate the board 180°. Perform a hand-sewn anastomosis with 10-0 nylon suture with the donor and native SHIVC. After completing posterior wall anastomosis, flush with 0.5 mL of heparin saline to de-air to avoid air embolism. Complete anastomosis of the superior wall (Figure 7).
- Remove the ligation suture of PV first; then, remove the vascular clamps from SHIVC to begin reperfusion. End the an-hepatic phase and restart isoflurane inhalation. Perform hand-sew anastomosis with 10-0 nylon suture, in the same manner as for the SHIVC anastomosis, to reconstruct IHIVC. After completing the reconstruction, remove the micro clamp from the native and donor IHIVC to reperfuse (Figure 8).
- Perform the CBD anastomosis by creating a ductotomy on the recipient CBD near the previously placed suture. Insert the stent in the donor CBD into the recipient CBD lumen and secure the anastomosis with 10-0 suture (Figure 9).
- Irrigate the abdominal cavity with 1 mL of saline; check hemostasis and cauterize any remaining bleeding vessels. Close the abdominal incision in two layers utilizing 6-0 suture.
- Place the animal in a warm incubator (42 °C) for recovery and do not leave the animal unattended until it has regained consciousness and sufficient activity. Administer 0.1 mg/kg buprenorphine subcutaneously after surgery and continue the administration every 8 to 12 hours for 48 hours post-surgery. Additionally, administer carprofen (0.2 mL dissolved in 400 mL of water) through the recipient animal's water bottle for up to 7 days following surgery. Observe the recipient animal for 4-5 h, and once it has fully recovered, return it to the housing location as it is now safe to be with other animals.
NOTE: Pain medications and antibiotics can be administered as per local animal ethics committee recommendations.
5. Mouse microCT angiography imaging
- After observing the mouse for the predetermined study interval, prepare the mouse to evaluate the patency of the allograft using microCT angiography.
- Ensure that the ventilation and anesthesia machines are turned on to warm the isoflurane evaporator. Fill the anesthesia reservoir with 30 mL of liquid isoflurane, and ensure that the ventilator machine is connected to the oxygen. Turn on the microCT scanner and ensure all software is functioning properly.
- Start the acquisition software on the microCT scanner system.
- On the monitor of the microCT unit, click Initialize system and choose CT scan mode.
- Eject the bed; attach the mouse bed and lock it.
- Turn on the warming board to 42 °C for the recovery cage.
- Fill a 1 mL syringe with 100 µL of CT contrast agent. Attach a 30-gauge needle for future intravenous administration of contrast. Ensure that are no air bubbles in the syringe.
- Place a mouse in the tail vein restraint system. Once the mouse is completely inside the restraint system, close the system's gate, allow the tail to drop vertically, and carefully wipe it with an alcohol solution (70% ethanol).
NOTE: Success in cannulation of the tail vein can be increased by warming the animal's tail by holding it in a gloved hand for several minutes. - Grasp the tail towards the distal aspect, and place two fingers (index and middle) around the tail proximal to the planned injection site. Place the distal aspect of the tail (below the injection site) in between the thumb and ring finger.
- With both sets of fingers, apply pressure slightly and insert the needle into the vein using a shallow depth, ensuring that the syringe and needle are parallel to the tail. While releasing the pressure of the index finger at the proximal tail, intravenously administer the CT contrast agent. Avoid aspiration with the syringe as this can cause the vein to collapse.
NOTE: No resistance should be felt during the injection if the needle is appropriately positioned in the vein. If there is resistance, remove the needle and re-insert it above the original injection site. If cannulation of the vein fails even after two attempts, replace the needle. - After successfully injecting the contrast and removing the needle, apply gentle compression to the injection site using sterile gauze to stop bleeding.
- Transfer the mouse to the isoflurane inhalation chamber and set the concentration to 2.5% with an oxygen flow of 2 mL/min and wait 3-4 min. Once a plane of anesthesia has been established, quickly transfer the mouse to the microCT scanner bed and lay it in the prone position on the scanner table (Figure 10).
- Cover the animal's eyes with the proper amount of ophthalmic ointment. Place the nose cone appropriately over the animal and ensure air and isoflurane are flowing properly through the nose cone. Use the same anesthesia parameters described earlier (step 5.12). Lubricate and insert a rectal temperature probe to continuously monitor the animal's body temperature during imaging.
- Place a respirator in contact with the mouse.
- Use tape to attach an ECG pad to the left, right fore, and left hind limbs. Use ultrasound gel to improve the signal between the ECG pad and the skin.
- Check the ECG and respiratory signal on the computer software to ensure proper QRS complexes are seen on the monitor. To do this, check Logic Lead in the Source Set Up Tab, and choose the lead that offers the clearest ECG curve.
NOTE: The logic leads correspond to the three ECG pads that are connected to the right, left chest, and lower leg. Every lead represents an ECG curve. - Set Gain for proper signal height, usually 4 or 8 is good. Select dual gating. Under the Display Set Up tab, adjust the display settings for a clear signal view: tick the boxes next to ECG and RESP and set each to 500. Under the Trigger Set Up tab, confirm that Channel A, Channel B, and DualTrig are checked.
- Ensure the following parameters are set as well: Threshold: when signal drops below this value; set the value to 2,500; Hysteresis: ensure that the signal crosses hysteresis to create a software trigger point at which a new triggering cycle starts; set the value to 300; Delay: wait before the trigger is sent; set the value to 100; Inhibit: no signal can be generated during this period, set the value to 200.
- Ensure that the threshold for ECG is below the hysteresis value and above the peak of the sT segment on the display screen.
- Advance the animal into the scanner and press Update image. Acquire an X-ray scout image of the animal to select the appropriate field-of-view and anatomical scan coverage for the subsequent microCT image.
- Perform microCT angiography image acquisition using the following parameters: Magnifications: Ultra focus, Scan angle: Full (360) scan, Energy: Single, Scan Mode: Gated, Setting: Default (full 360° rotation, X-ray tube default settings of 0.33 mA and 55 kV, 0.750° degree per step, 1 projection per step, 1 x 1 binning, and 40 ms exposure time; dual gating means cardiac and respiratory gating) (Figure 11).
- After completion of the scan, transfer the animal to a prewarmed recovery cage. Once the animal has fully recovered, transfer it back to its primary cage.
- Reconstruct microCT images using system software. After uploading the image, set the blue bars so it straddles the anatomical area of interest; preview a slice to make the volume smaller and as constrained to the mouse as possible (this stage helps to reduce the size of the reconstructed image).
- Turn on the volume of interest outline to optimize the image boundary. Choose 40 µm voxel size, Hann projection filter, and Gaussian volume filter (80 µm). Go to Advanced | Image-based gating and adjust the trigger windows and phase to 0.5 and 0.6, respectively, choose 10 phases for cardiac gating, and then push the volume reconstruction button.
Results
For those researchers who are not surgeons, unfamiliar with anatomy, or uncomfortable interpreting radiologic results, proper image analysis should be done by personnel with proper training. The success of an OLT in a mouse is demonstrated in the above protocol. Furthermore, to enhance study metrics and provide real-time feedback for the success of a transplant, as well as eliminate the need for necropsy, a microCT angiography scan can be used to provide accurate and clear images. Representative images are included in this manuscript (Figure 11). Representative images of in vivo failed anastomosis can be seen in Figure 12.
Those familiar with hepatic anatomy and vasculature can see patent venous anastomoses of the IVC. In some circumstances, the portal vein can be visualized as well, which is made easily in this model due to the portal vein cuff. The viewing of open anastomoses indicates the technical success of the operation. Additionally, 3D reconstruction of these images can provide additional information to researchers and a more detailed image of the vascular anatomy. Utilizing this above model, mortality in the OLT mice cohort is ~40-45%.
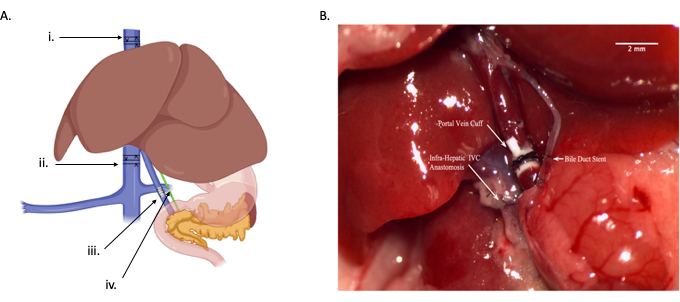
Figure 1: Overview of orthotopic liver transplant. (A) Graphical drawing depicting the four different anastomoses: i) suprahepatic IVC anastomosis, ii) infrahepatic IVC anastomosis, iii) portal vein anastomosis, iv) common bile duct anastomosis. Each arrow indicates a relative location for where the vessel or duct should be cut-supra-hepatic IVC (protocol step 2.13), infra-hepatic IVC (protocol step 2.11), portal vein (protocol step 2.10), and common bile duct (protocol step 2.7). (B) In vivo diagram of anastomoses. Scale bar = 2 mm. Abbreviation: IVC = inferior vena cava. Please click here to view a larger version of this figure.
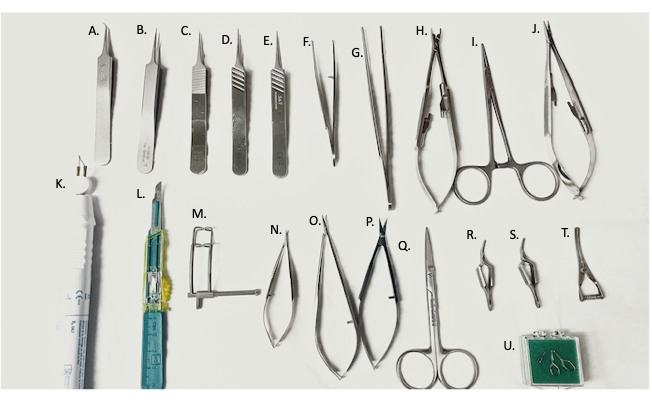
Figure 2: Surgical tools used in surgery. (A) 45° fine forceps, (B-E) fine forceps, (F) curved needle holder/forceps, (G) straight forceps, (H) vascular clamp applier, (I) hemostat, (J) needle holder, (K) electro-cautery device, (L) #11 blade, (M) abdominal retractor, (N,O) micro-scissors, (P) fine scissors, (Q) surgical scissors, (R,S) Yasargil clamps, (T) bulldog vein clamp, (U) micro-vascular clamp. Please click here to view a larger version of this figure.

Figure 3: Portal vein cuff and bile duct stent. Ex vivo image of stents and cuffs prior to use. Scale bar = 3.5 mm. Please click here to view a larger version of this figure.
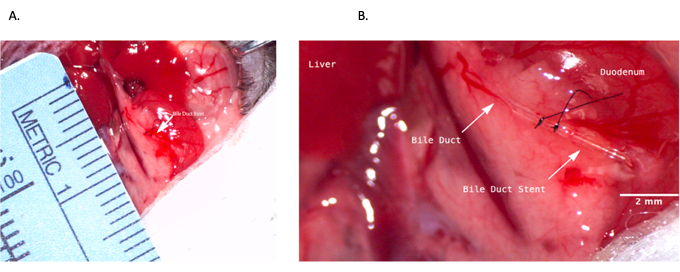
Figure 4: Common bile duct stenting during donor operation. (A) Bile duct stent being inserted into the common bile duct. (B) Bile duct stent secured within the bile duct. Scale bar = 2 mm. Please click here to view a larger version of this figure.
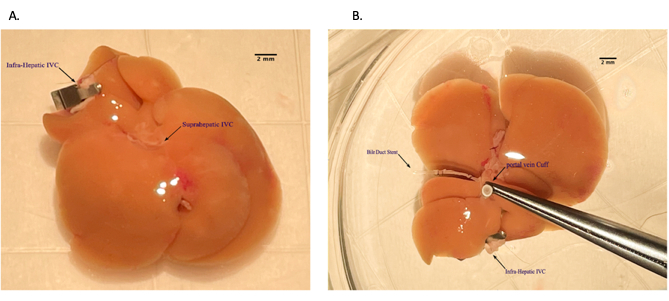
Figure 5: Placing portal vein cuff during back table preparation of the liver allograft. (A) Threading portal vein through the venous cuff. (B) Everted vein over the cuff. Scale bar = 2 mm. Please click here to view a larger version of this figure.
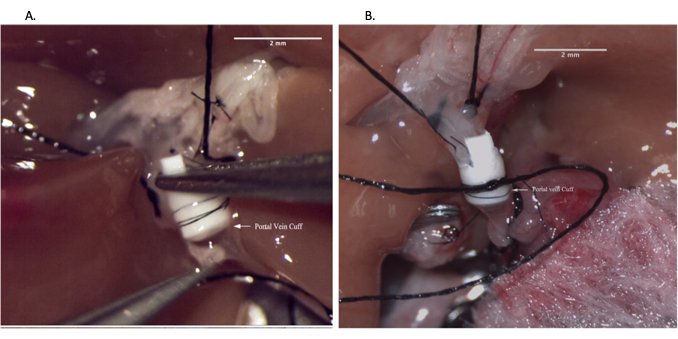
Figure 6: Portal vein anastomosis during recipient operation. (A) Inserting vein cuff into recipient portal vein. (B) Portal vein anastomosis secured with suture. Scale bar = 2 mm. Please click here to view a larger version of this figure.
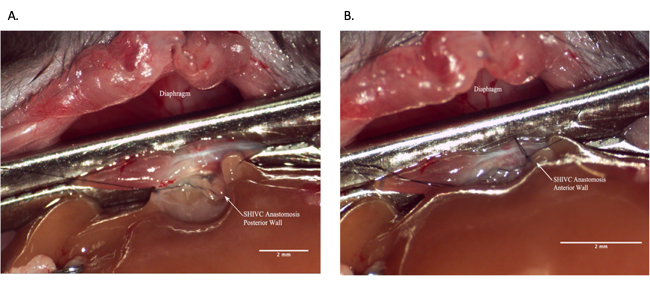
Figure 7: Suprahepatic IVC anastomosis during recipient operation. (A) Posterior wall of the anastomosis is complete. (B) Completed SHIVC anastomosis. Scale bar = 2 mm. Abbreviations: IVC = inferior vena cava; SHIVC = suprahepatic IVC. Please click here to view a larger version of this figure.
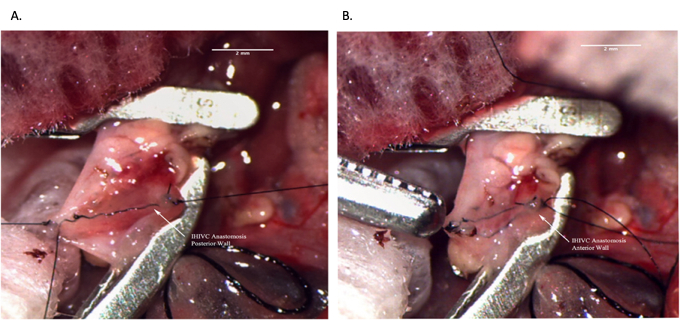
Figure 8: Infrahepatic IVC anastomosis during recipient operation. (A) Posterior wall of the anastomosis is complete. (B) Completed IHIVC anastomosis. Scale bar = 2 mm. Abbreviations: IVC = inferior vena cava; IHIVC = infrahepatic IVC. Please click here to view a larger version of this figure.
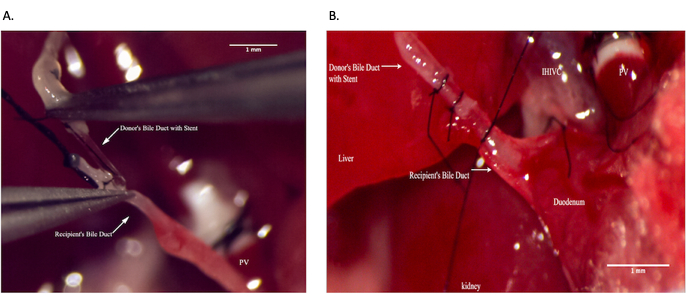
Figure 9: Common bile duct anastomosis during recipient operation. (A) Placing bile duct stent within the recipient common bile duct. (B) Securing bile duct anastomosis. Scale bar = 1 mm. Please click here to view a larger version of this figure.

Figure 10: Mouse microCT angiography animal preparation. (A) Mouse tail vein injection to administer contrast. (B) Mouse being passed through microCT machine. Abbreviation: microCT = microcomputed tomography. Please click here to view a larger version of this figure.
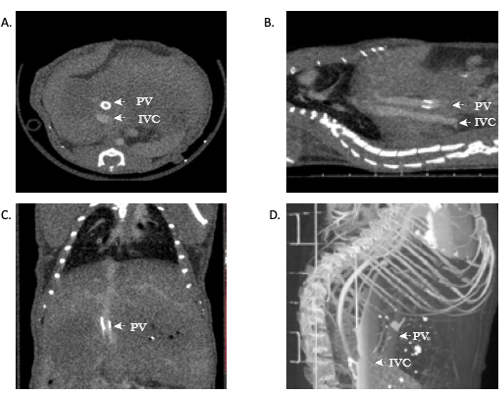
Figure 11: Representative images showing microCT angiography of allograft patency. (A,B) Contrast can be seen throughout the IVC, demonstrating patency of the suprahepatic and infrahepatic anastomoses. (C) Contrast in the portal-vein, again demonstrating patency. (D) 3D reconstruction of the vasculature. Abbreviations: microCT = microcomputed tomography; IVC = inferior vena cava; PV = portal vein. Please click here to view a larger version of this figure.
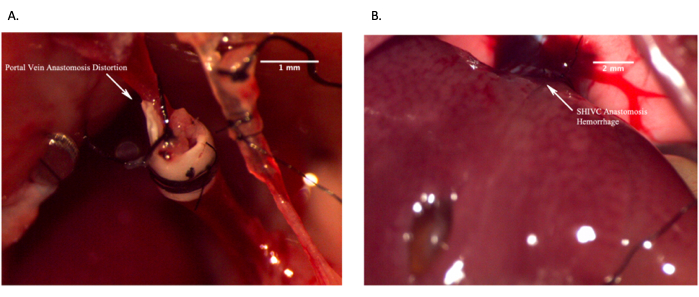
Figure 12: Representative images showing failed in vivo anastomoses. (A) Failed portal vein anastomosis due to distortion of the vein resulting in lack of blood flow. (B) Failed suprahepatic IVC anastomosis due to excessive bleeding. Scale bar = 2 mm. Please click here to view a larger version of this figure.
Discussion
OLT in rodents has been well described in the literature2,8. To perform this technically demanding procedure, often several years of micro-surgery (or surgery in general) is required as this involves a robust understanding of anatomy and technical ability. In developing this model, we faced several technical issues all revolving around the anastomoses. Particularly with the PV anastomosis, it is often difficult to stabilize the vein for anastomosis. We have found that placing one or two sutures (surgeon preference) helps with facilitating cuff placements. It is to be noted that placing more stay sutures increases surgical time.
Additionally, the SHIVC is deep within the abdominal cavity and is difficult to place a clamp on to give adequate exposure. We have found that if the mouse is relaxed as possible in its restraint, that will add to the flexibility of the vein. Ultimately, it will be up to the surgeon to determine the proper placement with practice. Furthermore, with the CBD anastomosis, the duct is again very delicate. It can be difficult to place stay sutures to stabilize the duct, and possibly, placing it on a small piece of gauze will aid in its stabilization. Finally, as all small mammals are uniquely delicate with respect to anesthesia time, it is important to perform the surgery as quickly as possible. Ideal surgical times are as follows: 1) donor operation, 45-60 min; 2) back table preparation, 15 min; 3) recipient operation, 60-80 min. Practice will help with decreasing wasted movement.
As animal models advance, the ability to evaluate the success of study interventions has also advanced. MicroCT was first used to conduct studies on vasculature in rats in the late 1990s17. There are many challenges to performing accurate and clear microCT angiography studies in rodents. However, most of the challenges arise from the short cardiac and respiratory cycles of these mammals. This is overcome by using short exposures to limit motion artifacts as well as higher photon fluence rates18. In general, we found that the use of cardiac gating, as well as the adjustment of isoflurane concentrations to decrease the respiratory rate, produced the clearest images. We have also found that utilizing rodent-specific contrast timing for specific phases: hepatic arterial phase, portal-venous phase, and delayed phase have also improved visualization19. The use of ExiTron nano 12000 contrast has several advantages and can improve overall image quality. It offers the strongest contrast enhancement in the liver20 and the blood21. Another advantage is that the contrast is present in the liver for up to 120 h after the initial injection, which could cut down on associated liver toxicity as less contrast is needed if repeated scans are required20.
Furthermore, because scans are performed with the mouse sedated with isoflurane, contrast enhancement is not altered with this change in physiology20. By employing these imaging techniques and ExiTron contrast, a clear evaluation of successful anastomoses in OLT is possible. MicroCT allows for noninvasive evaluation of in-vivo allografts over an extended period. This protocol decreases the number of animals that must be sacrificed to evaluate vascular anastomoses and afford the opportunity to study therapeutics over several weeks and their effect on the vasculature.
Limitations
It is to be noted that while multiple revisions of the OLT model have occurred to perfect its technique, the visualization of the anastomoses utilizing microCT is still an ongoing process. Furthermore, mouse OLT offers a unique insight into transplantation medicine. However, it is not an encompassing model as it is difficult to keep these mice alive past 1 week. Additional transplant models should be used as well to further substantiate preclinical experiments.
Conclusions
Advances in microCT have rapidly progressed over the past decade, providing researchers with invaluable new tools in the field of animal models and transplantation. In the future, more detailed 3D imaging will offer further insights into research and discovery.
Disclosures
The authors have no conflicts of interest to declare.
Acknowledgements
SMB is supported by the National Institute of Diabetes and Digestive and Kidney Diseases (NIDDK) grant R01DK1234750. BAW is supported through the National Institutes of Health National Heart Lung and Blood Institute grant R01HL143000.
Materials
| Name | Company | Catalog Number | Comments |
|---|---|---|---|
| #11 Blade | Fisher Scientific | 3120030 | |
| 4-0 silk suture | Surgical Specialties Corp. | SP116 | |
| 6-0 nylon suture | AD Surgical | S-N618R13 | |
| 7-0 nylon suture | AD Surgical | S-N718SP13 | |
| 8-0 nylon suture | AD Surgical | XXS-N807T6 | |
| 10-0 nylon suture | AD Surgical | M-N510R19-B | |
| 20 G Angiocath | Boundtree | 602032D | |
| 30 G Needle | Med Needles | BD-305106 | |
| Baytril (enrofloxacin) Antibacterial Tablets | Elanco | NA | |
| Bovie Chang-A-Tip High Temp Cauterizer | USA Medical and Surgical Supplies | BM-DEL1 | |
| Bulldog Vein Clamp 1 1/8 | Ambler Surgical USA | 18-181 | |
| C57BL/6J mice | Jackson Labs | ||
| Castroviejo Micro Dissecting Spring Scissors | Roboz Surgical Store | RS-5668 | |
| Dumont #5 - Fine Forceps | Fine Science tools | 11254-20 | |
| Dumont #5 Forceps | Fine Science tools | 11252-50 | |
| Dumont Medical #5/45 Forceps - Angled 45° | Fine Science tools | 11253-25 | |
| ExiTron nano 12000 | Miltenyi Biotec | 130 - 095 - 698 | CT contrast agent |
| Forceps | Fine Science tools | 11027-12 | |
| Halsted-Mosquito Hemostat | Roboz Surgical | RS-7112 | |
| heparin | Fresnius Lab, Lake Zurich, IL | C504701 | |
| histidine-trypotophan-ketoglutarate | University Pharmacy | NA | |
| Insulated Container | YETI | ROADIE 24 HARD COOLER | https://www.yeti.com/coolers/hard-coolers/roadie/10022350000.html |
| Isoflurane | Piramal Critical Care | NDC 66794-017-25 | |
| ketamine | Hikma Pharmaceuticals PLC | NDC 0413-9505-10 | |
| Mirco Serrefines | Fine Science tools | 18055-05 | |
| Mouse Rectal Temperature Probe | WPI Inc | NA | |
| NEEDLE HOLDER/FORCEPS straight | Micrins | MI1540 | |
| PE10 Tubing | Fisher Scientific | BD 427400 | |
| perfadex | XVIVO Perfusion AB | REF99450 | |
| PhysioSuite | Kent Scientific | PS-MSTAT-RT | |
| Puralube Ophthalmic Ointment | Dechra | NA | |
| saline | PP Pharmaceuticals LLC | NDC 63323-186-10 | |
| Scissors | Fine Science tools | 14090-11 | |
| Small Mouse Restraint – 1” inner diameter | Pro Lab Corp | MH-100 | |
| SomnoSuite Small Animal Anesthesia System | Kent scientific | SS-MVG-Module | |
| Surgical microscope | Leica | M500-N w/ OHS | |
| U-CTHR | MI Labs | NA | CT Scanner software |
| Vannas-Tubingen Spring Scissors | Fine Science Tools | 15008-08 | |
| xylazine | Korn Pharmaceuticals Corp | NDC 59399-110-20 | |
| Yasagil clamp | Aesculap | FT351T | |
| Yasagil clamp | Aesculap | FT261T | |
| Yasagil clamp applicator | Aesculap | FT484T |
References
- Rana, A., et al. Survival benefit of solid-organ transplant in the United States. JAMA Surgery. 150 (3), 252-259 (2015).
- Qian, S. G., Fung, J. J., Demetris, A. V., Ildstad, S. T., Starzl, T. E. Orthotopic liver transplantation in the mouse. Transplantation. 52 (3), 562-564 (1991).
- Nakano, R., et al. Dendritic cell-mediated regulation of liver ischemia-reperfusion injury and liver transplant rejection. Frontiers in Immunology. 12, 705465(2021).
- Nakamura, K., et al. Antibiotic pretreatment alleviates liver transplant damage in mice and humans. Journal of Clinical Investigation. 129 (8), 3420-3434 (2019).
- Lee, S. K., et al. Patient-derived Avatar mouse model to predict the liver immune homeostasis of long-term stable liver transplant patients. Frontiers in Immunology. 13, 817006(2022).
- Li, S. P., et al. Characterization and proteomic analyses of proinflammatory cytokines in a mouse model of liver transplant rejection. Oxidative Medicine and Cellular Longevity. 2022, 5188584(2022).
- Huang, D. R., Wu, Z. J., Zhu, Y. Modified arterialization of orthotopic liver transplantation in a mouse model. Hepatobiliary Pancreatic Disease International. 9 (3), 264-268 (2010).
- Yokota, S., et al. Orthotopic mouse liver transplantation to study liver biology and allograft tolerance. Nature Protocols. 11 (7), 1163-1174 (2016).
- Chen, X. C., et al. Reduced complications after arterial reconnection in a rat model of orthotopic liver transplantation. Journal of Visual Experiments. (165), e60628(2020).
- Nelson, K., et al. Method of isolated ex vivo lung perfusion in a rat model: lessons learned from developing a rat EVLP program. Journal of Visual Experiments. (96), e52309(2015).
- Nelson, K., et al. Animal models of ex vivo lung perfusion as a platform for transplantation research. World Journal of Experimental Medicine. 4 (2), 7-15 (2014).
- Lee, Y. G., et al. A rat lung transplantation model of warm ischemia/reperfusion injury: optimizations to improve outcomes. Journal of Visual Experiments. (176), e62445(2021).
- Di Martino, M., et al. Imaging follow-up after liver transplantation. British Journal of Radiology. 89 (1064), 20151025(2016).
- Vardar, B. U., Dupuis, C. S., Goldstein, A. J., Vardar, Z., Kim, Y. H. Ultrasonographic evaluation of patients with abnormal liver function tests in the emergency department. Ultrasonography. 41 (2), 243-262 (2022).
- Marx, J. Imaging. Animal models: live and in color. Science. 302 (5652), 1880-1882 (2003).
- Maehara, N. Experimental microcomputed tomography study of the 3D microangioarchitecture of tumors. European Radiology. 13 (7), 1559-1565 (2003).
- Garcia-Sanz, A., Rodriguez-Barbero, A., Bentley, M. D., Ritman, E. L., Romero, J. C. Three-dimensional microcomputed tomography of renal vasculature in rats. Hypertension. 31, 440-444 (1998).
- Badea, C., Hedlund, L. W., Johnson, G. A. Micro-CT with respiratory and cardiac gating. Medical Physics. 31 (12), 3324-3329 (2004).
- Ma, G., et al. Assessment of hemodynamics in a rat model of liver cirrhosis with precancerous lesions using multislice spiral CT perfusion imaging. BioMed Research International. 2013, 813174(2013).
- Mannheim, J. G., et al. Comparison of small animal CT contrast agents. Contrast Media and Molecular Imaging. 11 (4), 272-284 (2016).
- Rothe, J. H., et al. Time course of contrast enhancement by micro-CT with dedicated contrast agents in normal mice and mice with hepatocellular carcinoma: comparison of one iodinated and two nanoparticle-based agents. Academic Radiology. 22 (2), 169-178 (2015).
Reprints and Permissions
