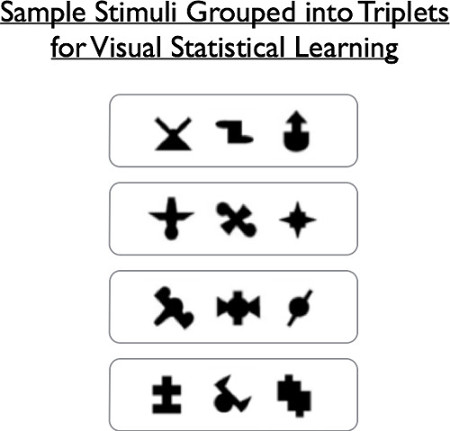
1. Generate a set of nonsense objects and arrange them into a triplet structure.

2. Sequence the experiment.

3. Familiarity test
Learning regularities-the statistical structures of objects in our external world-is an important part of visual processing.
Objects in our visual environment occur in the dimensions of space and time. Certain objects are more likely to appear near others, like a coffee cup next to a computer.
Such occurrences provide regularities that support predictable object recognition, in which humans learn automatically and quickly, without conscious awareness.
This video demonstrates how to setup and conduct a visual statistical learning experiment using an incidental encoding paradigm, as well as how to analyze the data and interpret the results.
In this experiment, the stimuli-sets of nonsense objects grouped into triplets-are displayed on the center of a computer screen, one at a time, for 250 ms each.
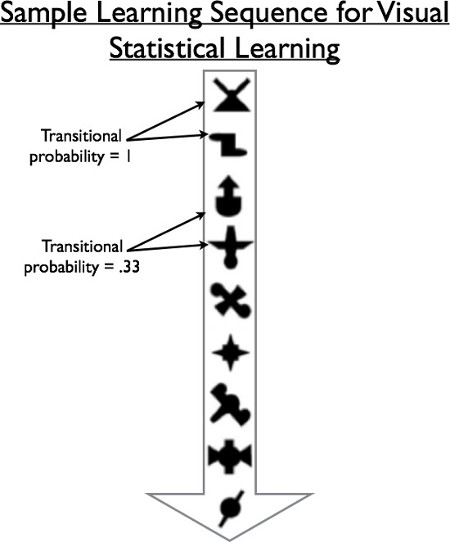
To establish regularities-the statistical structure-the objects within a triplet are always shown in the same sequence, but the order of triplets is presented at random.
Thus, the transitional probability between elements of a given triplet is always 1, whereas the transitional probabilities between unrelated elements are considerably lower.
In order to unknowingly expose participants to the object sequences, a cover task is used with colored objects. In this case, participants are asked to make a response when the objects are gray and to withhold when the objects randomly appear red.
After the cover task is completed, participants are given a familiarity task to test the extent of encoding the previous nonsense objects. During each familiarity trial, previously viewed triplets are randomly presented along with newly generated triplets, referred to as foils.
Now, participants are asked to identify which set is more familiar. The dependent variable then is the number of times participants correctly identify the prior triplets as most familiar, rather than the foils.
If no learning occurs during the initial encoding phase, the actual and foil triplets would be picked the same number of times. On the other hand, if learning occurred, the actual triplets will be picked more frequently than the foils.
Before the participant arrives, verify that the stimuli and coding parameters to be used have been generated.
To begin the experiment, greet the participant in the lab and explain the general procedures that will be used for the task.
Have the participant sit comfortably in front of the computer monitor and keyboard. Explain that when a gray object appears on the screen they should press the 'J' key, and when red objects appear they should withhold responses.
Once the participant understands the task rules, start the first portion of the experiment, the incidental encoding phase. Expose the participants to the object sequences for 10 min.
After the short exposure period, explain that there is one more task to complete in a 5 min period. Instruct the participant that they will now see two sets of triplets and should press the 1-key or the 2-key to indicate which grouping looks more familiar. Tell them that they should guess if they don't recognize either.
After confirming that the participant is ready to begin, start the 30 familiarity trials.
To analyze the data in the familiarity phase, score each trial where the participant chose the familiar triplet as correct and the foil triplet as incorrect.
To visualize the results, graph the mean of the percent correct responses across participants. Because chance performance is 50%, note that visual statistical learning occurred, as participants correctly identified the familiar objects around 70% of the time.
Now that you are familiar with the methods of inducing and testing visual statistical learning, let's take a look at other ways experimental psychologists use statistics to investigate learning.
The paradigm can be translated into broader classes of sensory learning mechanisms that include the auditory domain. For example, infants and children use auditory statistics in early language formation because the sounds and letters in a language tend to appear with highly reliable statistical relationships.
In another experiment, researchers investigated how the associations between letters and colors can be unknowingly or implicitly learned. Over several days, participants read texts that were customized to have four distinctly colored letters.
When asked to identify the color of letters presented on a screen, participants were faster and more accurate for letter-color pairs that were the same as in the customized text. This suggests that the statistical structure of the colored letters was implicitly learned.
You've just watched JoVE's introduction to visual statistical learning. Now you should have a good understanding of how to setup and perform the experiment, as well as analyze and assess the results.
Thanks for watching!
Source: Laboratory of Jonathan Flombaum—Johns Hopkins University
The visual environment contains massive amounts of information involving the relation…
1. Generate a set of nonsense objects and arrange them into a triplet structure.

2. Sequence the experiment.

3. Familiarity test
Learning regularities-the statistical structures of objects in our external world-is an important part of visual processing.
Objects in our visual environment occur in the dimensions of space and time. Certain objects are more likely to appear near others, like a coffee cup next to a computer.
Such occurrences provide regularities that support predictable object recognition, in which humans learn automatically and quickly, without conscious awareness.
This video demonstrates how to setup and conduct a visual statistical learning experiment using an incidental encoding paradigm, as well as how to analyze the data and interpret the results.
In this experiment, the stimuli-sets of nonsense objects grouped into triplets-are displayed on the center of a computer screen, one at a time, for 250 ms each.
To establish regularities-the statistical structure-the objects within a triplet are always shown in the same sequence, but the order of triplets is presented at random.
Thus, the transitional probability between elements of a given triplet is always 1, whereas the transitional probabilities between unrelated elements are considerably lower.
In order to unknowingly expose participants to the object sequences, a cover task is used with colored objects. In this case, participants are asked to make a response when the objects are gray and to withhold when the objects randomly appear red.
After the cover task is completed, participants are given a familiarity task to test the extent of encoding the previous nonsense objects. During each familiarity trial, previously viewed triplets are randomly presented along with newly generated triplets, referred to as foils.
Now, participants are asked to identify which set is more familiar. The dependent variable then is the number of times participants correctly identify the prior triplets as most familiar, rather than the foils.
If no learning occurs during the initial encoding phase, the actual and foil triplets would be picked the same number of times. On the other hand, if learning occurred, the actual triplets will be picked more frequently than the foils.
Before the participant arrives, verify that the stimuli and coding parameters to be used have been generated.
To begin the experiment, greet the participant in the lab and explain the general procedures that will be used for the task.
Have the participant sit comfortably in front of the computer monitor and keyboard. Explain that when a gray object appears on the screen they should press the 'J' key, and when red objects appear they should withhold responses.
Once the participant understands the task rules, start the first portion of the experiment, the incidental encoding phase. Expose the participants to the object sequences for 10 min.
After the short exposure period, explain that there is one more task to complete in a 5 min period. Instruct the participant that they will now see two sets of triplets and should press the 1-key or the 2-key to indicate which grouping looks more familiar. Tell them that they should guess if they don't recognize either.
After confirming that the participant is ready to begin, start the 30 familiarity trials.
To analyze the data in the familiarity phase, score each trial where the participant chose the familiar triplet as correct and the foil triplet as incorrect.
To visualize the results, graph the mean of the percent correct responses across participants. Because chance performance is 50%, note that visual statistical learning occurred, as participants correctly identified the familiar objects around 70% of the time.
Now that you are familiar with the methods of inducing and testing visual statistical learning, let's take a look at other ways experimental psychologists use statistics to investigate learning.
The paradigm can be translated into broader classes of sensory learning mechanisms that include the auditory domain. For example, infants and children use auditory statistics in early language formation because the sounds and letters in a language tend to appear with highly reliable statistical relationships.
In another experiment, researchers investigated how the associations between letters and colors can be unknowingly or implicitly learned. Over several days, participants read texts that were customized to have four distinctly colored letters.
When asked to identify the color of letters presented on a screen, participants were faster and more accurate for letter-color pairs that were the same as in the customized text. This suggests that the statistical structure of the colored letters was implicitly learned.
You've just watched JoVE's introduction to visual statistical learning. Now you should have a good understanding of how to setup and perform the experiment, as well as analyze and assess the results.
Thanks for watching!
Learning regularities-the statistical structures of objects in our external world-is an important part of visual processing.
Objects in our visual environment occur in the dimensions of space and time. Certain objects are more likely to appear near others, like a coffee cup next to a computer.
Such occurrences provide regularities that support predictable object recognition, in which humans learn automatically and quickly, without conscious awareness.
This video demonstrates how to setup and conduct a visual statistical learning experiment using an incidental encoding paradigm, as well as how to analyze the data and interpret the results.
In this experiment, the stimuli-sets of nonsense objects grouped into triplets-are displayed on the center of a computer screen, one at a time, for 250 ms each.
To establish regularities-the statistical structure-the objects within a triplet are always shown in the same sequence, but the order of triplets is presented at random.
Thus, the transitional probability between elements of a given triplet is always 1, whereas the transitional probabilities between unrelated elements are considerably lower.
In order to unknowingly expose participants to the object sequences, a cover task is used with colored objects. In this case, participants are asked to make a response when the objects are gray and to withhold when the objects randomly appear red.
After the cover task is completed, participants are given a familiarity task to test the extent of encoding the previous nonsense objects. During each familiarity trial, previously viewed triplets are randomly presented along with newly generated triplets, referred to as foils.
Now, participants are asked to identify which set is more familiar. The dependent variable then is the number of times participants correctly identify the prior triplets as most familiar, rather than the foils.
If no learning occurs during the initial encoding phase, the actual and foil triplets would be picked the same number of times. On the other hand, if learning occurred, the actual triplets will be picked more frequently than the foils.
Before the participant arrives, verify that the stimuli and coding parameters to be used have been generated.
To begin the experiment, greet the participant in the lab and explain the general procedures that will be used for the task.
Have the participant sit comfortably in front of the computer monitor and keyboard. Explain that when a gray object appears on the screen they should press the 'J' key, and when red objects appear they should withhold responses.
Once the participant understands the task rules, start the first portion of the experiment, the incidental encoding phase. Expose the participants to the object sequences for 10 min.
After the short exposure period, explain that there is one more task to complete in a 5 min period. Instruct the participant that they will now see two sets of triplets and should press the 1-key or the 2-key to indicate which grouping looks more familiar. Tell them that they should guess if they don't recognize either.
After confirming that the participant is ready to begin, start the 30 familiarity trials.
To analyze the data in the familiarity phase, score each trial where the participant chose the familiar triplet as correct and the foil triplet as incorrect.
To visualize the results, graph the mean of the percent correct responses across participants. Because chance performance is 50%, note that visual statistical learning occurred, as participants correctly identified the familiar objects around 70% of the time.
Now that you are familiar with the methods of inducing and testing visual statistical learning, let's take a look at other ways experimental psychologists use statistics to investigate learning.
The paradigm can be translated into broader classes of sensory learning mechanisms that include the auditory domain. For example, infants and children use auditory statistics in early language formation because the sounds and letters in a language tend to appear with highly reliable statistical relationships.
In another experiment, researchers investigated how the associations between letters and colors can be unknowingly or implicitly learned. Over several days, participants read texts that were customized to have four distinctly colored letters.
When asked to identify the color of letters presented on a screen, participants were faster and more accurate for letter-color pairs that were the same as in the customized text. This suggests that the statistical structure of the colored letters was implicitly learned.
You've just watched JoVE's introduction to visual statistical learning. Now you should have a good understanding of how to setup and perform the experiment, as well as analyze and assess the results.
Thanks for watching!
View the full transcript and gain access to JoVE Science Education videos
Q1: What is visual statistical learning and how does it work?
Visual statistical learning is the automatic, implicit acquisition of regularities in the visual environment—patterns in how objects appear together in space and time. Humans learn these statistical structures quickly and without conscious awareness. For example, a coffee cup frequently appears near a computer, creating predictable associations that support object recognition and visual processing.
Q2: How does the incidental encoding paradigm test visual statistical learning?
The incidental encoding paradigm exposes participants to nonsense object triplets displayed sequentially for 250 milliseconds each. A cover task—asking participants to respond to gray objects and withhold responses to red ones—distracts from the underlying statistical structure. This unrelated task ensures learning occurs implicitly, without participants' conscious awareness of the object patterns.
Q3: What is transitional probability in visual statistical learning experiments?
Transitional probability measures the likelihood that one object will follow another in a sequence. In visual statistical learning, objects within a triplet always appear in the same order, creating a transitional probability of 1.0 between those elements. Unrelated objects have much lower transitional probabilities, establishing the statistical structure participants implicitly learn.
Q4: How is learning assessed in the familiarity test phase?
After the encoding phase, participants complete a familiarity task where they view pairs of triplets—previously seen triplets and newly generated foils—and indicate which looks more familiar. The dependent variable is the number of correct identifications of familiar triplets. If learning occurred, participants select familiar triplets significantly more often than the 50% chance rate.
Q5: What results indicate that visual statistical learning has occurred?
Visual statistical learning is demonstrated when participants correctly identify familiar triplets at rates significantly above chance performance of 50%. In typical experiments, participants achieve approximately 70% accuracy on the familiarity task, indicating they have implicitly learned the statistical structure of the object sequences during the brief 10-minute encoding period.
Q6: How does visual statistical learning extend to other sensory domains?
The visual statistical learning paradigm translates to broader sensory learning mechanisms, including auditory domains. Infants and children use auditory statistics in early language formation, learning reliable statistical relationships between sounds and letters. Similarly, researchers have shown that letter-color associations can be implicitly learned through exposure to customized texts with distinctly colored letters.
Q7: Why is a cover task necessary in visual statistical learning experiments?
A cover task is essential to ensure learning occurs implicitly, without participants' conscious awareness of the statistical structure. By directing attention to an unrelated task—such as responding to colored objects—researchers prevent participants from deliberately searching for or consciously encoding the object sequences, thereby measuring true implicit learning mechanisms.
Chapters in this video
0:00
Overview
0:52
Experimental Design
2:36
Running the Experiment
3:55
Representative Results
4:31
Applications
5:40
Summary
Videos from this collection: