Ultraviolet-visible, or UV-Vis, spectroscopy is one of the most popular analytical techniques in the laboratory.
In UV-Vis spectroscopy, light is passed through a sample at a specific wavelength in the UV or visible spectrum. If the sample absorbs some of the light, not all of the light will be pass through, or be transmitted. Transmission is the ratio of the intensity of the transmitted light to the incident light, and is correlated to absorbance. The absorbance can be used in a quantitative manner, to obtain the concentration of a sample. It can also be used in a qualitative manner, to identify a compound by matching the measured absorbance over a range of wavelengths, called the absorbance spectrum, to the published data. This video will introduce UV-Vis spectroscopy, and demonstrate its use in the laboratory in determining sample concentration and reaction kinetics.
When a photon hits a molecule and is absorbed, the molecule is promoted from its ground state into a higher energy state. The energy difference between the two is the band gap. The energy of the photon must exactly match the band gap in order for the photon to be absorbed. The chemical structure determines the band gap; therefore molecules each have unique absorbance spectra.
Absorbance follows Beer’s Law, which states absorbance equals the molar attenuation coefficient times the path length and concentration. The molar attenuation coefficient is related to the individual compound’s ability to absorb light of a specific wavelength. Path length refers to the distance traveled by light through the sample, which is typically 1 cm for standard cuvettes. Beer’s law can be used to calculate sample concentration, if the absorptivity is known, or a calibration curve can be used.
UV-Vis is often called a general technique, as most molecules absorb light in the UV-visible wavelength range. The UV range extends from 100–400 nm, and the visible spectrum ranges from 400–700 nm. However, most spectrophotometers do not operate in the deep UV range of 100–200 nm, as light sources in this range are expensive. Most UV-Vis spectrophotometers use a deuterium lamp for the UV range, which produces light from 170–375 nm, and a tungsten filament lamp for the visible range, which produces light from 350–2,500 nm.
Since the light source is usually a lamp with broad wavelength ranges, the specific absorbance wavelength is selected using filters or a monochromator. A monochromator is a device that separates the wavelengths of light spatially, and then places an exit slit where the desired wavelength of light is. The monochromator can be scanned over a wavelength range to provide an entire absorbance spectrum. This makes the technique useful for quantifying and identifying a wide range of molecules.
Now that the basics of UV-Vis spectroscopy have been outlined, lets take a look at a simple UV-Vis experiment in the laboratory.
Before beginning the measurement, turn on the spectrophotometer, and allow the lamps to warm up for an appropriate period of time to stabilize them.
Prepare a blank by filling a clean cuvette with the sample solvent, and then wipe the outside with lint-free paper to remove any fingerprints.
Ensure that the cuvette is aligned properly with any grooved sides out of the beam-path, and insert it into the spectrophotometer. Secure the lid to prevent ambient light from entering the system.
Measure the absorbance of the blank at one wavelength, or over a wavelength range. Record or save the absorbance, as it must be subtracted from the absorbance of the sample.
Next, discard the blank and rinse the cuvette twice with sample. Then, fill the cuvette about ¾ full with sample. Wipe the outside of the cuvette again, to ensure that it is clean and free of fingerprints.
Place the cuvette in the spectrophotometer in the correct orientation, and secure the lid.
Collect an absorbance measurement or spectrum at the same wavelength or wavelength range as the blank. Subtract the blank spectrum or measurement, if the instrument does not automatically do so.
From the collected absorbance spectrum, determine the absorbance maximum, or λmax.
To quantify the amount of analyte in the sample, create a calibration curve using a range of known analyte concentrations. For more information on how to construct and use a calibration curve, please watch this collection’s video “Calibration Curves”.
The absorbance measurement can also be used to calculate reaction kinetics by measuring the increase or decrease in a compounds concentration throughout the reaction. Begin by taking an initial reading of the sample, blue dye in this case, at the absorbance maximum before the reaction.
Next, quickly add the reagent, bleach in this case, to start the chemical reaction. Stir it well, so that it mixes with the sample.
Measure the absorbance at the absorbance maximum over time.
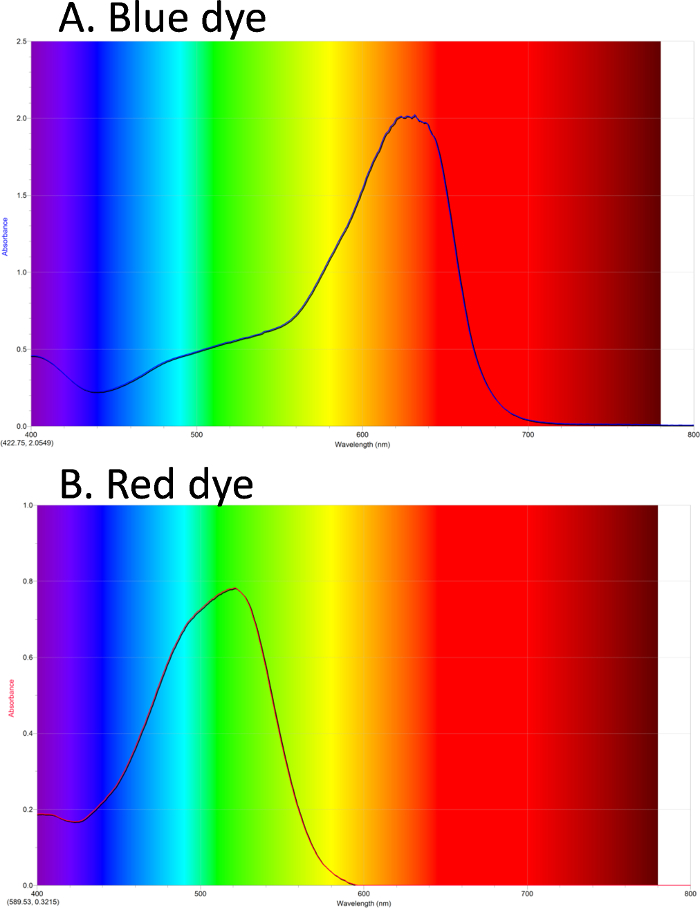
The initial absorbance spectrum of the blue dye sample is shown. The background colors show the colors of light in the visible spectrum. The blue dye has an absorbance maximum at about 630 nm.
The kinetics of the reaction between blue dye and bleach was measured over time. The absorbance of blue dye decreases over time, as it reacts with the bleach. The absorbance reaches near zero after 300 s, indicating that the reaction has neared completion. For more information on kinetics and reactions, please watch the JoVE Science Education video “Reaction Rate Laws”.
UV-Vis spectroscopy is used heavily in many different research areas to identify or quantify a sample.
For example, UV-Vis spectroscopy is used heavily in biological fields to quantify the amount of protein in a sample. A Bradford assay is often used to quantify proteins, with the aid of a dye. First, a calibration curve of known protein concentrations is prepared, typically using Bovine Serum Albumin, or BSA. Then Coomassie blue stain is added to each of the standards and to the sample. The absorbance of the protein-dye complex is then measured at 595 nm.
Alternatively, proteins can be measured directly by their absorbance at 280 nm. In this example, protein concentration is quantified using an ultra low volume spectrophotometer. For many proteins, an absorbance of 1 correlates to a concentration of 1 mg/mL.
UV-Vis spectroscopy is also used to quantify the amount of bacterial cells in a cell culture. For this measurement, the absorbance, or optical density, is measured at 600 nm. Typically, an OD600 measurement of 1 indicates the presence of 8 x 10⁸ bacterial cells per mL. Measuring the cell density throughout culture growth enables the determination of the bacterial growth curve, and can help to identify when a culture is in its exponential growth phase.
Nitrogen oxide and nitrogen dioxide, or NOx, is a by-product of automobile exhaust, and can be harmful to the environment because it forms damaging tropospheric ozone. NOx can be measured by reacting it with a solution of sulfanilic acid and napthyl-ethylenediamine. The resulting solution is a pink colored azo dye molecule, the intensity of which is directly correlated to NOx concentration. This concentration can then be determined using a UV-Vis spectrophotometer.
You’ve just watched JoVE’s introduction to UV-visible spectroscopy. You should now understand the basics of UV-Vis operation, how to measure a sample using a UV-Vis and how to correlate absorbance to sample concentration.
Thanks for watching!