JoVE Science Education
Chemical Engineering
A subscription to JoVE is required to view this content.  Sign in or start your free trial.
JoVE Science Education Chemical Engineering
Single and Two-phase Flow in a Packed Bed Reactor
  • 00:07Overview
  • 01:08Principles of Flow in a Packed Bed
  • 04:14Reactor Start-up
  • 05:15Tracer Test
  • 06:09Two-phase Flow Experiment
  • 07:26Data Processing and Results
  • 08:50Applications
  • 10:20Summary

충전 층 반응기의 단상 및 2상 흐름

English

Share

Overview

출처: 케리 M. 둘리와 마이클 G. 벤턴, 화학 공학부, 루이지애나 주립 대학, 배턴 루지, LA

이 실험의 목적은 단일 상 및 2상(가스-액체) 흐름 모두에서 일반적인 포장된 침대 반응기에서 분포의 크기를 결정하고 압력 강하에 대한 이러한 분포의 영향을 평가하는 것입니다. 거주 시간 분포 및 분산의 개념은 추적자를 사용하여 도입되며 이러한 개념은 물리적 배포와 관련이 있습니다.

단상 흐름으로 채널링은 벽을 따라 또는 침대 단면의 큰 부분을 통해 우대 흐름에 의해 발생할 수 있습니다. 2상 흐름으로 채널링은 더욱 복잡한 원인으로 인해 발생할 수 있으며, 간단한 2상 흐름 이론은 포장된 침대에서 압력 강하를 예측하는 경우는 거의 없습니다. 설계 목표는 설계 유량에 대한 최적의 침대와 입자 직경을 찾고 침전을 최소화하는 방법으로 침대를 포장하여 채널링 의 정도를 최소화하는 것입니다. 배포가 발생할 수 있는 금액을 정량화하고 해당 발생을 설명하기 위해 장치를 과도하게 설계하는 것이 항상 중요합니다.

투과계 장치는 물, 공기 또는 2상 유동(그림 1 및 2)을 위해 장갑 유리의 수평 포장 된 침대를 빠져나가는 압력 강하, ΔP 및 추적기 (염료)의 농도를 측정합니다. 물은 제어 밸브를 통해 입력하고 다른 크기의 유리 비드 덤프 (무작위) 포장 다섯 침대 (48″긴, 3″I.D.) 중 어느 5 개의 침대 (48″길이, 3″I.D.)에 수동 밸브를 통해 라우팅 할 수 있습니다. 압력 강하는 압력 송신기를 사용하여 측정됩니다. 물 흐름은 건조 시험 미터(가정용 가스 미터와 유사)에 의해 차압(DP, orifice) 송신기 및 공기 흐름에 의해 측정됩니다. 염료 샘플은 자동화된 샘플링 밸브에 의해 상류에 주입됩니다. 침대에서 염료의 출구 농도는 UV-Vis 분광계를 사용하여 측정됩니다. 거주 시간 분포는 테스트에서 계산되며 포장 된 침대에서 분산에 대한 이론의 예측과 비교됩니다. 2상 유동은 가장 큰 입자를 포함하는 침대 5에서 공부될 것입니다.

Figure 1
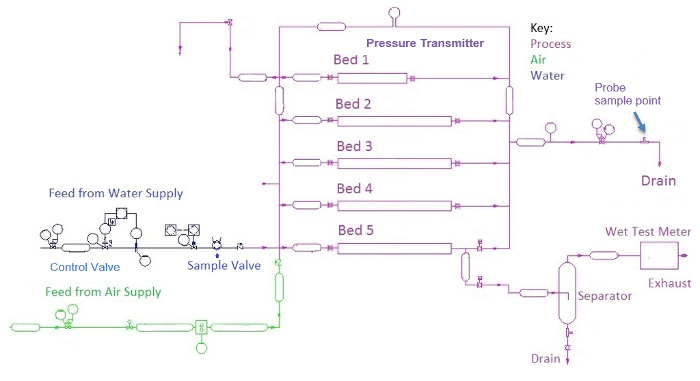
그림 1: 장치의 공정 및 계측 다이어그램.

Figure 2
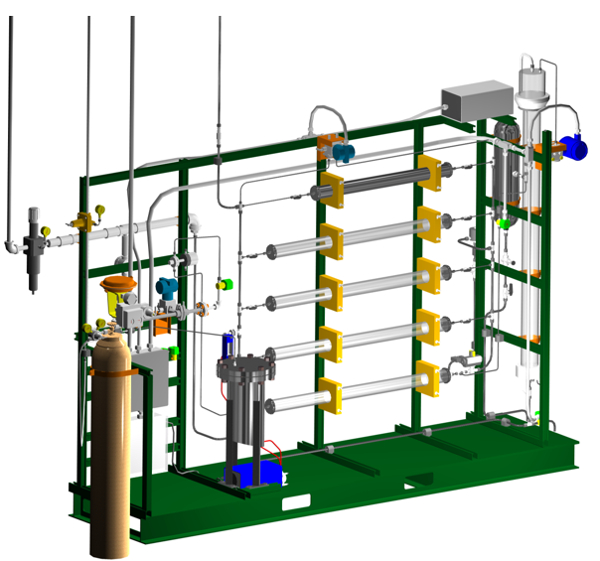
그림 2. 장치의 3-D 렌더링. 침대 #1 상단에, 침대 #5 하단에 있습니다. 물 제어 밸브는 왼쪽 (빨간색 보닛)에 있습니다. DP 송신기는 상단 중심(파란색)에 있습니다.

Principles

Procedure

1. 장치 시작 장치는 주로 분산 제어 시스템 인터페이스를 통해 작동됩니다. 파마 P&ID 회로도가 나타나고 자동 밸브를 열고 닫는 것이 포인트 앤 클릭입니다. #4 또는 #5 침대로 물 흐름을 설정하려면 시험 중인 침대로 입구및 출구 밸브를 열고 물 공급 솔레노이드를 설치합니다. 흐름 컨트롤러를 사용하여 침대를 통해 물이 흐르기 시작하여 점차적으…

Results

Obtain the RTDs (E-curves, using Equations 1-2) after subtracting an appropriate baseline (if necessary) from the spectrometer signals. An example of baseline correction for Bed #3 (not used here) is in Figure 3. Using Equations 1-3, calculate the average porosity, tracer mass, mean residence time, variance and variance divided by mean squared from the RTDs. Compare calculated tracer mass with injected mass – if they aren't within expected precision, examine how the baseline was determined in the spectrometer measurements (and perhaps determine differently). Examine how the variance compares to the prediction from dispersion theory (Equations 4-5); deviations denote excessive channeling.

Figure 3
Figure 3. Bed #3 dimensionless RTD E-curve (390 mL/min, 50 ppm tracer injection) with and without baseline correction. The calculated tau from Equations 2 and 3 was 3.6 min. The baseline correction was made by subtracting two average baseline values, one before and one after the maximum. The one before was subtracted from all values prior to the maximum, the other after was subtraced from all values after the maximum.

Once the porosities of the beds (Equation 3) have been found, the Ergun equation can be used to predict the ΔP's for the water flow experiments. The average particle diameter must first be calculated. Because particle drag is related to area for flow, the surface-area (d2) weighting is usually the best way to obtain the average diameter for a range of particles. The average diameter can be computed as follows, obtaining the particle diameters from the information in the Materials List (ωi is the wt fraction of particles of diameter di):

Equation 11 (9)

The calculated porosities can be used to pinpoint the cause of any discrepancies between predicted (by the Ergun equation) and measured ΔP's. For example, the minimum porosity for close-packed spheres is 0.36. It is unlikely that any real ε of an entire bed is less than 0.3. Predicted ΔP's >> actual ΔP's suggest channeling (short-circuiting) along the walls or in the upper portion of the bed when settling occurs. Such phenomena would result in a low ε calculated from the E-curve, leading to high predicted ΔP's. This is the case in Figure 4 for both beds #3 and 4. Note that the more expected ε = 0.36 reproduced the Ergun equation results except at a very high flow rate where a high percentage of the flow was through low voidage regions. This channeling can actually be observed in the experiment.

Figure 4
Figure 4. Experimental ΔP's compared to the predictions of the Ergun equation, both at ε = 0.36 and the ε values determined from the E-curves.

Predicted ΔP's << actual ΔP's suggest channeling only through the lower half of the bed, or partial bed blockage. For these beds, this is unlikely.

For the two-phase flows, compute predicted ΔP's by both homogeneous flow and stratified flow theories using Equations 6-9. For stratified flow, one must solve the Ergun equation and Equation 9 simultaneously to obtain α, setting Ergun ΔP/L (liquid) = Ergun ΔP/L (gas). Then compare computed vs. actual ΔP's and see which theory applies best, or if in fact either theory applies. Other flow regimes (e.g., slug, mist or inhomogeneous bubbly flows) are possible, as are major flow distortions due to channeling, which is often more prevalent in two-phase flows.

For two-phase flows through bed #5, the ΔP's calculated using homogeneous flow theory prove to be better than those using stratified flow theory (Table 1), although as seen neither theory applies exactly. The high actual ΔP's suggest severe channeling in a horizontal bed during two-phase flow – the liquid is confined to a small portion of the cross-sectional area. Indeed, the gas volume fractions estimated by visual inspection looked to be at least 0.90. The liquid was also confined to the non-wall region of lower voidage, which increases ΔP. The results reflect the limitations of the simpler rheological models for two-phase flow, and why far more sophisticated microrheological models are finding more use today.

Table 1: Gas volume fractions α and pressure drops in two-phase flow, bed #5.

Q water Q air Q air α 
(stratified)
ΔDP
(stratified)
psi
ΔDP
(homogeneous)
psi
ΔDP
(actual)
psi
mL/min ft3/min mL/min
1100 1.62 45900 0.58 2.2 12 17
1100 1.26 35700 0.47 1.7 10 14
1100 1.11 31400 0.38 1.5 9.5 11
1100 0.930 26300 0.19 1.3 8.6 8
500 0.73 20700 0.58 0.66 3.4 12
500 0.50 14200 0.47 0.50 2.7 9
500 0.39 11000 0.38 0.40 2.7 6
500 0.16 4250 0.19 0.29 1.4 3

Applications and Summary

In this experiment the real flow behavior of horizontal packed beds, both in single and two-phase flow, was contrasted to the simpler theoretical models for pressure drop and dispersion (flow spreading in the axial direction, deviating from plug flow). The utility of tracer tests in probing for maldistribution ("channeling") in such beds has been demonstrated, and it has even been shown that certain metrics calculated from the tracer tests can give some idea of the cause of the channeling. These calculations using the tracer tests, such as computing the E-curve, are normally known as "residence time distribution" (RTD) theory.

Channeling in single-phase flow can occur along walls or any other low voidage region, for example, if settling occurs in a horizontal bed. Channeling in two-phase flow can result from even more complex causes, and as seen simple two-phase flow theories seldom predict pressure drops in packed beds. Channeling increases downstream separation costs or can ruin the product. A goal of design is always to minimize the extent of channeling by finding the optimal bed and particle diameters for a given desired Q, and by packing a bed in a way to minimize settling.

The tracer method of testing is a simple way to quantify the RTD. However, the tracers are seldom the same molecules as used in the process (although they can be close, if isotopes are used). Therefore, tracer molecules may not behave in exactly the same ways as reactant or adsorbate molecules in the fluid phase. In particular, it is important that the tracer not adsorb on the solid particles, because then it cannot be fully characteristic of a fluid molecule.

The time each molecule of a reactant spends inside a chemical reactor is an important determinant of the macroscopic conversion and selectivity to the desired product. The occurrence of "dead zones" (regions of stagnant flow) often lead to poorer than expected selectivities even when the conversions are not much affected. This is one reason why RTD theory is so important in reactor design.4

Tracers are also used by environmental and petroleum engineers to help characterize subsurface solid packing structure. In these applications, two wells are drilled some distance apart; a tracer is injected into one and recovered at the other. Because the earth's subsurface is highly heterogeneous, the effluent profiles (E-curves) are typically nonsymmetrical, indicating the presence of preferential flow paths. This information helps characterize the structure of the subsurface strata, which is important for modeling petroleum recovery and contaminant transport in groundwater.

In environmental engineering, the use of partitioning tracers can be used to locate and quantify organic contaminants in subsurface strata. An inert tracer is injected to characterize the flowing (aqueous) phase between two wells. A partitioning tracer is then injected, partitioning preferentially into an organic contaminant phase if one exists. The tracer is light enough that it will eventually diffuse out of the organic phase. This behavior manifests itself as a time delay as compared to the inert tracer, and comparison of these two can be used to deduce the volume of stagnant organic phase present.

Two-phase flows are also commonly found in power plants, in non-reactor, non-adsorber applications. An example is boiling heat transfer, with the steam created in a boiler. They are also found in all distillation columns, absorbers and strippers, although in vertical rather than horizontal configuration.

Materials List

Name Company Catalog Number Comments
Equipment
Bed #3 glass beads Grainger 25-40 mesh (50%)

60-120 mesh (50%)

Packed in parallel
Bed #4 glass beads and blast sand Grainger 60-120 mesh (90%) – glass

80-120 mesh (6%) – glass

120-200 mesh (4%) – sand

Mixed together
Bed #5 glass beads Grainger 5-10 mesh
Dry test meter Singer Model 803
Fiber-optic UV-Vis spectrometer Ocean Optics Model USB2000 Includes Ocean Optics DT-1000 light source
Test tubes VWR 10 mL For calibration
Reagents
Yellow/green fluorescent dye Cole-Parmer 0298-17 Used to make up tracer solutions

Materials

Equipment
Bed #3 glass beads Grainger 25-40 mesh (50%)

60-120 mesh (50%)

Packed in parallel
Bed #4 glass beads and blast sand Grainger 60-120 mesh (90%) – glass

80-120 mesh (6%) – glass

120-200 mesh (4%) – sand

Mixed together
Bed #5 glass beads Grainger 5-10 mesh
Dry test meter Singer Model 803
Fiber-optic UV-Vis spectrometer Ocean Optics Model USB2000 Includes Ocean Optics DT-1000 light source
Test tubes VWR 10 mL For calibration
Reagents
Yellow/green fluorescent dye Cole-Parmer 0298-17 Used to make up tracer solutions

References

  1. Encyclopedia of Chemical Engineering Equipment." Distillation Columns. http://encyclopedia.che.engin.umich.edu/Pages/SeparationsChemical/DistillationColumns/DistillationColumns.html. Accessed 9/22/16.
  2. Encyclopedia of Chemical Engineering Equipment." Absorbers. http://encyclopedia.che.engin.umich.edu/Pages/SeparationsChemical/Absorbers/Absorbers.html. Accessed 9/22/16.
  3. Nevers, N., Fluid Mechanics for Chemical Engineers, 3rd Ed., McGraw-Hill, 2004, Ch. 11. A derivation can be found in: M.M. Denn, "Process Fluid Mechanics", Prentice-Hall, 1980, Ch. 4.
  4. Fogler, H.S., "Elements of Chemical Reaction Engineering", Prentice-Hall, 2006, Ch. 13.1-13.3 and 14.3-14.4 (dispersion models); Levenspiel, O., "Chemical Reaction Engineering", 3rd Ed., John Wiley, 1999, Ch. 11 and 13 (dispersion models); Missen, R.W., Mims, C.A., and Saville, B.A., "Introduction to Chemical Reaction Engineering and Kinetics", John Wiley, 1999, Ch. 19 and 20.1.
  5. Levy, S., "Two Phase Flow in Complex Systems", John Wiley, 1999, Ch. 3.

Transcript

Packed bed reactors are one of the most common types of reactor used in the chemical industry, due to their high conversion rates. Packed bed reactors are typically tubular reactors filled with solid catalyst particles. The reaction occurs on the surface of the solid particle. Thus, small particles enable a high surface to volume ratio and therefore high conversion. Ideally, fluid flows through the reactor in a plug fashion, thus, these reactors are sometimes called plug flow reactors. However, maldistribution of flow or channeling can occur, where flow no longer keeps the even plug-like distribution. This causes the pressure drop in the reactor to decrease and affects the reaction conversion rate. In this video, we will discuss the basics of a packed bed reactor and demonstrate how to measure the pressure drop and flow distribution of one-phase and two-phase flow in the packed bed.

In single-phase packed bed systems, the fluid can be either a gas or liquid. In two-phase reactors, both liquid and gas flow over the solid particles in either co-current or counter-current beds. In both one-phase and two-phase systems, the reactor can be oriented either horizontally or vertically. This solid phase is packed in two ways. Dumped packing is randomly oriented, while structured packing consists of defined geometric networks. The more homogenous the packing, the lower the pressure drop across the bed. An ideal packed bed reactor with single-phase flow can be described by the Ergun equation, which describes the pressure drop across the bed and how it is related to particle size, bed length, void space or porosity, fluid velocity, and viscosity. However, real reactor performance and deviations from ideal must be analyzed experimentally via the tracer method. In the tracer method, a tracer dye, which is assumed to behave similarly to the reactant molecules, is injected into the column. The dye is monitored as it flows through the column, and its concentration upon exit measured as a function of time. In ideal plug flow, the tracer should exit at one instant and the distribution appears as a spike. In a typical column, however, the concentration function takes the form of a Gaussian distribution. This function is then used to calculate the residence time distribution. To quantify the deviation from plug flow, the mean residence time, or the probability that a molecule will exit the column at time T, is calculated as shown. For packed beds, residence time is related to the void volume, which is the product of total bed volume and porosity, divided by the volumetric flow rate, Q. When describing two-phase flow in a packed bed, two simple models are applied. The homogenous model assumes that the gas, liquid, and averaged, or two-phase velocities, are equal. Then the two-phase density is mass velocity, G, divided by the two-phase velocity, UTP. The average two-phase viscosity is defined as shown, where X is the weight fraction of vapor, and mu L and mu G are the viscosities of the respective liquid and gas phases. In the stratified flow model, delta P for each phase is equal to each other. Thus, the Ergun equation for each phase is equal to each other. The pressure drop and both flow rates must be known, while the porosity is computed from the equation. Then the mass balance relates the gas and liquid velocities to the two-phase velocity. Now that you are familiar with the tracer test, let’s learn how to carry out the experiment.

Before you start, familiarize yourself with the apparatus, which is operated using a graphical interface. The control system is used to regulate the valves, flows, and various other parameters. Bed number four, which is packed with glass beads and blast sand, is used for the single-phase, while bed number five, packed with glass, is used for the two-phase flow experiment. Start with opening the inlet and exit valve, as well as the water supply solenoid, to bed number four to determine the water flow. Using the flow controller, raise the water flow gradually through the bed and monitor the flow using the differential pressure. Make sure to vary the flow rate to cover the whole range of the DP transmitter. Next, turn on the UV/vis spectrometer and ensure communication with the control console. Using standards of the fluorescent dye, calibrate the spectrometer.

For the test, choose a single average flow rate and a 50 PPM fluorescent dye in deionized water as the tracer. First, insert the spectrometer probe into the probe sample point. Then, using the control system, change the injection valve’s status from running to charging. Inject the tracer into the sample valve using the syringe and change the valve status back to running. Monitor the spectrometer absorbance as the tracer passes the bed. To clean the injection chamber for the next experiment, change the status to charging and inject 100 milliliters of water with a clean syringe into the valve. When the absorbance returns to baseline, change the valve to running and purge it with water for 10 to 15 minutes at high flow before the next tracer injection.

Ensure that the water valves to the beds are closed. Check that the inlet and exit valves to bed number five and the drain valve are open. Furthermore, make sure that the manual valve for the air to the beds is closed. Slowly open the air regulator to establish an air flow, Then, open the manual valve for the air to the beds. Next, using the water flow controller, set the flow to 700 milliliters per minute and open the manual valve. Using the valves, route the water and air flow to the gas/liquid separator. Confirm that the water is exiting to drain. To achieve a better separation of air and water, close the valve to the drain temporarily, which will lead to the buildup of a liquid head in the gas/liquid separator. Use the pressure regulator and the dry test meter on the gas exit line to adjust the air flow. Close the drain valve briefly and use the wet test meter to read the gas flow. At a single liquid flow rate, manually vary the air flow at the regulator to cover the range of the DP transmitter and collect the pressure drop data for two-phase flow experiments at bed number five.

Now, let’s examine the real flow behavior. For single-phase flow, obtain the residence time distribution. Use the residence time distribution to calculate mean residence time, average porosity, and tracer mass. Compare the calculated tracer mass with the actual value. Next, use the Ergun equation to predict delta P for the water flow experiments. Compare the calculated pressure drops using the calculated porosities to the measured value. For example, in this figure, the minimum porosity for closed pack spheres is 0.36. For bed three and four, the calculated porosity values determined from the residence time distributions are low, leading to the predicted delta Ps being higher than the measured values. This could indicate channeling along the walls of the bed. For the two-phase flows, determine the predicted pressure drop using the homogenous and stratified flow theories and compare it to the measured value. As seen from this table, the pressure drop’s calculated using homogenous flow theory, proved to be better than those using stratified flow theory. The high-measured pressure drops suggest severe channeling in the horizontal bed, meaning the liquid was confined to a small portion of the cross-sectional area.

Packed bed reactors are widely used in many areas of industry and research. For example, packed bed reactors are used to convert ground lignocellulosic biomass to hydrocarbon fuel. The first step involves the pyrolysis of biomass to produce bio-oil using a fluidized bed reactor. Like a packed bed reactor, a fluidized bed reactor utilizes solid catalyst particles to facilitate a reaction, but they are suspended in the fluid, rather than packed in a bed. The second step in the process uses a packed bed reactor to convert the bio-oils to fuel. Here, the catalyst particles are ruthenium supported on carbon in the first stage of the reactor, and cobalt molybdenum on alumina in the second stage. The final result is a fuel range hydrocarbon mixture. Packed bed reactors can also be used for enzymatic conversion, such as the digestion of a protein prior to analysis by mass spectrometry. In this example, the reaction takes place on C18 silica particles, packed into a microfluidic reactor. Here, the protein being digested is bound to the particle, while the enzyme flows through the reactor in the fluid. The use of a packed bed reactor for protein digestions, like the example shown here, can improve yield and greatly reduce digestion time and costs.

You’ve just watched Jove’s introduction to single- and two-phase flow in packed beds. You should now understand the basics of a packed bed reactor and how to analyze flow using a tracer test. Thanks for watching!

Tags

Cite This
JoVE Science Education Database. JoVE Science Education. Single and Two-phase Flow in a Packed Bed Reactor. JoVE, Cambridge, MA, (2023).