Source: Ewa Bukowska-Faniband1, Tilde Andersson1, Rolf Lood1
1 Département des sciences cliniques Lund, Division of Infection Medicine, Biomedical Center, Lund University, 221 00 Lund, Suède
La planète Terre est un habitat pour des millions d’espèces bactériennes, dont chacune a des caractéristiques spécifiques. L’identification des espèces bactériennes est largement utilisée dans l’écologie microbienne pour déterminer la biodiversité des échantillons environnementaux et la microbiologie médicale pour diagnostiquer les patients infectés. Les bactéries peuvent être classées à l’aide de méthodes de microbiologie conventionnelles, telles que la microscopie, la croissance sur des médias spécifiques, les tests biochimiques et sérologiques, et les tests de sensibilité aux antibiotiques. Au cours des dernières décennies, les méthodes de microbiologie moléculaire ont révolutionné l’identification bactérienne. Une méthode populaire est le séquençage du gène 16S ribosomal RNA (rRNA). Cette méthode est non seulement plus rapide et plus précise que les méthodes conventionnelles, mais permet également d’identifier les souches qui sont difficiles à cultiver en laboratoire. En outre, la différenciation des souches au niveau moléculaire permet la discrimination entre les bactéries phénotypiquement identiques (1-4).
16S rRNA se joint à un complexe de 19 protéines pour former une sous-unité 30S du ribosome bactérien (5). Il est encodé par le gène 16S rRNA, qui est présent et fortement conservé dans toutes les bactéries en raison de sa fonction essentielle dans l’assemblage de ribosome; cependant, il contient également des régions variables qui peuvent servir d’empreintes digitales pour des espèces particulières. Ces caractéristiques ont fait du gène 16S rRNA un fragment génétique idéal à utiliser dans l’identification, la comparaison et la classification phylogénétique des bactéries (6).
Le séquençage du gène rRNA 16S est basé sur la réaction en chaîne de polymérase (PCR) (7-8) suivie du séquençage de l’ADN (9). PCR est une méthode de biologie moléculaire utilisée pour amplifier des fragments spécifiques d’ADN à travers une série de cycles qui comprennent:
i) Dénaturation d’un modèle d’ADN à double brin
ii) Annealing des amorces (oligonucléotides courts) qui sont complémentaires au modèle
iii) Extension des amorces par l’enzyme de polymérase d’ADN, qui synthétise un nouveau brin d’ADN
Un aperçu schématique de la méthode est montré dans la figure 1.
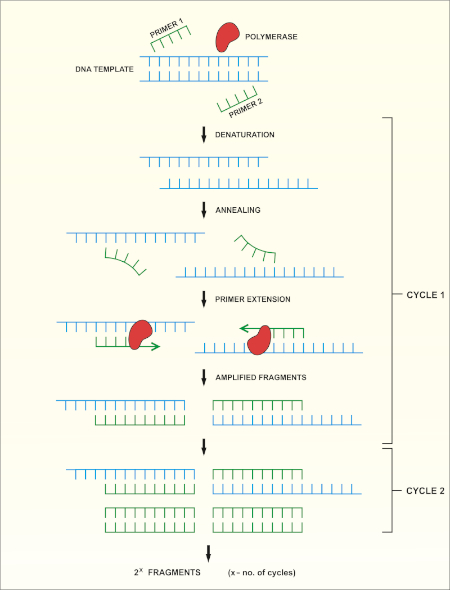
Figure 1 : Aperçu schématique de la réaction de PCR. Veuillez cliquer ici pour voir une version plus grande de ce chiffre.
Il y a plusieurs facteurs qui sont importants pour une réaction réussie de PCR, dont l’un est la qualité du modèle d’ADN. L’isolement de l’ADN chromosomique des bactéries peut être effectué à l’aide de protocoles standard ou de kits commerciaux. Une attention particulière doit être prise pour obtenir de l’ADN exempt de contaminants qui peuvent inhiber la réaction de PCR.
Les régions conservées du gène 16S rRNA permettent la conception de paires d’apprêt universels (un avant et un revers) qui peuvent se lier à la région cible et l’amplifier dans n’importe quelle espèce bactérienne. La région cible peut varier en taille. Alors que certaines paires d’amorces peuvent amplifier la plupart du gène 16S rRNA, d’autres n’amplifient que des parties de celui-ci. Des exemples d’amorces couramment utilisées sont présentés dans le tableau 1 et leurs sites de liaison sont représentés à la figure 2.
Nom d’amorce | Séquence (5′-3′) | Avant/revers | référence |
8F b) | AGAGTTTGATCCTGGCTCAG | en avant | -1 |
27F (en) | AGAGTTTGATCMTGGCTCAG | en avant | -10 |
515F (en) | GTGCCAGCMGCCGCGGTAA | en avant | -11 |
911R | GCCCCCGTCAATTCMTTTGA | revenir sur | -12 |
en 1391R | GACGCGGTGTGTRCA | revenir sur | -11 |
1492R | GGTTACCTTGTTACGACTT GGTTACCTTGTTACGACTT GGTTACCTTGTTACGACTT GGTTA | revenir sur | -11 |
Tableau 1 : Exemples d’oligonucléotides standard utilisés dans l’amplification des gènes 16S rRNA a).
a) Les longueurs prévues du produit PCR générées à l’aide des différentes combinaisons d’amorces peuvent être estimées en calculant la distance entre les sites de liaison pour l’avant et l’amorce inverse (voir la figure 2), par exemple la taille du PCR produit utilisant la paire d’apprêt 8F-1492R est de 1500 bp, et pour la paire d’apprêt 27F-911R 900 bp.
b) également connu sous le nom de fD1
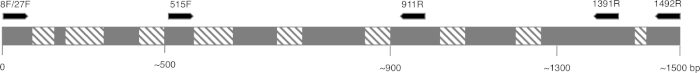
Figure 2 : Figure représentative de la séquence de rRNA 16S et des sites de liaison d’amorce. Les régions conservées sont colorées en gris et les régions variables sont remplies de lignes diagonales. Pour permettre la plus haute résolution, l’amorce 8F et 1492R (nom basé sur l’emplacement sur la séquence d’ARNr) sont utilisées pour amplifier la séquence entière, permettant le séquençage de plusieurs régions variables du gène. Veuillez cliquer ici pour voir une version plus grande de ce chiffre.
Les conditions de cyclisme pour le PCR (c’est-à-dire la température et le temps requis pour que l’ADN soit dénaturé, annealed avec des amorces et synthétisé) dépendent du type de polymérase qui est utilisé et des propriétés des amorces. Il est recommandé de suivre les directives du fabricant pour une polymérase particulière.
Une fois le programme PCR terminé, les produits sont analysés par électrophoresis de gel d’agarose. Un PCR réussi donne une seule bande de taille prévue. Le produit doit être purifié avant le séquençage pour enlever les amorces résiduelles, les désoxyribonucleotides, la polymérase et le tampon qui étaient présents dans la réaction PCR. Les fragments d’ADN purifiés sont habituellement envoyés pour le séquençage aux services commerciaux de séquençage ; cependant, certaines institutions effectuent le séquençage de l’ADN dans leurs propres installations de base.
La séquence d’ADN est automatiquement générée à partir d’un chromatogramme d’ADN par un ordinateur et doit être soigneusement vérifiée pour la qualité, car l’édition manuelle est parfois nécessaire. Après cette étape, la séquence génétique est comparée aux séquences déposées dans la base de données rRNA 16S. Les régions de similitude sont identifiées, et les séquences les plus similaires sont livrées.
Identifying bacterial species is important for different researchers, as well as for those in healthcare. 16S rRNA sequencing was initially used by researchers to determine phylogenetic relationships between bacteria. In time, it has been implemented in metagenomic studies to determine biodiversity of environmental samples and in clinical laboratories as a method to identify potential pathogens. It enables a quick and accurate identification of bacteria present in clinical samples, facilitating earlier diagnosis and faster treatment of patients.
Earth is home to millions of bacterial species, each with unique characteristics. Identifying these species is critical in evaluating environmental samples. Doctors also need to distinguish different bacterial species to diagnose infected patients.
To identify bacteria, a variety of techniques can be employed, including microscopic observation of morphology or growth on a specific media to observe colony morphology. Genetic analysis, another technique for identifying bacteria has grown in popularity in recent years, due in part to 16S ribosomal RNA gene sequencing.
The bacterial ribosome is a protein RNA complex consisting of two subunits. The 30S subunit, the smaller of these two subunits, contains 16S rRNA, which is encoded by the 16S rRNA gene contained within the genomic DNA. Specific regions of 16S rRNA are highly conserved, due to their essential function in ribosome assembly. While other regions, less critical to function, may vary among bacterial species. The variable regions in 16S rRNA, can serve as unique molecular fingerprints for bacterial species, allowing us to distinguish phenotypically identical strains.
After obtaining a quality sample of gDNA, PCR of the 16S rRNA encoding gene can begin. PCR is a commonly used molecular biology method, consisting of cycles of denaturation of the double-stranded DNA template, annealing of universal primer pairs, which amplify highly conserved regions of the gene, and the extension of primers by DNA polymerase. While some primers amplify most of the 16S rRNA encoding gene, others only amplify fragments of it. After PCR, the products can be analyzed via agarose gel electrophoresis. If amplification was successful, the gel should contain a single band of an expected size, depending upon the primer pair used, up to 1500bp, the approximate length of the 16S rRNA gene.
After purification and sequencing, the obtained sequences can then be entered into the BLAST database, where they can be compared with reference 16S rRNA sequences. As this database returns matches based on the highest similarity, this allows confirmation of the identity of the bacteria of interest. In this video, you will observe 16S rRNA gene sequencing, including PCR, DNA sequence analysis and editing, sequence assembly and database searching.
When handling microorganisms, it is essential to follow good microbiological practice, including using aseptic technique and wearing appropriate personal protective equipment. After performing an appropriate risk assessment for the microorganism or environmental sample of interest, obtain a test culture. In this example, a pure culture of Bacillus subtilis is used.
To begin, grow your microorganism on a suitable medium in the appropriate conditions. In this example, Bacillus subtilis 168 is grown in LB broth overnight in a shaking incubator set to 200 rpm at 37 degrees Celsius. Next, use a commercially available kit to isolate genomic DNA or gDNA from 1.5 milliliters of the B. subtilis overnight culture.
To check the quality of the isolated DNA, first mix five microliters of the isolated gDNA with one microliter of DNA gel loading dye. Then, load the sample onto a 0.8% agarose gel, containing DNA staining reagent, such as SYBR safe or EtBr. After this, load a one kilobase molecular mass standard onto the gel, and run the electrophoresis until the front dye is approximately 0.5 centimeters from the bottom of the gel. Once the gel electrophoresis is complete, visualize the gel on a blue light transilluminator. The gDNA should appear as a thick band, above 10 kilobase in size and have minimal smearing.
After this, to create serial dilutions of the gDNA, label three microcentrifuge tubes as 10X, 100X, and 1000X. Then, use a pipette to dispense 90 microliters of sterile distilled water into each of the tubes. Next, add 10 microliters of the gDNA solution to the 10X tube. Pipette the whole volume up and down to ensure the solution is mixed thoroughly. Then, remove 10 microliters of the solution from the 10X tube and transfer this to the 100X tube. Mix the solution as previously described. Finally, transfer 10 microliters of the solution in the 100X tube, to the 1000X tube.
To begin the PCR protocol, thaw the necessary reagents on ice. Then, prepare the PCR master mix. Since the DNA polymerase is active at room temperature, the reaction set up must occur on ice. Aliquot 49 microliters of the master mix into each of the PCR tubes. Then, add one microliter of template to each of the experimental tubes and one microliter of sterile water to the negative control tube, pipetting up and down to mix. After this, set the PCR machine according to the program described in the table. Place the tubes into the thermocycler and start the program.
Once the program is complete, examine the quality of your product via agarose gel electrophoresis, as previously demonstrated. A successful reaction using the described protocol should yield a single band of approximately 1.5 kilobase. In this example, the sample containing 100X diluted gDNA yielded the highest quality product. Next, purify the best PCR product, in this case, the 100X gDNA, with a commercially available kit. Now the PCR product can be sent for sequencing.
In this example, the PCR product is sequenced using forward and reverse primers. Thus, two data sets, each containing a DNA sequence and a DNA chromatogram, are generated: one for the forward primer and the other for the reverse primer. First, examine the chromatograms generated from each primer. An ideal chromatogram should have evenly spaced peaks with little to no background signals.
If the chromatograms display double peaks, multiple DNA templates may have been present in the PCR products and the sequence should be discarded. If the chromatograms contained peaks of different colors in the same location, the sequencing software likely miscalled nucleotides. This error can be manually identified and corrected in the text file. The presence of broad peaks in the chromatogram indicates a loss of resolution, which causes miscounting of the nucleotides in the associated regions. This error is difficult to correct and mismatches in any of the subsequent steps should be treated as unreliable. Poor chromatogram reading quality, indicated by the presence of multiple peaks, usually occurs at the five prime and three prime ends of the sequence. Some sequencing programs remove these low quality sections automatically. If your sequence was not truncated automatically, identify the low quality fragments and remove their respective bases from the text file.
Use a DNA assembly program to assemble the two primer sequences into one continuous sequence. Remember, sequences obtained using forward and reverse primers should partially overlap. In the DNA assembly program, insert the two sequences in FASTA format into the appropriate box. Then, click the submit button and wait for the program to return the results.
To view the assembled sequence, click on Contigs in the results tab. Then, to view the details of the alignment, select assembly details. Navigate to the website for the basic local alignment search tool, or BLAST, and select the nucleotide BLAST tool to compare your sequence to the database. Enter your sequence into the query sequence text box and select the appropriate database in the scroll down menu. Finally, click the BLAST button on the bottom of the page, and wait for the tool to return the most similar sequences from the database.
In this example, the top hit is B. subtilis strain 168, showing 100% identity with the sequence in the BLAST database. If the top hit does not show 100% identity to your expected species or strain, click on the sequence which most closely matches your query to see the details of the alignment. Aligned nucleotides will be joined by short vertical lines and mismatched nucleotides will have gaps between them. Focusing on the identified mismatched regions, revise the sequence and repeat the BLAST search if desired.