This protocol presents an efficient and reliable method to transfect human THP-1 macrophages with siRNA or plasmid DNA by electroporation with high transfection efficiency while maintaining high cell vitality and full macrophage capacity for differentiation and polarization.
Method Article
Highly Efficient Transfection of Human THP-1 Macrophages by Nucleofection
In This Article
Summary
Abstract
Macrophages, as key players of the innate immune response, are at the focus of research dealing with tissue homeostasis or various pathologies. Transfection with siRNA and plasmid DNA is an efficient tool for studying their function, but transfection of macrophages is not a trivial matter. Although many different approaches for transfection of eukaryotic cells are available, only few allow reliable and efficient transfection of macrophages, but reduced cell vitality and severely altered cell behavior like diminished capability for differentiation or polarization are frequently observed. Therefore a transfection protocol is required that is capable of transferring siRNA and plasmid DNA into macrophages without causing serious side-effects thus allowing the investigation of the effect of the siRNA or plasmid in the context of normal cell behavior. The protocol presented here provides a method for reliably and efficiently transfecting human THP-1 macrophages and monocytes with high cell vitality, high transfection efficiency, and minimal effects on cell behavior. This approach is based on Nucleofection and the protocol has been optimized to maintain maximum capability for cell activation after transfection. The protocol is adequate for adherent cells after detachment as well as cells in suspension, and can be used for small to medium sample numbers. Thus, the method presented is useful for investigating gene regulatory effects during macrophage differentiation and polarization. Apart from presenting results characterizing macrophages transfected according to this protocol in comparison to an alternative chemical method, the impact of cell culture medium selection after transfection on cell behavior is also discussed. The presented data indicate the importance of validating the selection for different experimental settings.
Introduction
Among the cellular components of the human immune system, macrophages are of great importance for the innate immune response. Their tasks are diverse; they are involved in phagocytosis of pathogens and necrotic material, they play an important role in tissue homeostasis and produce and secrete a large number of cytokines to regulate and orchestrate the immune response1. Therefore macrophages are integrally involved in many physiological processes and pathophysiological conditions. Due to the diversity of their tasks, macrophages are a very heterogeneous and multifaceted cell type. This is achieved by different polarizations; depending on external stimuli macrophages can develop into different phenotypes2. Macrophages’ variability and impact on the immune response make them a very interesting research subject. In order to elucidate their complex metabolic and regulatory functions, appropriate macrophage in vitro models are required which correctly reflect macrophage heterogeneity and variability.
Transfection of cells with plasmid DNA vectors or small interfering RNAs (siRNAs) in order to alter cellular gene expression has become a widely used and powerful tool in cell biology for investigating both gene regulation and gene function. Currently there is a large selection of different tools available for transfection of eukaryotic cells. These tools include the application of viral vectors, mechanical methods (such as gene guns), chemical approaches (which rely on polymers or lipids that can form complexes with nucleic acids), and electroporation of cells3. All of these approaches have their advantages and disadvantages and choosing the best suited from this wide array for a specific cell type and application can be a difficult and time consuming process.
Macrophages are notoriously difficult to transfect as almost all well-established transfection approaches drastically reduce macrophages’ viability or interfere with their behavior, i.e. differentiation and in particular polarization. Therefore, we present here an efficient, non-viral protocol to transfect human THP-1 macrophages using the electroporation-based Nucleofector technology, which represents an optimized electroporation approach requiring reduced amounts of DNA. Nucleofection is well-suited for sensitive cells such as monocytes and macrophages. This protocol is an adaptation of previously published versions4,5.
In brief, phorbol 12-myristate 13-acetate (PMA) is used to differentiate human THP-1 monocytes for 48 hr into premature macrophages prior to transfection with siRNA or plasmid DNA. For transfection the predifferentiated macrophages are detached enzymatically by Accutase I treatment. The transfection is performed using a Nucleofector 2b device for electroporation of the cells. After transfection, differentiation is continued for another 24 to 48 hr as required. Finally, mature transfected macrophages are incubated with different kinds of compounds for functional studies.
This approach allows for the transfection of cell lines such as human THP-1 monocytes and macrophages and has been successfully applied in the past6-10. In contrast to most chemical transfection approaches, our modified Nucleofection procedure using premature macrophages yields high transfection efficiencies in combination with unimpaired cell viability, without the need to use viral vectors or add further carrier compounds with unknown side effects. In addition, the macrophages retain their full potential for differentiation as well as polarization thus allowing unimpeded functional investigations following transfection11.
Furthermore, the cell culture medium applied after Nucleofection strongly influences functional studies following transfection; in particular, the macrophages’ capacity for polarization can be affected depending on the applied culture medium. Here four different types of cell culture media (IMDM, X-VIVO 20, LGM3 and Mouse T Cell Nucleofector medium) were tested under deactivating conditions using interleukin (IL) 10. Using THP-1 macrophages, we observed that cell responsiveness to IL10 is strongest when the Mouse T Cell Nucleofector medium is used in comparison to the other culture media mentioned above. These results demonstrate that appropriate optimization of all cell culture conditions is essential for successful transfection und subsequent functional studies as these may significantly improve experimental results.
As macrophages are involved in various human diseases, much research is focused on elucidating macrophage behavior as well as regulative mechanisms influencing macrophages or in turn controlled by macrophages. Therefore, this protocol is of relevance in many different research areas.
Protocol
1. Predifferentiation of THP-1 Macrophages
- Cultivate THP-1 cells in RPMI-1640 medium supplemented with 10% (v/v) fetal calf serum (FCS) and 1% (v/v) penicillin/streptomycin/L-glutamin (PSG) in a CO2 (5%) incubator at 37 °C.
- Before transfection, split cells and transfer them to fresh RPMI medium as before. Cultivate cells for 24 hr.
- Seed 1.0-1.5 x 10⁷ cells into a 75 cm² tissue culture flask or 2.5 x 10⁷ cells into a 150-cm² tissue culture flask in RPMI-1640 medium and add 10% (v/v) FCS, 1% (v/v) PSG, 1% (v/v) sodium pyruvate, 1% (v/v) nonessential amino acids, 10 ng/ml PMA, and 50 µM β-mercaptoethanol for 48 hr.
2. Preparation of Nucleofection
- Place Accutase I and all media into water bath at 37 °C.
- Aspirate culture medium from flask and replace with 6 ml (75 cm² flask) or 12 ml (150 cm² flask) of Accutase I and incubate for 30 min at 37 °C for full detachment of cells. Observe cell morphology after Accutase I treatment to ensure that cells have a round appearance. If some cells still appear to be attached, carefully rinse the flask with a micropipette or gently tap it to complete detachment. Do not use cell scrapers, as this will have a negative effect on cell vitality. Transfer cell suspension to a 15 ml tube.
- During Accutase I treatment, prepare the following media:
- Prepare transfection medium: supplement cell culture medium with 1% (v/v) PSG, 1% (v/v) of nonessential amino acids, 1% (v/v) sodium pyruvate, and 5% (v/v) human serum (for siRNA) or 20% (v/v) human serum (for plasmid DNA); prepare a final volume of either 3 ml/sample for one 6-well plate or 4 ml/sample for two 12-well plates.
- Prepare cultivation medium: supplement culture medium with 1% (v/v) PSG, 1% (v/v) of nonessential amino acids, 1% (v/v) sodium pyruvate, and 5% (v/v) human serum (for siRNA) or 20% (v/v) human serum (for plasmid), 2.5 ng/ml PMA, and 50 µM β-mercaptoethanol; prepare a final volume of either 3 ml/sample for one 6-well plate or 4 ml/sample for two 12-well plates.
- Centrifuge cell suspension for 5 min at 300 x g at room temperature.
- Aspirate Accutase I and resuspend cells in 1 ml of RPMI medium pre-warmed to 37 °C; count cells to determine cell number.
NOTE: When fast automatic cell counting procedures are used, steps 2.4 and 2.5 may be omitted and cells can be counted immediately after detachment provided that prolonged exposure to Accutase I is avoided. - For each transfection sample prepare aliquots in centrifuge tubes containing 2.0-2.5 x 10⁶ cells.
3. Nucleofection of THP-1 Macrophages
- Centrifuge all aliquots for 10 min at 250 x g at room temperature.
- Dilute plasmid DNA or siRNA in nuclease-free water or an appropriate buffer. Keep the required volume of plasmid DNA or siRNA as small as possible.
- Prepare one Nucleofector cuvette with either 1 µg of siRNA or 0.5 µg of plasmid DNA for each transfection.
- Perform one transfection at a time. Aspirate supernatant from cell aliquot.
- Resuspend pelleted cells in Nucleofector solution to yield a total volume of 100 µl of DNA/siRNA and Nucleofector solution. Keep the time of exposure to pure Nucleofector solution to a minimum and ensure that exposure time does not exceed 15 min.
- Mix resuspended cells and DNA/siRNA in Nucleofector cuvette by gentle tapping.
- Transfect cells by performing program Y-001 in Nucleofector 2b device.
- Transfer transfected cells into a reaction vial using disposable plastic Pasteur pipettes.
- Immediately add 500 µl of prepared transfection medium.
- Repeat steps 3.4 to 3.9 for each transfection sample.
4. Post-Nucleofection Care
- Prepare either 6-well or 12-well plates for transfected cells. Pipette 2.5 ml of transfection medium into each well of a 6-well plate (1 well/transfection) or 1.75 ml of transfection medium into each well of a 12-well plate (2 wells/transfection).
- Mix cell suspensions thoroughly with a micropipette.
- Transfer the transfected cells into the prepared wells (either one well in a 6 well plate or two in a 12 well plate).
- Incubate plates for 4 hr in a humidified incubator (5% CO2, 37 °C).
- Check reattachment of cells microscopically.
NOTE: A majority of cells should be adherent again. Occasionally, extending the incubation period by 1 hr increases the number of adherent cells in case of insufficient reattachment. - Carefully aspirate transfection medium with a micropipette and replace with equal amount of cultivation medium. Aspirate only one well at a time.
- Incubate cells for required time period for maximal effect of plasmid or siRNA (24-72 hr). If incubation periods exceed 48 hr, replace medium after 48 hr.
- For additional treatment with effectors (e.g., cytokines, agonists, antagonists and inhibitors) use serum free medium without PMA and β-mercaptoethanol. Time the end of the incubation period of the effector with the time of maximal effect of the plasmid or siRNA and plan the change of medium and addition of the effector accordingly. Do not maintain cells under serum free conditions for longer than 24 hr.
Results
Using this protocol for transfection of THP-1 macrophages with siRNA we usually achieve transfection rates of above 90% without significant reduction of cell vitality. Figure 1 shows representative data characterizing the state of the cells 24 hr after transfection with fluorescently labeled siRNA versus an untransfected control, which were not treated with Nucleofection reagents and pulse or siRNA but received all changes of culture media as transfected samples. In Figure 1A the cellular morphology is shown according to flow cytometric measurement. Microscopic images are shown in Figure 1B. Figures 1C and 1D represent the low rates for apoptosis (control: 1.5%; Nucleofection: 5.4%) and necrosis (control: 2.0%; Nucleofection: 3.2%) indicating unaffected cell vitality. Necrosis and apoptosis are slightly higher for the transfected sample as transfected THP-1 macrophages are more difficult to detach than untransfected cells, thus the probability of cell damage during detachment increases. Finally transfection efficiency is presented in Figure 1E. As the entire transfected population is shifted against the control, this indicates that all cells are transfected which is confirmed by fluorescence microscopic images (Figure 2B). Both flow cytometric data as well as fluorescence microscopic images indicate that all cells are consistently transfected with homogenous distribution of siRNA among cells as well as within cells. This is in contrast to many chemical transfection reagents, for comparison Figures 2A and 2B show the respective flow cytometric data and fluorescence microscopic images for a chemical transfection agent using a lipid based approach. These figures show that two distinct populations of transfected cells can be detected. The first population is similar to the transfected cells following Nucleofection. They are characterized by low overall fluorescence and homogenous distribution of siRNA within the cells. The second population is marked by a more intense fluorescence which originates from very bright intracellular agglomerates of siRNA. The cellular morphology remains unaffected for both transfection approaches as shown by differential interference contrast in Figure 2C. Transfections using plasmid DNA yield effectively similar results, for examples please refer to Robenek et al. (2009)9 or Xie et al. (2006)7.
The choice of the cell culture medium after transfection is of great relevance; therefore different cell culture media were tested in comparison. The selected media are all suitable for cultivation of THP-1 cells and were chosen according to recommendations of Lonza as applicable media for post-Nucleofection cultivation. Figure 3 represents the siRNA mediated knockdown efficiency using a siRNA directed against IL10RB (interleukin 10 receptor β chain) mRNA. For all tested media the expression of IL10RB was significantly reduced to about 10 to 20% of the control level (Figure 3). However the transfected cells differ depending on the culture medium in their potential for polarization. THP-1 macrophages transfected with either unspecific control siRNA or IL10RB-specific siRNA were cultivated in different media after transfection and treated with IL10. Subsequently the expression levels of the IL10-induced gene SOCS3 (suppressor of cytokine signaling 3) on mRNA level were measured by RT-qPCR. Differences between culture media occur in regard to the extent of the induction of SOCS3 mRNA expression (Figure 4), the inductions for each of the tested media Mouse T Cell Nucleofector Medium, LGM3, X-VIVO 20 and IMDM were 19.5 [17.7-21.5], 11.5 [8.5-15.7], 8.0 [4.6-14.2] and 7.2 [5.6-9.5] fold, respectively. Therefore application of the Mouse T Cell Nucleofector medium is vital. In addition, differences in the effect of the knockdown of IL10RB on SOCS3 expression after IL10 treatment were observable, expression levels of SOCS3 mRNA were reduced to 9.5 [8.8-10.3] fold in Mouse T Cell Nucleofector medium, 2.1 [1.1-4.1] fold in LGM3, 4.8 [3.2-7.2] fold in X-VIVO 20 and 3.3 [2.7-3.9] fold in IMDM. These values correspond to reductions of SOCS3 expression in the different media to 49%, 18%, 60%, and 45%, respectively. Reduction of IL-10-induced SOCS3 expression after transfection of IL10RB siRNA confirms the successful downregulation of IL10RB by the transfection.
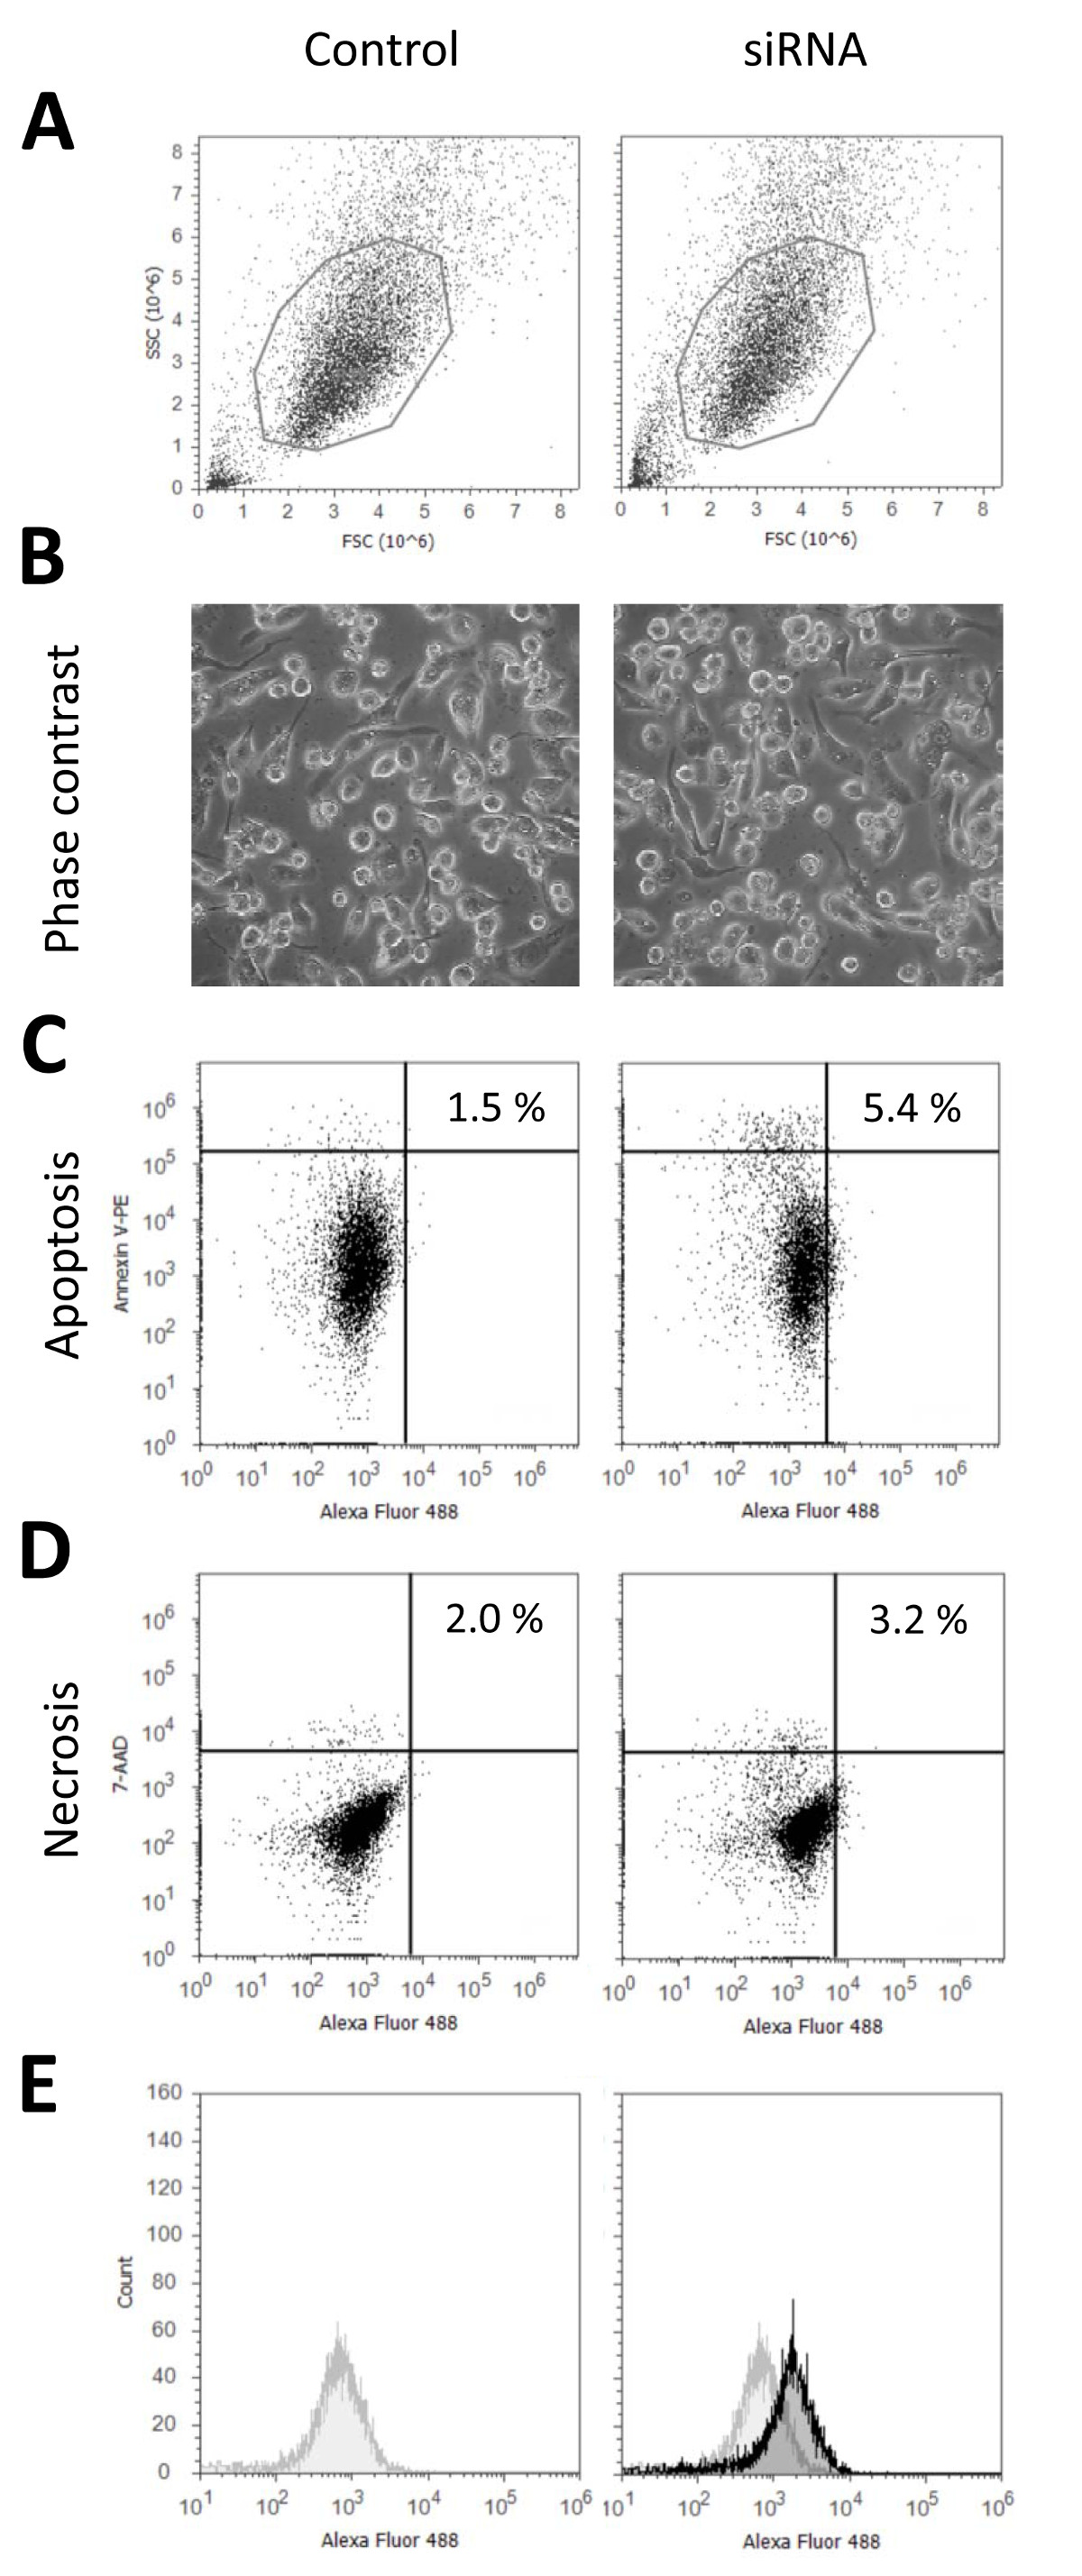
Figure 1. Characterization of transfected THP-1 macrophages. The characteristic status of the cells is unaffected as revealed by light microscopic and flow cytometric analyses of untransfected control cells versus THP-1 macrophages transfected according to the presented protocol. THP-1 macrophages were differentiated with 10 ng/ml PMA for 48 hr and transfected with fluorescently labeled (Alexa 488) unspecific control siRNA. 24 hr after transfection either images of live cells were taken (B), or the cells were detached by Accutase I treatment and analyzed by flow cytometry (A). Apoptosis and necrosis staining was performed using Annexin V-phycoerythrin (PE) (C) and 7-aminoactinomycin (7-AAD) (D). Transfection efficiency (E) was determined by flow cytometry using the fluorescence label attached to the siRNA. The fluorescence signal of the transfected cells (black) is shown against the control signal (grey). Please click here to view a larger version of this figure.

Figure 2. Comparison of intracellular distribution of siRNA after Nucleofection versus lipofection. THP-1 cells were differentiated for 48 hr according to this protocol and then transfected either by Nucleofection or by lipofection. The presented lipofection results were obtained using the Xtremegene siRNA kit according to the manufacturer’s recommendations with a charge ratio of reagent to siRNA of 4:1. 24 hr after transfection cells were either detached with Accutase I for flow cytometric analysis or evaluated microscopically with live cells. (A) Transfection efficiency and distribution of siRNA per cell within the population was determined by flow cytometry using the fluorescence label attached to the siRNA, controls transfected without siRNA are shown in grey, samples transfected with siRNA are shown in black. (B) Fluorescence microscopy images showing intracellular distribution of fluorescently labeled siRNA (Alexa Fluor 488); the scale bar represents 40 µm. (C) Differential interference contrast image corresponding to the fluorescence image; the scale bar represents 40 µm. Please click here to view a larger version of this figure.
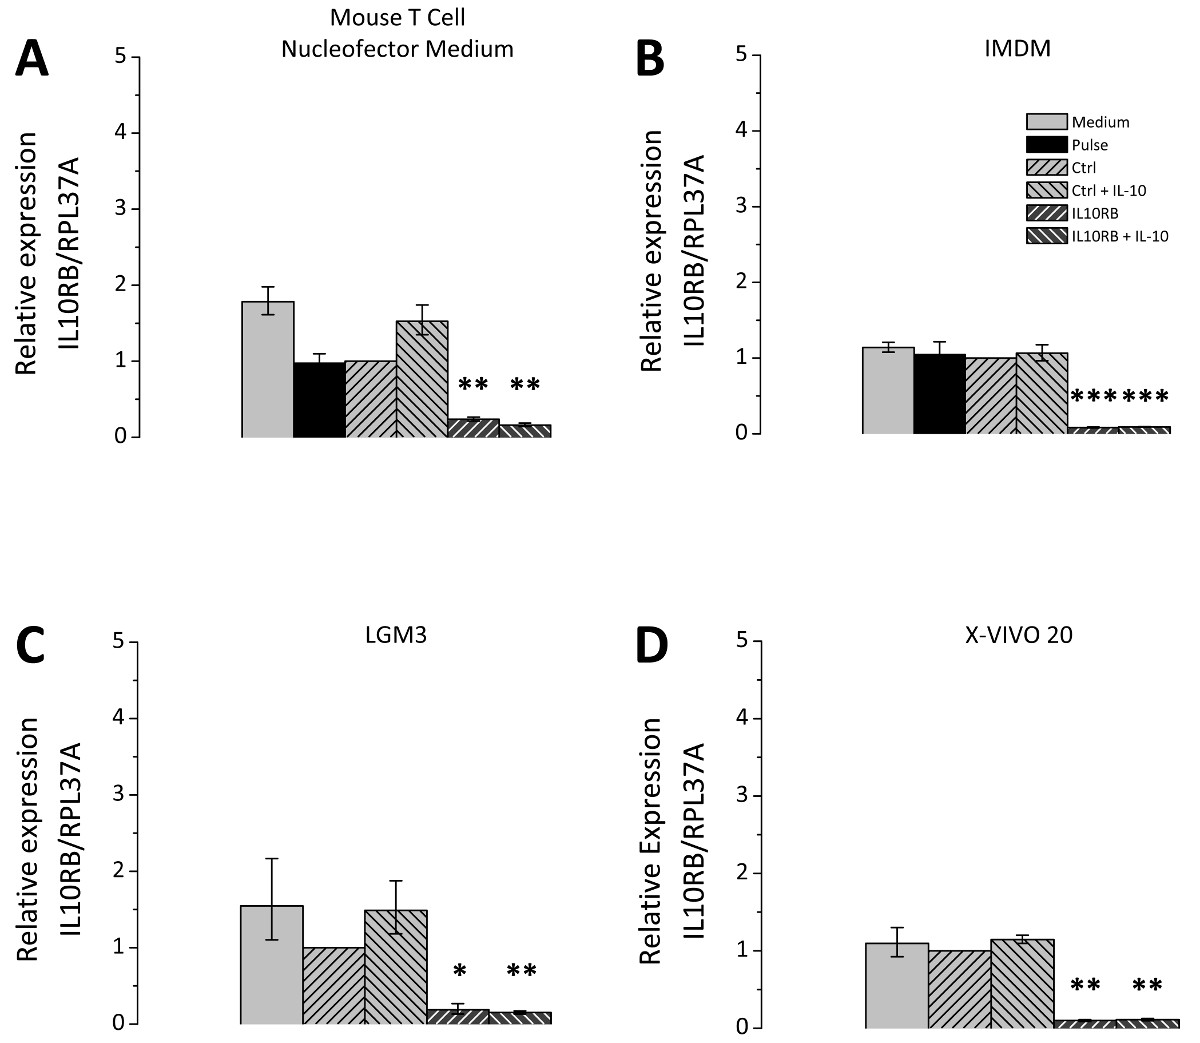
Figure 3. siRNA-mediated knockdown of IL10RB in transfected THP-1 macrophages. THP-1 macrophages were transfected according to the outlined protocol. After transfection the cells were cultivated in four different culture media, namely Mouse T Cell Nucleofector medium (A), IMDM (B), LGM3 (C), and X-VIVO 20 (D), supplemented as described in the Protocol section. Cells were either transfected with unspecific control siRNA (Ctrl) or IL10RB-specific siRNA (IL10RB). As additional controls the following samples were included: Pulse control, i.e. cells which underwent transfection in the absence of siRNA (Pulse), and a medium control, i.e. cells that received only the changes of culture media but remained otherwise untreated. 24 hr after transfection the cells were incubated in serum-free medium with or without 50 ng/ml IL10 for further 24 hr. IL10RB expression was measured by RT-qPCR; diagrams show the mean of three independent experiments, error bars represent the standard error of the mean; * p <0.05; ** p <0.01; *** p <0.001 vs. Ctrl. Please click here to view a larger version of this figure.
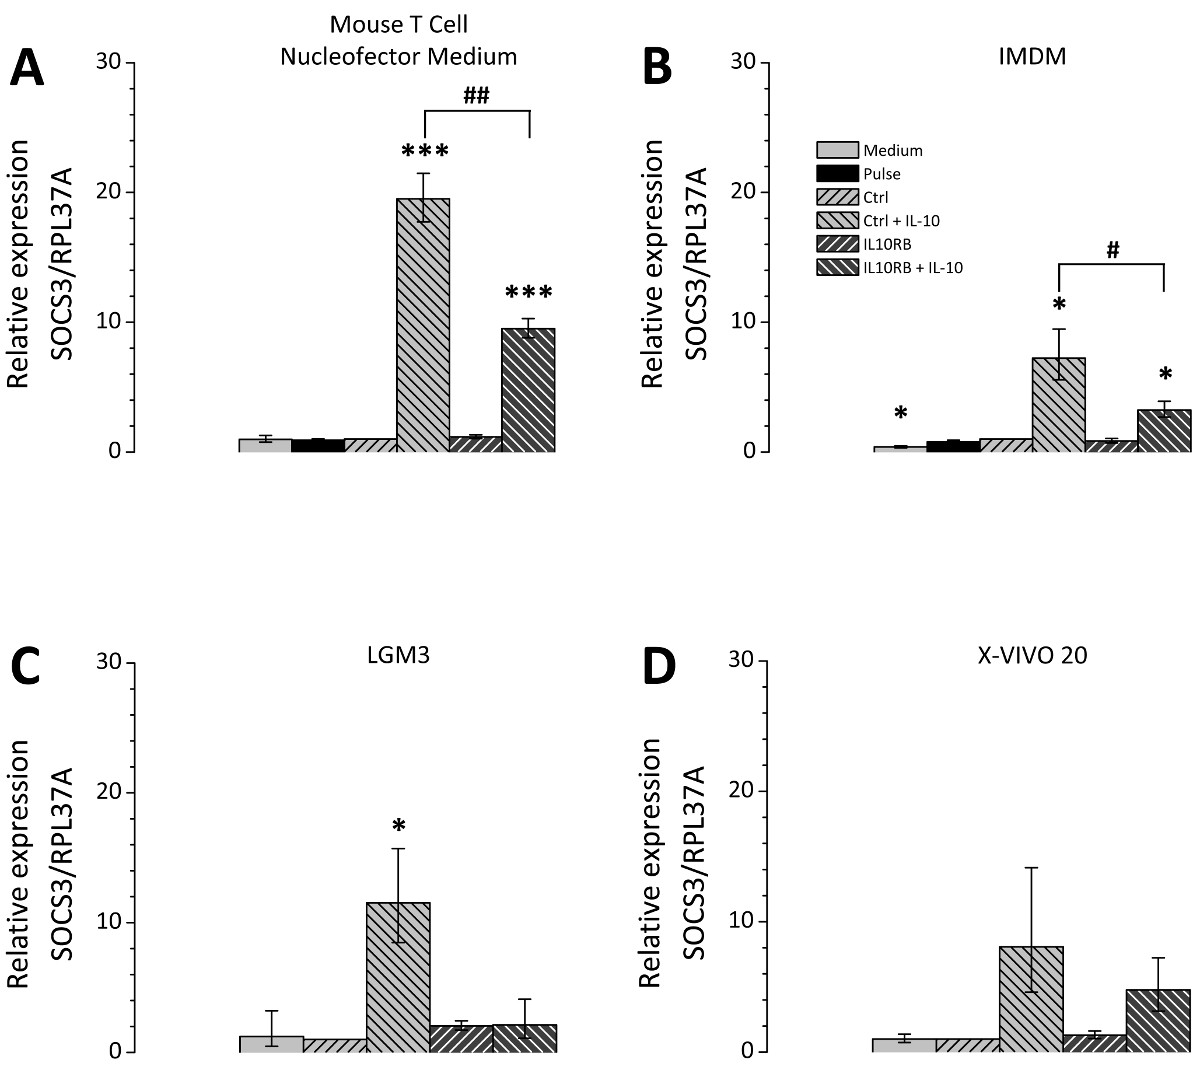
Figure 4. IL10-dependent regulation of SOCS3 after knockdown of IL10RB in transfected THP-1 macrophages. THP-1 macrophages were transfected according to the described protocol. After transfection the cells were cultivated in four different culture media Mouse T Cell Nucleofector medium (A), IMDM (B), LGM3 (C) and X-VIVO 20 (D) supplemented as described in the Protocol section. Cells were either transfected with unspecific control siRNA (Ctrl) or IL10RB-specific siRNA (IL10RB). As additional controls the following samples were included: Pulse control, i.e. cells which underwent transfection in the absence of siNRA (Pulse), and a medium control, i.e. cells that received only the changes of culture media but remained otherwise untreated. 24 hr after transfection the cells were incubated in serum free medium with or without 50 ng/ml IL10 for further 24 hr. SOCS3 expression was measured by RT-qPCR; diagrams show the mean of three independent experiments, error bars represent the standard error of the mean; *, # p <0.05; **, ## p <0.01; ***, ### p <0.001 vs. Ctrl and vs. Ctrl + IL-10, respectively. Please click here to view a larger version of this figure.
Discussion
The protocol outlined here presents a reliable and efficient way to transfect THP-1 macrophages which are usually rather difficult to transfect. Transfection can be achieved with transfection efficiencies of above 90% for siRNA without significant reduction of cell vitality. Efficiencies for plasmids may be less due to their size but transfection efficiencies of around 70% can be usually achieved. The efficiency of siRNA-mediated knockdown can reach 80 to 90% depending on the applied siRNA. A major advantage of this protocol is that it does not interfere with cell differentiation. After transfection the cells still respond normally to the differentiation agent PMA (Figure 1A to 1B and Figure 4)12. In addition cellular polarization by cytokine stimuli such as IL10 or LPS/IFNγ is unaffected12, although this also depends strongly on the medium selected for cultivation after transfection as shown in Figure 4.
There are several options within the procedure which can be modified in order to adapt the protocol to specific requirements. As shown in Figure 4 the cells react differently to the same IL10 stimulus depending on the culture medium selected after transfection. This indicates that the medium composition has strong influence on cellular behavior. As the effect imposed by the medium might differ for various experimental stimuli, it is possible that the optimal medium might change and therefore there is a need to verify the suitability of the medium for different experiments independently. However the RPMI-1640 medium, which is the default medium used for cultivation of THP-1 cells, has proven to be ill-suited for cultivation after transfection as a significant loss in cell vitality was observed. Furthermore the protocol can also be applied to THP-1 monocytes without prior PMA-induced differentiation, this obviously removes the need for cell detachment during the procedure but all remaining steps do not have to be adjusted. The THP-1 monocytes can be differentiated afterwards if required.
The most critical elements of the protocol are firstly the detachment and secondly the time required for transfection. The detachment must be performed as gently as possible, in order to maintain high cell viability. Therefore we recommend the comparatively mild enzymatic detachment by Accutase I over quite aggressive methods such as trypsinization. Further detachment methods such as treatment with Lidocain or scraping were found to be rather detrimental and should not be used. In the case that 30 min of Accutase I treatment should not be sufficient to detach all cells properly this is usually an indication of incorrectly stored or expired Accutase I solution or of too many freeze-thaw cycles. We have obtained good results by storing small aliquots of Accutase I at -20 °C to reduce the number of freeze-thaw cycles. However when there is insufficient detachment either replace Accutase I with fresh Accutase or increase incubation time up to 1 hr. In addition gentle tapping or rinsing of the flask or plate can assist detachment. Regarding the required time for transfection the exposure time of the cells to pure Nucleofector solution has got high impact on cell survival and thus should be as short as possible. The best way to achieve this is to perform each transfection at a time (steps 2.10 to 2.15) and not multiple transfections in parallel.
If knockdown efficiency is low, this usually is not caused by low transfection efficiency, but this can be easily verified using flow cytometry or fluorescence microscopy and fluorescently labeled siRNA or a GFP encoding plasmid. Mostly the cause is an inefficient siRNA or plasmid DNA. Under these circumstances it should be considered to increase the amount of siRNA (up to 2-3 µg) or plasmid DNA (up to 1-2 µg) or to use a different siRNA or expression vector if available. Alternatively, satisfactory results might also be achieved by using a pool of several different siRNAs directed against the same target. Furthermore, time course experiments might be required to accurately determine the period of maximal effect, which is usually reached after 24 to 72 hr after transfection.
Apart from transfection by electroporation there are further well established techniques for transfection of mammalian cells. Frequently applied systems are chemical transfection agents which can form complexes with the cargo nucleic acid and then facilitate the transport into the cells. The most commonly used reagents are either based on different lipid species or can be chosen from a number of cationic polymers3. For both approaches a diverse selection is commercially available. These transfection reagents offer the advantage that they are usually easy to use, do not require much time, and work with adherent cells as well, thus removing the necessity for detachment. Unfortunately, macrophages are rather difficult to transfect by these methods as they do not proliferate significantly in vitro and possess defense mechanisms directed against foreign cytosolic DNA13-15. Thus, chemical transfection approaches frequently result in a severe reduction of cell viability. However as shown in Figure 2 there are chemical transfection agents which can successfully transfer siRNA into macrophages, but as flow cytometric (Figure 2A) and fluorescent microscopic (Figure 2B) analyses indicate they fail to achieve the same homogenous distribution of siRNA within the cells as obtained by Nucleofection. In fact, the flow cytometric data indicate that two different populations of transfected cells occur, firstly a population with similar fluorescence as the cells after Nucleofection is detected and secondly there is a population with more intense fluorescence. Definite confirmation is still required but we suppose that the first population is in the fluorescence microscopy identical with those cells which show a homogenous distribution of fluorescent siRNA within the cytosol while the second population likely corresponds to the cells with very bright agglomerates. The flow cytometric data shown in Figure 2A suggest that nucleofection results in less siRNA per cell than the alternative lipofection approach. However the data in Figure 3 shows that even the comparatively small amount of siRNA incorporated by Nucleofection is already sufficient for 80 to 90% knockdown of the target gene. Therefore the additional amount of siRNA incorporated by the second population after chemical transfection is very likely surplus and is thus more likely to cause undesired side effects than to further increase knockdown efficiency. Apart from that formation of intracellular agglomerates is already undesirable in itself since those siRNA molecules are likely not functional or at least less efficient than free siRNA molecules and might cause off target effects. Furthermore the true nature of these agglomerates is not yet clear. It is possible that these bright spots represent endosomes indicating that the siRNA was internalized by the cells but subsequently release from the endosomes failed and the siRNA remains trapped and therefore ineffective. Alternatively the spots could be agglomerates which are formed intracellularly. Functional evaluations of the chemical transfection are pending, therefore no definitive statements on knockdown efficiency can be made yet, still the existence of two distinct populations is already unfavorable as this means that all results describe the mean of both populations, this does therefore not correspond to either of the populations. For that reason Nucleofection is the superior approach.
Nevertheless there are also limitations to the transfection procedure outlined here. Since the cells have to be in suspension for Nucleofection adherent cells need to be detached, which presents an additional stress factor to the cells. Furthermore the entire protocol is rather time consuming. Since transfections cannot be performed simultaneously, but have to be performed quickly in order to avoid cell damage, the number of samples is limited to about 8 - 10 per experiment. Thus, this protocol is not suited for high throughput screening projects. For high throughput applications different Nucleofector systems are available. Firstly, there is the 4D-Nucleofector system that offers a 16 well strip format. For even larger throughput, there are the 96 well Shuttle system and the 384 well HT Nucleofector system. However as these newer systems work with conductive polymer electrodes instead of aluminum and therefore electrical conditions, i.e. programs and composition of Nucleofector solution, have changed accordingly, it needs to be determined if our protocol can be transferred to those systems.
However, despite these limitations the protocol presented here does yield a reliable and effective transfection of THP-1 cells which is superior to all other non-viral approaches. This protocol enables the investigation of the effects of altered gene expression in THP-1 cells which in all other aspects differentiate and polarize normally and thus show as little side effects of transfection as possible.
Disclosures
Publication costs for this video-article are sponsored by Lonza Group Ltd.
Acknowledgements
We are grateful to Lonza Group Ltd. for sponsoring this publication by covering the publication costs. We thank the Deutsche Infarktforschungshilfe, Wilhelm-Vaillant-Stiftung, Ernest-Solvay-Stiftung, and the Thüringer Ministerium für Bildung, Wissenschaft und Kultur for financial support to SL.
Materials
| Name | Company | Catalog Number | Comments |
|---|---|---|---|
| Accutase I | Sigma-Aldrich | A6964 | |
| Amino acids, nonessential | PAA | M11-003 | |
| Centrifuge tubes (15 ml) | TPP | TPP91015 | |
| Fetal calf serum (FCS gold) | PAA | A15-151 | |
| Human Monocyte Nucleofector Kit | Lonza | VPA-1007 | Contains Nucleofector Solution, cuvettes, and Pasteur pipettes |
| Human serum off the clot | Lonza | C11-020 | |
| Isove's Modified Dulbecco's Medium (IMDM) with 25 mM HEPES and 25 mM L-glutamine | Lonza | 12-722F | |
| Lymphocyte Growth Medium 3 (LGM3) | Lonza | CC-3211 | |
| Mouse T Cell Nucleofector Medium | Lonza | VZB-1001 | |
| Nucleofector 2b | Lonza | AAD-1001 | |
| Penicillin / streptomycin / L-glutamine (100x) | Sigma-Aldrich | G1146 | |
| Phorbol 12-myristate 13-acetate (PMA) | Fisher Scientific | BP685 | |
| Roswell Park Memorial Institute 1640 Medium (RPMI 1640) | PAA | E15-840 | |
| siRNA / plasmid | |||
| Sodium pyruvate (100 mM) | Sigma-Aldrich | S8636 | |
| THP-1 human leukemia monocytes | CLS | 300356 | |
| Tissue culture flasks (75 cm²; 150 cm²) | TPP | TPP90076/TPP90151 | |
| Tissue culture plates (6-well; 12-well) | TPP | TPP92406/TPP92012 | |
| Tubes (1.5 ml) | StarLab | S 1615-5500 | |
| Water (nuclease-free) or appropriate siRNA/plasmid buffer | |||
| X-Vivo 20 with gentamycin | Lonza | BE04-448Q | |
| β-Mercaptoethanol | Sigma-Aldrich | M3148 |
References
- Ricardo, S. D., van Goor, H., Eddy, A. A. Macrophage diversity in renal injury and repair. J Clin Invest. 118 (11), 3522-3530 (2008).
- Mosser, D. M., Edwards, J. P. Exploring the full spectrum of macrophage activation. Nat Rev Immunol. 8 (12), 958-969 (2008).
- Morille, M., Passirani, C., Vonarbourg, A., Clavreul, A., Benoit, J. P. Progress in developing cationic vectors for non-viral systemic gene therapy against cancer. Biomaterials. (24-25), 3477-3496 (2008).
- Schnoor, M., et al. Efficient non-viral transfection of THP-1 cells. J Immunol Methods. 344 (2), 109-115 (2009).
- Maeß, M. B., Buers, I., Robenek, H., Lorkowski, S. Improved protocol for efficient nonviral transfection of premature THP-1 macrophages. Cold Spring Harb Protoc. 2011 (5), (2011).
- Ma, W., Liu, Y., Ellison, N., Shen, J. Induction of C-X-C chemokine receptor type 7 (CXCR7) switches stromal cell-derived factor-1 (SDF-1) signaling and phagocytic activity in macrophages linked to atherosclerosis. J Biol Chem. 288 (22), 15481-15494 (2013).
- Xie, Q., et al. Cell surface localization of ABCG1 does not require LXR activation. Arterioscler Thromb Vasc Biol. 26 (11), 143-144 (2006).
- Buers, I., Robenek, H., Lorkowski, S., Nitschke, Y., Severs, N. J., Hofnagel, O. TIP47, a lipid cargo protein involved in macrophage triglyceride metabolism. Arterioscler Thromb Vasc Biol. 29 (5), 767-773 (2009).
- Robenek, H., Buers, I., Hofnagel, O., Lorkowski, S., Severs, N. J. GFP-tagged proteins visualized by freeze-fracture immuno-electron microscopy: A new tool in cellular and molecular medicine. J Cell Mol Med. 13 (7), 1381-1390 (2009).
- Guh, J. H., et al. Development of novel adenosine monophosphate-activated protein kinase activators. J Med Chem. 53 (6), 2552-2561 (2010).
- Park, E. K., Jung, H. S., Yang, H. I., Yoo, M. C., Kim, C., Kim, K. S. Optimized THP-1 differentiation is required for the detection of responses to weak stimuli. Inflamm Res. 56 (1), 45-50 (2007).
- Maeß, M. B., Wittig, B., Cignarella, A., Lorkowski, S. Reduced PMA enhances the responsiveness of transfected THP-1 macrophages to polarizing stimuli. J Immunol Methods. 402 (1-2), 76-81 (2014).
- Angosto, D., et al. Evolution of inflammasome functions in vertebrates: Inflammasome and caspase-1 trigger fish macrophage cell death but are dispensable for the processing of IL-1b. Innate Immun. 18 (6), 815-824 (2012).
- Latz, E., Xiao, T. S., Stutz, A. Activation and regulation of the inflammasomes. Nat Rev Immunol. 13 (6), 397-411 (2013).
- Muruve, D. A., et al. The inflammasome recognizes cytosolic microbial and host DNA and triggers an innate immune response. Nature. 452 (7183), 103-107 (2008).
Reprints and Permissions
