We present a method for inducing elevated intraocular pressure (IOP), by injecting magnetic microspheres into the rat eye, to model glaucoma. This leads to strong pressure rises, and extensive neuronal death. This protocol is easy to perform, does not require repeat injections, and produces stable long-lasting IOP rises.
Method Article
Experimental Glaucoma Induced by Ocular Injection of Magnetic Microspheres
In This Article
Summary
Abstract
Progress in understanding the pathophysiology, and providing novel treatments for glaucoma is dependent on good animal models of the disease. We present here a protocol for elevating intraocular pressure (IOP) in the rat, by injecting magnetic microspheres into the anterior chamber of the eye. The use of magnetic particles allows the user to manipulate the beads into the iridocorneal angle, thus providing a very effective blockade of fluid outflow from the trabecular meshwork. This leads to long-lasting IOP rises, and eventually neuronal death in the ganglion cell layer (GCL) as well as optic nerve pathology, as seen in patients with the disease. This method is simple to perform, as it does not require machinery, specialist surgical skills, or many hours of practice to perfect. Furthermore, the pressure elevations are very robust, and reinjection of the magnetic microspheres is not usually required unlike in some other models using plastic beads. Additionally, we believe this method is suitable for adaptation for the mouse eye.
Introduction
Primary glaucoma is a devastating eye disease affecting an estimated 60.5 million people throughout the world1, which can lead to life-altering vision loss and blindness2. Research into the disease mechanisms, and development of novel therapeutics for glaucoma, are dependent on good models of the disease which recapitulate some of the hallmarks of the pathology.
We present here a rat glaucoma model based on the method of Samsel et al.3 The overall goal of this technique is to increase intraocular pressure (IOP) in the eye by injecting magnetic microspheres into the anterior chamber, and using a magnetic ring, direct them into the iridocorneal angle. This impedes aqueous outflow, which increases IOP, leading to neuronal damage and cell loss. The protocol was developed to attempt to provide a simpler, inducible model of glaucoma.
This protocol may have some advantages over existing techniques. Genetic mouse models such as the DBA/2J are available, which do not require procedures to initiate; however these may have an unpredictable onset of disease progression4. In contrast, inducible models, most of which rely on surgically elevating IOP in rodents, have the advantage that initiation can be controlled by the user. Some of these methods may have drawbacks of their own however, including being technically challenging5, and can require multiple procedures to maintain elevated IOP6.
In contrast, the inducible method detailed in this manuscript is a simple, effective, and reproducible technique that produces stable, robust increases in pressure, with minimal need for reinjection. Additionally, it does not involve expensive equipment, and only requires basic surgical skills to perform. This protocol may be appropriate for readers who are looking to set up a less technically demanding inducible glaucoma model in their laboratory.
Protocol
Ethics statement: All animal experiments have been conducted in accordance with the Institutional Animal Care and Use Committee (IACUC), and were approved in agreement with United Kingdom Home Office guidelines (http://goo.gl/FLkirW, last accessed 10th June, 2014) and the ARVO Statement for the Use of Animals in Ophthalmic and Vision Research (http://goo.gl/4LFOjD, last accessed 10th June, 2014).
1. Ocular Hypertension Induction
- Induce experimental glaucoma by elevating the intraocular pressure (IOP) via unilateral injection of paramagnetic microspheres into the anterior chamber of Brown Norway rats, based on the method of Samsel et al.3 Other pigmented rats may be suitable, although these would need to be validated first by the user.
- House 250-300 g female ex-breeder Brown Norway rats in a constant low-light environment (40-60 lux) to minimize diurnal fluctuations in IOP7, with access to food and water ad libitum.
- Take baseline IOP measurements in awake animals8 prior to anesthesia and bead injection, using a rebound tonometer calibrated for use in the rat eye9. IOP is taken as the mean of five readings.
- Anaesthetize rats with 37.5 mg/kg ketamine, and 0.25 mg/kg medetomidine hydrochloride delivered intraperitoneally. Confirm depth of anesthesia by testing animal’s rear foot reflexes, prior to povidone iodine application (see step 1.5), and bead injection (see step 1.8). Administer 0.5% proparacaine hydrochloride for analgesia.
NOTE: Do not dilate the pupil at any stage. This will help the beads to settle better into the iridocorneal angle, and prevent binding to the lens. Apply ocular ointment to prevent corneal drying on un-operated contralateral eye. - Wash the operative eye with 5% povidone iodine in water10 5 min prior to injection.
- After 5 min, wick the povidone iodine off using sterile gauze, and wash the eye with 0.9% sterile saline solution. Keep the eye moist during anesthesia with regular application of sterile saline.
- Place a toroidal magnet around the eye.
- Inject 25 μl of a solution containing 30 mg/ml of gamma-irradiation sterilized 8 μm magnetic microspheres in Hank’s Balanced Salt Solution (HBSS) into the anterior chamber, using a 33 G beveled needle.
- To prepare beads, wash by re-suspending, then centrifuging 3 times at 10,000 x g for 5 min with 1 ml HBSS, before making the final 30 mg/ml solution. Maintain sterile conditions throughout.
- For injection, be careful to avoid inserting the needle to the iris, to minimize the risk of iris trauma. This can be prevented by orientating the needle tangential to the corneal surface, as parallel to the iris as possible. This will also help to minimize bead loss from the injection site.
NOTE: Inject beads at a rapid rate to ensure an even distribution around the iridocorneal angle, which is critical to raising IOP. Additionally, store beads, needles and magnetic rings separately so that the beads do not form clusters, making them difficult to load into the syringe and inject, and the needle does not become magnetized.
- Leave the needle in place for 1 min post-injection to ensure that beads settle into the iridocorneal angle to impede aqueous drainage from the trabecular meshwork. Slightly angle the needle after the beads have initially settled to allow some leakage of aqueous, to minimize transient increases in IOP. At the end of the surgery flush the needle through with first phosphate buffered saline (PBS), then 70% ethanol, followed by distilled water, to ensure continued use of the needle in separate procedures. Alternatively, one could use disposable needles if the correct gauge and syringe combination is available. Optional: needles may be sharpened using a beveller to prolong their use.
- At this stage if necessary, remove the magnet, and use it to draw beads into areas of incomplete coverage.
- Leave the magnet in place around the eye for a further 10 min post-injection to ensure beads settle well into the iridocorneal angle.
- Reverse anesthesia using 0.25 mg/kg atipemezole hydrochloride.
- Administer chloramphenicol, or other antibiotic ointment, for example gentamycin or terramycin topically to prevent infection, and 0.5% proparacaine hydrochloride for analgesia. Leave animals to recover on a heat mat until they regain movement, then transfer to a warm box and supply with additional nutrition, such as a food supplement or moistened regular diet until recovery is complete. Systemic or local analgesia should be given to animals displaying signs of pain 24 hr after surgery. If these symptoms persist despite treatment, animals should be humanely culled.
- Use the contralateral eye as an unoperated control.
- Take IOP measurements every 2-3 days following bead administration, and every 2-3 days thereafter using a rebound tonometer calibrated for use in the rat eye9.
- The criteria for including eyes in studies can be: if 1) the IOP is elevated above the contralateral control pressure by 5 mmHg, and 2) does not exceed 60 mmHg.
- Eyes where the pressure returns to baseline (usually by 1 week post-injection) should not be included in the studies, however it is possible to re-inject beads in eyes that fail to develop high IOP if desired.
- Euthanize animals by CO2 asphyxiation at the end of the experiment.
- Dissect eyes and optic nerves, and fix in 4% paraformaldehyde (PFA) overnight for further histological analysis.
2. Assessing Retinal Neuron Damage Using TUNEL Staining
- To quantify apoptotic cells in whole mount retinasuse the terminal deoxynucleotidyl transferase-mediated dUTP nick-labelling (TUNEL) assay, according to the manufacturer’s instructions.
- Dissect the retina from the eye cup, wash for 3 x 5 min in 0.3% Triton X-100 in phosphate buffered saline (T-PBS).
- Permeabilize the tissue in 3% T-PBS for 2 hr.
- Pre-equilibrate retinas in Equilibration Buffer for 10 min, before incubation in TUNEL reaction solution for 1 hr at 37 °C.
- Wash the tissue for 3 x 5 min in 0.3% T-PBS, rinse in 0.3% T-PBS containing 5 µM DAPI, and flat-mount in mounting media.
- To quantify TUNEL positive nuclei use a confocal microscope to take 10 µm z-stacks through the ganglion cell layer at 20X magnification. Take 3 images on each of the 4 petals, at sites close to the optic nerve, in the mid-periphery, and at the far periphery of the retina, giving a total of 12 images per whole mount, sampling approximately 7,000 cells. Morphological criteria discriminated non-neuronal (endothelial and glial) cells from neuronal cells.
- Select areas for imaging using only the DAPI channel, and mask investigators to treatment groups.
3. Assessing Optic Nerve Damage Using Toluidine Blue Staining
- Fix optic nerves overnight in Karnovsky’s solution at 4 °C.
- Treat specimens for 2 hr in 1% (w/v) osmium tetroxide and then dehydrate in 100% ethanol.
- Incubate optic nerves in propylene oxide for 30 min, and place in a 50:50 mixture of propylene oxide:araldite overnight.
- Change this solution to 100% araldite, followed by incubation overnight at 60 °C.
- Cut semithin sections (0.75 mm thick) and stain with 1% toluidine blue/ borax (TB) in 50% ethanol before examination by light microscopy.
4. Statistical Analysis
- Carry out statistical analyses using an appropriate statistics software package. A two-way ANOVA with Newman-Keul’s post-hoc test may be used to calculate statistical significance for IOP changes over time.
- A p value of less than 0.05 may be considered significant.
Results
Injection of magnetic beads into the iridocorneal angle consistently induced a prolonged and robust rise in pressure (Figure 1), which was readily observable at the first time point, 3 days post-injection. Furthermore, the increase in pressure was maintained throughout the duration of the experiment, and although our time course finished at 18 days post-injection, others have reported that pressure persists long-term3. The mean IOP averaged over the full length of the experiment for control, non-bead-injected eyes was 19.7 ± 0.3 mmHg, compared with 40.5 ± 2.8 mmHg for bead-injected eyes (P <0.001). Additionally, peak IOP increased from 22.8 ± 0.3 mmHg to 49.9 ± 2.3 mmHg.
To determine whether the elevation in IOP leads to death of retinal ganglion cells, we performed TUNEL staining on retinas, and histology on transverse optic nerve sections (Figure 2). In the retina we observed an increase in TUNEL staining (Figure 2A) in bead-injected eyes with elevated IOP. The number of apoptotic nuclei rose approximately 15-fold, from 1.6 ± 0.5 cells in contralateral controls, to 24.5 ± 0.5 cells in hypertensive retinas (Figure 2B; P <0.05). Furthermore, in eyes in which magnetic beads were injected but pressure did not increase (likely due to incomplete blockage of the iridocorneal angle), the numbers of TUNEL-positive cells were not significantly different from those of uninjected controls (P >0.05). This suggests that cell death was related to pressure increases, not due to direct toxicity of the magnetic microspheres. Finally, we investigated optic nerve pathology in the glaucoma model, and saw accumulation of toluidine blue in many of the axons, indicating degeneration of these cellular processes (Figure 2C).
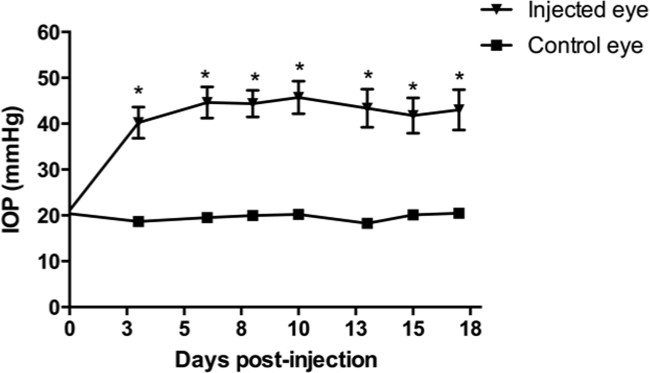
Figure 1. Elevation of intraocular pressure using magnetic microspheres. Injection of magnetic microspheres into the anterior chamber induced a robust, significant rise in intraocular pressure (IOP) in comparison to contralateral control, non-injected eyes. Y-axis units = millimeters of mercury (mmHg). Data = mean ± SEM. * = P <0.001; N = 12. This figure has been modified from Foxton et al., Am. J. Pathol. 182(4): 1379-1390.
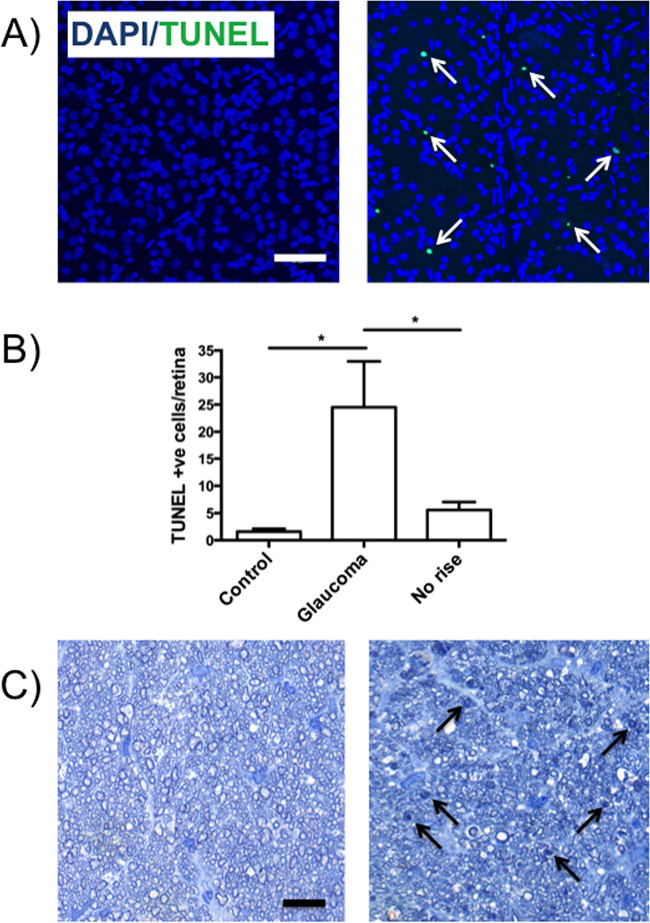
Figure 2. Elevation of IOP by injection of magnetic microspheres into the iridocorneal angle, induced neuronal death in the ganglion cell layer (GCL). (A) Representative images of retinas from control (left) and glaucoma (right) eyes stained for apoptotic nuclei by TUNEL (green; white arrows) and DAPI (blue), indicating the number of apoptotic nuclei increased as IOP rose. (B) Quantification of TUNEL positive cells in the GCL, showing that eyes with elevated IOP (middle), had significantly more apoptotic cells in comparison to control (left). In contrast, in bead-injected eyes where pressure did not rise (right), no significant increase in TUNEL staining was observed. Data = mean ± SEM. * = P <0.05; N = 7 - 8. (C) Representative images of optic nerve staining, demonstrating an increase in toluidine blue accumulation (black arrows) in damaged axons from glaucoma (right), but not control eyes (left). Scale bars = 50 μm. This figure has been modified from Foxton et al., Am. J. Pathol. 182(4): 1379-1390.
Discussion
Here we demonstrate a method for inducing elevated IOP in the rat, by injecting magnetic microspheres into the anterior chamber of the eye. This method is simple to carry out, and requires little surgical expertise, or hours of practice and refinement. Furthermore, the procedure is effective; rarely requiring more than a single injection of beads to induce a strong, robust rise in pressure (approximately 10% reinjection rate). This may provide an advantage over existing inducible methods, such as the technically challenging episceral vein sclerosis11 model, or laser photocoagulation protocol6, which can require multiple procedures to maintain raised IOP.
In order for the method to be successful however, there are some small critical steps that need to be taken. Firstly it is useful to use a toroidal-shaped magnet to draw beads into the iridocorneal angle. This step is a modification of the original protocol, where the beads were injected into the anterior chamber, and then moved freehand around the eye3. Using a toroidal magnet means that microspheres should settle evenly around the angle, requiring minimal manual redistribution. Secondly, the rate of injection should be fast – too slow and the beads will predominantly accumulate on one side of the angle, leading to incomplete coverage, and potentially no pressure rise. Generally speaking though, the method is straightforward enough that the user could easily make modifications to the protocol, such as varying the size or volume of the microsphere particles, perhaps to attempt to alter the degree of the IOP elevation.
However, one potential drawback of the method is that one has little control over the extent of the hypertension, which in about 5-10% of cases we observed rose above 60 mmHg. Excessive rises in IOP can be very destructive to retinal tissue, and may make studying the mechanisms and biology of cell death challenging. However, the method produces a consistent neuronal pathology, both in the retina and optic nerve, which can be manipulated pharmacologically12. This may make the model attractive for developing novel therapeutics for treating glaucoma. Additionally, because the beads are directed into the iridocorneal angle, this leaves the visual axis free for live imaging of the retina or optic disc. We anticipate that this model will be adapted and used for future applications in other species, including mouse.
Disclosures
David T. Shima is an employee of Hofmann-La Roche, Switzerland. The remaining authors declare they have no competing financial interests.
Acknowledgements
We wish to thank Peter Munro PhD for his assistance with optic nerve sectioning. This study was supported by the Medical Research Council (G0901303), and in part by the Dorothy Hodgkin Postgraduate Award/Medical Research Council, the Helen Hamlyn Trust, Fight for Sight, and Moorfields special trustess,.
Materials
| Name | Company | Catalog Number | Comments |
|---|---|---|---|
| 250 - 300g female Brown Norway ex-breeder rats | Harlan UK | 203 | |
| Tonolab Rebound Tonometer | Tiolat | TV02 | |
| Ketaset (ketamine) | Fort Dodge Animal health | BN1000118 | 37.5 mg/kg |
| Domitor (medetomidine hydrochloride) | Orion Pharma | 140-999 | 0.25 mg/kg |
| Povidone iodine | Ecolab | BN4369LE10 | 5% in H2O |
| Minim's Saline Solution | Bausch and Lomb | PL00033/5017 | |
| Toroidal magnet | Supermagnete | R-10-07-03-N | |
| Magnetic Microspheres | Bangs Laboratories | UMC4N/9692 | |
| HBSS | Invitrogen | 14025 | |
| 33 G beveled needle | Hamilton | 7747-01 | Custom needle |
| Luer tip syringe | Hamilton | 80601 | |
| Antisedan (atipemezole hydrochloride ) | Orion Pharma | 141-003 | 0.25 mg/kg |
| Chloramphenicol ointment | Medicom | 18956-0005 | |
| TUNEL staining kit | Promega | G3250 | |
| Triton X-100 | Sigma-Aldrich | T8787 | |
| DAPI | Sigma-Aldrich | D9542 | |
| Vectashield mounting media | Vector Labs | H-1000 |
References
- Quigley, H. A., Broman, A. T. The number of people with glaucoma worldwide in 2010 and 2020. Br J Ophthalmol. 90 (3), 262-267 (2006).
- Weinreb, R. N., Aung, T., Medeiros, F. A. The pathophysiology and treatment of glaucoma: a review. JAMA. 311 (18), 1901-1911 (2014).
- Samsel, P. A., Kisiswa, L., Erichsen, J. T., Cross, S. D., Morgan, J. E. A novel method for the induction of experimental glaucoma using magnetic microspheres. Invest Ophthalmol Vis Sci. 52 (3), 1671-1675 (2011).
- Libby, R. T., et al. Inherited glaucoma in DBA/2J mice: pertinent disease features for studying the neurodegeneration. Vis Neurosci. 22 (5), 637-648 (1017).
- Morrison, J. C. Elevated intraocular pressure and optic nerve injury models in the rat. J Glaucoma. 14 (4), 315-317 (2005).
- Levkovitch-Verbin, H., et al. Translimbal laser photocoagulation to the trabecular meshwork as a model of glaucoma in rats. Invest Ophthalmol Vis Sci. 43 (2), 402-410 (2002).
- Moore, C. G., Johnson, E. C., Morrison, J. C. Circadian rhythm of intraocular pressure in the rat. Curr Eye Res. 15 (2), 185-191 (1996).
- Morrison, J. C., Jia, L., Cepurna, W., Guo, Y., Johnson, E. Reliability and sensitivity of the TonoLab rebound tonometer in awake Brown Norway rats. Invest Ophthalmol Vis Sci. 50 (6), 2802-2808 (2009).
- Wang, W. H., Millar, J. C., Pang, I. H., Wax, M. B., Clark, A. F. Noninvasive measurement of rodent intraocular pressure with a rebound tonometer. Invest Ophthalmol Vis Sci. 46 (12), 4617-4621 (2005).
- Isenberg, S. J. The ocular application of povidone-iodine. Community Eye Health. 16 (46), 30-31 (2003).
- Morrison, J. C., et al. A rat model of chronic pressure-induced optic nerve damage. Exp Eye Res. 64 (1), 85-96 (1997).
- Foxton, R. H., et al. VEGF-A is necessary and sufficient for retinal neuroprotection in models of experimental glaucoma. Am J Pathol. 182 (4), 1379-1390 (2013).
Reprints and Permissions
