We introduce a novel workflow for electron microscopy investigations of brain tissue. The method allows the user to examine neuronal features in an unbiased fashion. For elemental analysis, we also present a script that automatizes most of the workflow for randomized sampling.
Method Article
An Unbiased Approach of Sampling TEM Sections in Neuroscience
In This Article
Summary
Abstract
Investigations of the ultrastructural features of neurons and their synapses are only possible with electron microscopy. Especially for comparative studies of the changes in densities and distributions of such features, an unbiased sampling protocol is vital for reliable results. Here, we present a workflow for the image acquisition of brain samples. The workflow allows systematic uniform random sampling within a defined brain region, and the images can be analyzed using a disector. This technique is much faster than extensive examination of serial sections but still presents a feasible approach to estimate the densities and distributions of ultrastructure features. Before embedding, stained vibratome sections were used as a reference to identify the brain region under investigation, which helped speed up the overall specimen preparation process. This approach was used for comparative studies investigating the effect of an enriched-housing environment on several ultrastructural parameters in the mouse brain. Based on the successful use of the workflow, we adapted it for the purpose of elemental analysis of brain samples. We optimized the protocol in terms of the time of user-interaction. Automating all the time-consuming steps by compiling a script for the open source software SerialEM helps the user to focus on the main work of acquiring the elemental maps. As in the original workflow, we paid attention to the unbiased sampling approach to guarantee reliable results.
Introduction
In electron microscopy, it is often challenging to sample representative regions within the sections. We, as an observer, are often biased to look at specific regions drawn to our attention by conspicuous features of the sample, preventing a well distributed, unbiased sampling. Sampling bias can only be avoided if every part of the region of interest gets the same chance of ending up in an electron micrograph1. It is possible to avoid sampling bias without a software solution, for example, by pushing the trackball of the microscope manually without looking at the image, so as to select sampling regions wherever the stage stops. But strictly speaking, this is not a random procedure, because, consciously or subconsciously, the user can have an influence on the movement of the stage, and, moreover, this is not a sophisticated way of selecting sampling regions. Random sampling becomes especially important if pairs of sections are used to assess the number of structures in a certain volume, for example, for stereology1, which requires pairs of sections, a known distance apart. It would also be possible to look only at a single section and estimate the number of specific structures2, but with this approach investigators tend to overestimate the numerical density of larger structures, unless the structures are very small in comparison to the section thickness. Alternative approaches are to reconstruct volumes of tissue from serial sections and thus get the desired data3. But this is very time consuming and not a feasible approach for (bigger) comparative studies.
To overcome these problems, we have developed a workflow that allows the researcher to automatically select samples for obtaining electron micrographs at regular spacing within ultra-thin sections. The position of the electron micrographs is random, allowing unbiased sampling. The approach is suitable both for determining numerical densities of structures (for example, synapses within a certain neuropil volume4,5), and the dimensions of structural features (for example, the width of the synaptic cleft, or the diameter of the postsynaptic density4,5).
The workflow uses a custom-made random point sampling (RPS) software (written in Java script using Scripting software supplied with our microscope) that automatically calculates grid positions within a predefined region of interest in an ultra-thin section. The RPS software moves the stage of the electron microscope to these predefined points, so that an electron micrograph can be made at each point. First, the user defines a region of interest within the thin section. Next, the RPS software calculates grid positions within this region. The x/y coordinates of the first position are created randomly, and the remaining positions are placed at regular grid intervals in respect to the first position. Because every part of the region of interest has the same chance of being examined, this allows minimal data collection. This approach of sampling is also called systematic uniform random sampling (see references6,7 for more details).
For determining the numerical densities of structures, we work with pairs of sections that are a known distance apart. After obtaining an electron micrograph from the first section in one of the predetermined positions, TEM Serial Section software (part of the software package supplied with our electron microscope) moves to the corresponding point in the second section, in order to obtain an electron micrograph of the corresponding location. This is repeated for every location in the predetermined grid. In our approach, a disector is used to count the number of particles in each pair of electron micrographs8,9. A disector consists of a pair of counting frames, one for each section8,9. The numerical density of objects is determined by only counting objects visible on the first section (or reference section) but not on the second section (or lookup section). This allows to estimate the numerical densities of objects in a fast and efficient way8,9. Additionally on single sections, two-dimensional structural features can be measured.
We have applied this workflow successfully to assess differences in synapse numbers in the hippocampus of mice exposed to enriched environment (EE) housing conditions compared to standard environment (SE) housing conditions4,5, and also to evaluate the ultrastructural differences between wild type (WT) mice and neuropeptide Y (NPY) KO mice kept under SE and EE5. Our objective was to look specifically at structural features of neurons, such as the numerical synaptic density, the lengths of the active zone in cross-sections and of the postsynaptic density, the width of the synaptic cleft, and the number of synaptic vesicles, in order to assess changes in neuronal connectivity and activation between the different experimental conditions. Additionally, we were interested in the numerical density of dense-core vesicles (DCV) in neurons to determine the amount of stored neuropeptides in a certain brain area.
Based on the success of our approach for the studies described above, in our next step, we have adapted our workflow to select areas for unbiased elemental analyses within human brain samples. This was done to image iron, which is stored in ferritin molecules in both neurons and glial cells. For this, we compiled a script that allowed us to automate most of the operations for a random screening process of brain sections in a defined area.
Protocol
All experiments were approved by an ethical committee at the Federal Ministry of Science and Research of the Republic of Austria (BMWF-80.104/2-BrGT/2007 and BMWF-66.010/0037-II/3b/2013), or ethics commission of the Medical University of Graz, number 28-549 ex 15/16, and conducted according to the Directive of the European Communities Council of 24 November 1986 (86/609/EEC) and the Directive of the European Parliament and of the Council of 22 September2010 (2010/63/EU). The animal experiments were designed and performed in such a way that the number of animals used was minimized.
1. Dissection and Fixation of the Tissue
- Euthanize mice (21 weeks old, female C57BL/6J mice and C57BL/6N mice; male WT and NPY KO mice on a mixed C57BL/6:129/SvJ (1:1) background respectively) by injecting 150 mg/kg pentobarbital intraperitoneally.
- Remove the brains from the skull and immediately cut them in half (separating the left from the right hemisphere) - using a scalpel.
- Immediately place the halves into glass containers with 2% formaldehyde and 2.5% glutaraldehyde in 0.1 M cacodylate buffer (CH3)2AsO2Na·3H2O, pH adjusted to 7.4 with 1M NaCl), pH 7.4 at 4 °C.
CAUTION: The fixatives are toxic and should be handled with great care. Use only with protective gloves and under the fume hood. - Fix the brain halves for 2 days at 4 °C and rinse in the same buffer for at least 24 h, also at 4 °C. The volume of the buffer should be at about tenfold the specimen volume.
2. Identify the Region of Interest within the Brain by Comparing Vibratome Sections with Reference Sections from the Mouse Brain Atlas10
- Place the brain sample onto a vibratome. Ensure that the orientation of the brain is correct (in this case, a coronal orientation was chosen for the hippocampus).
- Trim until the region of interest (ROI) in the brain is reached. Cut the sections at a large thickness (e.g., 100 µm) until the part of the brain with the region of interest is reached and throw away every section.
- Start to cut the vibratome sections with 20 µm thickness at the beginning of the brain part with the ROI and place the vibratome sections on a glass slide. Stain them (Nissl stain) by placing the sections into 0.05% thionine acetate in sodium acetate buffer, pH 4.2 for 1 min (Figure 1Ai).
- Compare the stained sections with the mouse brain atlas using a light microscope and continue cutting and staining until the desired brain coordinates are reached.
3. Obtaining a Sample Region for Embedding
- As soon as the right area is identified, start cutting one section at 150 µm thickness with the vibratome.
- Microdissect this vibratome section with a razor blade under the stereo microscope. Cut away the parts around the ROI. The section should have a suitable size for the following preparation steps for transmission electron microscopy (TEM) (not bigger than 1 x 1 mm2).
4. TEM Preparation - Embedding, Ultra-Thin Sectioning and Staining
- Embedding
- Post-fix for 2 h in 2% osmium tetroxide at room-temperature (RT). Use a volume to cover the sample with at least 10 times the sample volume, but avoid using excess fixative to prevent unnecessary toxic waste.
CAUTION: Osmium tetroxide is highly toxic and should be handled with great care. Use only with protective gloves and under the fume hood. - Dehydrate using EM Grade alcohols in steps of 20 min. Use a greater volume than that in the previous step (50%, 70%, 80%, 96% and 100% ethanol).
- Place in propylene oxide for 40 min at RT. Place into a mixture of propylene oxide/embedding resin (1:2) for 2 h at RT and 1:3 overnight at 4 °C.
CAUTION: Propylene oxide is highly toxic and should be handled with great care. Use only with protective gloves and under the fume hood. - Embed the samples in 100% resin by changing the resin 2 times after 60 min and once after 90 min (all at 45 °C).
- Finally, place the samples into the proper molds and let the resin polymerize at 90 °C for 3 days (Figure 1Aii).
- Post-fix for 2 h in 2% osmium tetroxide at room-temperature (RT). Use a volume to cover the sample with at least 10 times the sample volume, but avoid using excess fixative to prevent unnecessary toxic waste.
- Trimming and Sectioning on an ultramicrotome.
- Trim the block, ensuring that the sides are as smooth as possible for the sections to adhere to each other (Figure 1Aiii).
- Produce 55 nm ultra-thin serial sections (should be silver grey) using an ultramicrotome. Use a slot grid (slot width 1 x 2 mm) coated with pioloform (Figure 1Aiv).
- Counterstain ultra-thin sections on the slot grids using 2% uranyl acetate for 30 min and lead citrate for 30 s at RT (this is standard electron microscopy method11).
CAUTION: Uranyl acetate is highly toxic and any direct contact should be avoided. Handle only with protective gloves. Lead nitrate is toxic if swallowed or inhaled and should be handled with great care.
5. Imaging of Corresponding ROIs on the Reference and Look-Up Sections on TEM with Software Packages
- Examine the sections on the grid with the TEM using a low magnification (depending on the size of the sections) for orientation and to evaluate the quality of the sections.
- Start the software (a package of TEM Image Analysis Software, or TIA, supplied with microscope) to generate virtual images of the sections by storing the corner points of the sections. That allows the software to find the corresponding positions of the ROI on each section.
- Go to Section and choose Insert to add the corner points for the reference and look-up section. Follow the instructions of the pop-up window. Start with the reference section and then continue with the look-up section. Make sure that the edges of the section which are parallel to the next section as points 1 and 2 (Figure 1Bi) are entered.
- Visualize the reference section under low magnification to identify the region of interest and move the microscope stage using TIA on the reference section to multiple corner points of the ROI to create an outline of the ROI.
- Record the coordinates of the resulting polygon using RPS software. For this, press Add coordinates in the dialog box of the RPS software at each point of the polygon that is needed to outline the ROI in the section (Figure 1Bii).
- Define and enter a suitable size for the sampling areas and distances between the areas into RPS software (in the presented study, the size of the sampling areas is 7 µm and the distance between them is 20 µm, resulting in at least 20 sampling areas within the ROI). Press Calculate Raster, then the software generates sampling area coordinates in a systematic uniform random fashion for the micrograph's positions within the polygon (Figure 1Biii).
NOTE: For better orientation, the polygon and the sampling areas within the polygon can be displayed by the RPS software (Figure 1Biv).
- Store the sampling points on the reference and look-up section using the RPS software and TEM Serial Section software. These are the coordinates of the montages which are recorded afterwards11.
- In the RPS software, press Go to next position to move the microscope stage to x/y coordinates of each sampling area in the reference section. Go to Location and Insert to import these coordinates in the software in the reference section. Repeat this for all coordinates.
- To mirror the coordinates from the reference section onto the look-up section, go to Section and press Go to Section. Enter the number of the look-up section (usually '2') in the dialog window.
- For the recording of the montages (see next step), switch between the reference and look-up section as described before and change the position on the reference section with Location and Go to Number. Choose the next coordinate in the dialog window.
- For the SerialEM montages at each sampling coordinate, go to File and choose New Montage from the drop-down menu. Select the right number of tiles and percentage of overlap in the dialog window. For the present study, a magnification of 5000X is sufficient to recognize the synaptic features under study, but the limited field of view of the CCD camera required making montages of 2 x 2 images. The montages are made with the SerialEM.
- Before recording each montage, readjust the focus (or, if possible, activate the autofocus option in the recording software). Choose the folder to save the montage file and start the recording of the montage by pressing Start in the montage submenu on the left in SerialEM.
6. Analyze the TEM images with ImageJ To Document Ultrastructural Features.
NOTE: For this, it is important to create an aligned image stack from the reference and look-up section.
- Convert the image-pairs with ImageJ Images to Stack into a stack file and align the images with StackReg (has to be installed from BIG-EPFL http://sites.imagej.net/BIG-EPFL/; in the present case, the algorithm Affine was used). To obtain the numerical densities of cellular structural features, the custom-made ImageJ macro Disector generates a counting frame with a size of 5.5 x 5.5 µm placed randomly over the image with a random angle.
- Start the macro Disector (location in the ImageJ menu depends on the directory where it is saved) and define the parameters (size of the counting frame, number of segments) as needed (Figure 1Cii).
- Count the number of synapse/µm2 using the Disector. Count every synapse within the counting frame that is visible in the reference section, but not visible in the lookup section. Omit those synapses that intersect with the two 'forbidden lines' of the disector; but do count synapses on the opposite 'acceptance lines'. For this, use the Multipoint Tool located in the Toolsbar in ImageJ (Figure 2A, Figure 2B).
- For measuring synapse parameters, select only the synapses with a synaptic cleft oriented in cross section (on the reference section; within the same image frames used for the disector).
- Start the plugin ObjectJ in ImageJ from the drop-down menu (Figure 2A) via Plugins | Analyze. Open a new project from the ObjectJ drop-down dialog. This will open a window that allows the user to outline and mark structures with Marker Tool (Figure 2B, red circle). The synaptic parameters used for the experiments presented here are described in the following steps.
- Measure the length of the presynaptic membrane and postsynaptic density length by drawing a line along the structure using the Marker Tool (Figure 2B, red circle).
- Obtain the mean width of the synaptic cleft by drawing a polygon covering both the pre- and postsynaptic membrane, with straight parallel sides and a segmented line midway, equidistant to both membranes.
- For determining the number of docked vesicles, count all vesicles that have a maximum distance from the presynaptic membrane of one vesicle diameter or less.
- For determining the number of undocked vesicles, count those vesicles with a maximum distance of one vesicle diameter from docked or other undocked vesicles at the same synapse.
7. Producing Semi-Thin Sections for Light Microscopy to Document Macroscopic Features (in the present case the cell number) within the Same ROI as Chosen for the TEM Investigation.
- Immediately after cutting the ultra-thin sections for TEM, cut two semi-thin sections, 0.5 µm thick and immediately adjacent to each other. Place on a glass slide and stain them using 0.5% toluidine blue solution. Place a cover slip on the sections (with DPX mounting medium, consisting of distyrene, a plasticizer (tricresyl phosphate), and xylene). These two sections are used to count the cell numbers.
- Photograph the semi-thin sections at low magnification using a light microscope.
NOTE: The structures under investigation must be identifiable in the images. In the present study, 20X magnification was used to identify cell bodies. If necessary, multiple images can be stitched together with an image processing software. - Align the pairs of two consecutive semi-thin sections with an image processing software (e.g., ImageJ).
NOTE: Differences of rotation and size (can occur due to compression artefacts introduced by the sectioning process) should be adjusted for a perfect overlay of the two sections. - Mark the border of the ROI on the light microscopy image. The ROI must correspond to the ROI used for the TEM images. For this purpose, load the images into ImageJ and choose the polygon selection from the Toolsbar (Figure 2A).
- Generate a grid over the whole image using ImageJ by opening Analyze | Tools | Grid and set the parameters as needed.
- Calculate the area and volume of the polygon from the number of grid-points within the area of interest and section thickness (Volume = NCS * AGS * hST ; NCS = Counted Cross sections; AGS = Grid Size; hST = Section thickness).
- Count the number of nuclei from neuronal cell bodies within the ROI if they are only present on one section. Choose Multipoint Tool in ImageJ from the Toolsbar and mark the cells. After counting the cells on each section, calculate the number of cells per volume (
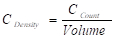 ; CDensity = Cell density; CCount = Cell Count).
 - Record all the measurements in the ObjectJ Results window (Figure 2C). Export and save them for further use.
8. Using SerialEM Script to Optimize Elemental Analysis in Brain Samples in Combination with DigitalMicrograph (DM, supplied with imaging filter).
- Tuning of Imaging Filter (GIF).
- Load the sample into the TEM and go to a hole in the sample for the GIF tuning using the trackball or the joystick of the microscope.
- Switch to Energy Filtered TEM (EFTEM) in DM software /or DM and select CCD camera in DM.
- Choose the magnification for the elemental analysis (the magnification depends on the structure/area of interest; in the present case, the magnification is set from 76 k up to 125 k). Set the exposure time to 0.001 s and start VIEW.
- Focus the beam carefully until the edges can be seen and center the beam in the image. Reduce C2/the objective aperture until the edges of the aperture are visible and center the beam with the trackball for the beam.
- Defocus the beam (around C2 46.2%, exposure time for tuning should be around 0.05 s) and find the zero loss peak (ZLP) by pressing the ZLP button. Start the tuning procedure by pressing the Full tune button.
- Get random points of acquisition.
- Switch back to TEM imaging mode and select the Camera and check the focus at magnification 10 k (adjust z-axis and set defocus to zero).
- Select LM 75X magnification and check if the camera is not inserted (otherwise it cannot be controlled by SerialEM software).
- Start SerialEM and open a new project.
- Open the navigator. Check the settings for the camera in Camera & Script Controls (for VIEW and RECORD) and start VIEW (camera is inserted automatically).
- To make a corner map of the ultra-thin section, choose Add points in the Navigator window.
- Set the corner points at the edges of an ultra-thin section. Move the stage to a corner point by holding down the right-mouse-key. When a corner of the section is reached, add a corner point with left-mouse-click. Repeat the procedure to add 3 more corner points. Make sure that in the navigator window the box C for corner points is ticked for the stored points.
- To start the corner montage (preferable at magnification LM 75), go to Navigator in the SerialEM menu-bar and choose Montaging & Grids and Setup Corner Montage from the drop-down menu.
NOTE: The best fitting settings for the chosen record parameters are displayed. Change them if needed. In the present case, only the overlap percentage was changed to 20%.
- Outline the section/ROI on the montage image. Choose Add Polygon in the navigator window and outline the section with multiple right-mouse-clicks. Choose Add grid of points in the navigator drop-down menu and define a distance between the points (the distance depends on the experimental question; e.g., 10 µm, Figure 3).
- Follow the script commands. Enter the number of grid points as shown in the navigator and enter the number of acquisition points (e.g., 20).
- Set the illumination threshold so that the script can avoid grid bars. Follow the script commands and move the stage manually to cover the field of view by one quarter with a grid-bar. According to the displayed value, enter a threshold illumination value (should be higher than the value displayed).
- Wait until the points for acquisition are selected and the cooking routine is finished.
NOTE: This takes a long time and can be done overnight; the script sends the microscope into standby after finishing the cooking routine; the cooking routine is important to stabilize the sections in the electron beam.
- Energy filtered TEM (EFTEM) elemental analysis
- Choose EFTEM mode in TIA/DM and select CCD camera in DM.
- Center the beam and follow the script commands that will move the stage to each sampling coordinate.
NOTE: The user will be asked if the stage should be moved to the next coordinate. - Align the zero loss peak (ZLP) and set C2 to ~46.2%.
- Set the energy at 60 eV (in this case, the value is set for the detection of the Fe M-edge), slit at 10 eV and exposure time at 0.4 s. Insert the slit and set C2 to ~43.9%.
- Start view and focus the image.
- Set C2 to 46.2%, align ZLP and set C2 back to 43.9%.
- Acquire elemental map with elemental specific settings.
NOTE: Default settings can be used in the acquisition dialog, but it is recommended to test these beforehand, if possible; example filtered images are shown in Figure 4. - Set C2 to 46.2% and acquire thickness map.
- Repeat for all the determined acquisition points (Step 8.3.2-8.3.12).
- Follow the instructions of the script and get the single electron micrographs or montages of the acquisition points. Choose the magnification so that all the (ultra-) structural information is visible/identifiable.
- Save LOG file, navigator and results window and remove the slit.
- Close the valve, remove the sample and shut down the TEM.
Results
Here, we describe a workflow to select the areas for TEM in an automatic and unbiased way. The user selects the area of interest within an ultra-thin section under the TEM, and uses several software solutions for the workflow including our RPS software that automatically calculates the coordinates of 20 sampling areas within the area of interest. Then, the TEM stage is moved to each sampling area for photography. This is possible both for analyzing single sections and for analyzing pairs of sections, a known distance apart, which allows selecting areas for imaging without the bias of the investigator.
This workflow proved valuable when documenting ultrastructural features in mouse brain sections4,5. In these studies, the polymorph cell layer of the dentate gyrus (DGpl) was examined as an area of interest. Our method proved suitable for examining the DG, because a coronal section of the dorsal DG (Bregma −1.3) fits into an ultra-thin section and its outlines are readily recognized at low magnification. If other brain regions were to be examined, it would be important to check their size and distinguishing features before planning the experiments.
Applying the workflow described here showed that EE housing increases the width of the synaptic cleft significantly in the DGpl4, in respect to standard housing conditions. Moreover, the number of dense core vesicles was significantly decreased in the EE-housed animals4, indicating the changes in the household of neuropeptides. When WT and NPY knockout mice were kept under EE conditions, the number of neurons/µm³ in the DGpl increased while the density of DCV decreased in respect to SE-housing5. In contrast, NPY knockout resulted in a significant increase of synaptic vesicles in the reserve pool (undocked synaptic vesicles) independent of housing conditions5. The effect of EE on the width of the synaptic cleft was reversed in the NPY KO group resulting in a significant difference between EE-housed WT and NPY KO mice5. Taken together with behavioral studies of WT and NPY knockout animals held under both types of housing conditions, this indicates a crucial role of NPY for the neurobiological effects of EE5.
For visualizing the iron stored in the human brain, a script was compiled for SerialEM software to randomly choose the points of acquisition from within a whole ultrathin section, with the aim of obtaining an energy filtered electron micrograph at each of these points. After loading the section into the electron microscope, the script performed the stabilization of the section (i.e., the 'specimen-cooking' routine) overnight. The script then randomly selected a number of points predefined by the user from those marked with a grating in Figure 3. By producing a test micrograph and checking its gray levels, the script checked if the chosen points were located on a visible part of the section, rejecting the points that landed on grid bars. Most of the workflow was handled by the script with minimal interaction of the user. However, it was not possible to automatically record energy filtered micrographs (with this setup), as there was too little light for the autofocus routine of SerialEM. Therefore, we switched to DM software as soon as the script had moved the stage to each point, adjusted the focus by hand, and made an EFTEM image of iron. An example for an EFTEM iron image from post-mortem human brain is shown in Figure 4.
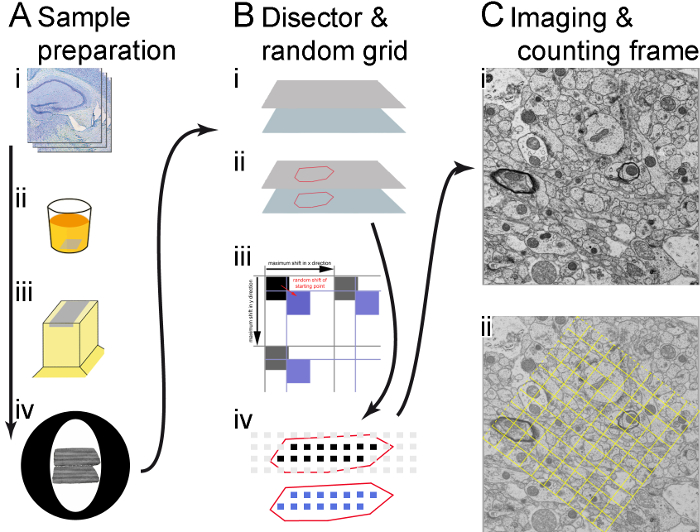
Figure 1. Illustration of the workflow. (A) The main steps of the sample preparation are shown (in direction of the arrow): vibratome sections (i), embedding(ii), cutting semi-thin and ultra-thin sections (iii), and catching pairs of ultra-thin sections on copper grids (iv). (B) Usage of both the microscope supplier's software and custom-made RPS software to create sampling area coordinates that determine the recording sites. The corner points of the sections are stored in the microscopy software and the ROI is outlined (identified with the help of the semi-thin sections) (i); a grid of sampling areas is generated over the ROI, a random shift (red arrow) is introduced in x and y. The shift is smaller than the distance between the sampling areas, (black arrows), so that instead of the black squares, which have no shift, the blue squares, which are shifted randomly, are used to determine the recording sites (ii); only sampling areas within the borders of the ROI (drawn as black and blue squares) are used for recording. Micrographs are made both in the reference section (black squares) and in corresponding locations in the lookup section (blue squares) (iii). (C) A micrograph is made at each sampling area at a sufficient magnification; a montage consisting of several merged images is made if needed (in this case, 2 x 2 images were merged together) (i); a counting frame is generated and shown as an overlay in the image, structures within the frame and on the 'acceptance lines' (dashed frame lines) will be counted, but not those on the 'forbidden lines' (solid frame lines) (ii). Please click here to view a larger version of this figure.
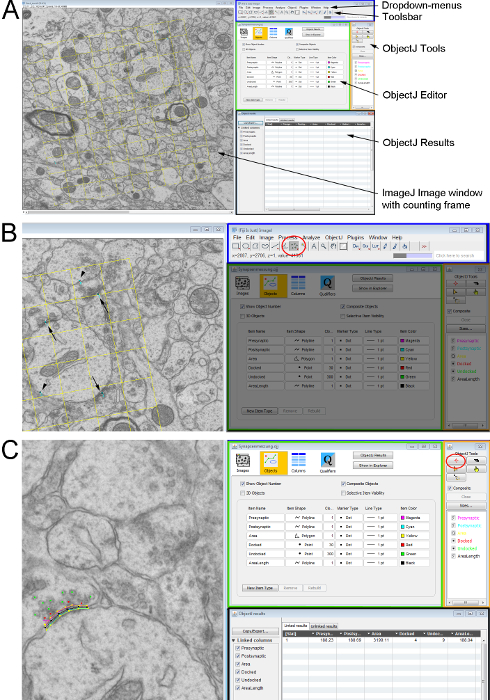
Figure 2. Measuring ultrastructural parameters on a pair of ultra-thin sections with an unbiased counting frame. (A) Overview of the ImageJ windows used for counting and analyzing cellular structures. Left-hand side shows the electron micrograph with the counting frame as an overlay. On the right-hand side: the ImageJ user interface (blue rectangle) with the drop-down menu (top) and the Toolbar (below); the ObjectJ object editor (green rectangle); the ObjectJ Tools window (orange rectangle) where the tools for measuring can be selected and the ObjectJ results window (black rectangle) where all the measurements are documented. (B) Detail from A showing the marked synapses on the electron micrograph (synapses on both sections - arrows; synapse only on the lookup section- arrowheads). Those are marked using the Multipoint-Tool (red circle) from the Toolbar in ImageJ. (C) The names and measuring parameters of the synaptic features are defined using the ObjectJ Tools. The Marker-Tool and the feature of interest are selected and the outline drawn in the image by left-mouse-clicks along the structure. Please click here to view a larger version of this figure.
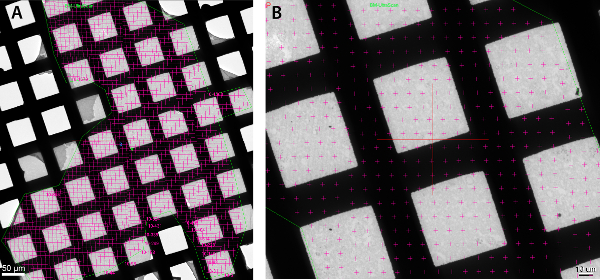
Figure 3. Selecting sampling areas for elemental mapping within a ROI for energy filtered transmission electron microscopy. SerialEM is used to select a region of interest and to suggest a high number of sampling areas at a regular spacing (pink crosses in the images A and B). A script then randomly selects sampling areas (from these predefined coordinates) for acquisition. Sampling areas with poor illumination are rejected to avoid grid bars and the script stops as soon as 20 well illuminated sampling areas have been selected within the ROI. (A) Overview of the whole area of interest, outlined by a polygon, with a high number of possible sampling areas marked with X. (B) Detail of A showing the sampling areas before random selection. Please click here to view a larger version of this figure.
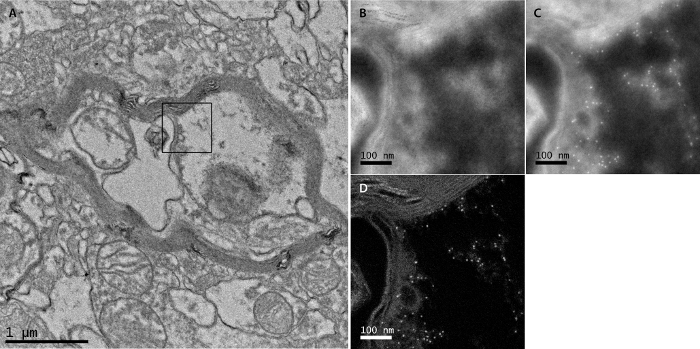
Figure 4. Example of elemental map (EFTEM) acquisition. (A) Bright field TEM micrograph of area around acquisition point. A randomly selected area was used to obtain an elemental map and is marked by a black rectangle. (B) EFTEM pre-edge window image made in the randomly selected area. (C) EFTEM post-edge window image made at the same area. (D) Elemental map of iron of the same area (M-edge). Please click here to view a larger version of this figure.
Discussion
The workflow presented here allows the researcher to get data on ultrastructural features in an unbiased fashion. This is much less time consuming than volume investigations from serial sections. Several different applications are used to achieve this goal. At first, our custom-made RPS software (for details on availability, please contact the corresponding author) is used to introduce a random stage-shift to select the sampling area coordinates. This allows a systematic uniform random sampling of the ROI. Next, for the counting of specific structures, we adapted the disector method, where 2 consecutive sections with known distance are compared, in a novel way compared to previous studies13,14,15 as we used our custom-made RPS software for systematic uniform random sampling. This saves time as compared to 3D-reconstructing whole volumes from serial sections. The custom-made RPS software is specifically developed for one type of microscope which is a limiting factor for reproducing the workflow. An alternative from this specific software would be an application that allows scripting and is compatible with other microscope models.
We successfully used this approach for our comparative studies4,5. On ultra-thin sections of neuronal tissue, the area of interest was outlined and images were taken by systematic uniform random sampling within this area. It has to be noted that the area of interest, the polymorph layer of the dentate gyrus, is a rather small area to investigate which might be beneficial for our approach. Within a randomly placed disector, we evaluated the number of DCV and several ultrastructural features of synapses in the DGpl of adult mice housed in SE and EE as well as adult WT mice versus adult NPY knockout mice. Using our approach, the collected data showed changes in some of the investigated parameters. These findings confirmed the ones from other similar studies in juvenile animals2.
A drawback of the experimental usage of this workflow might be that this multi-application-approach is not ideal in terms of user-friendliness, as the users need to get comfortable with different user-interfaces (in our case, the user interface, TEM Serial Section, the RPS software, and SerialEM software). Learning to handle all the applications in an efficient way is time consuming and should be taken into account. However, investing the time in learning to use this workflow is still clearly favorable over the time which is needed to analyze whole volumes with serial section TEM. The method of using a disector placed by systematic uniform random sampling in the area of interest is sufficient to present reliable data1 without the need to investigate a high amount of sections/volume.
To maximize the outcome in our studies, it was vital to take good care during sample preparation, as the preservation of the tissue and the structures is not only crucial for evaluating structural features, but also for identifying the area of interest unambiguously. A pivotal factor, and perhaps another drawback of this method, is that a high quality of the ultra-thin sections pairs is required: there must be no holes or wrinkles that cover the area under investigation in either of the sections, and the section thickness must be maintained homogeneous. The researcher has to be well-trained in ultramicrotomy. Care has also to be taken when imaging the sections in the TEM, as the sections are sensitive to electron beam damage and can easily tear apart. Furthermore, it is important to choose the right number of sampling areas in the ROI. Depending on the experimental aim, the magnification of the electron micrographs has to be set carefully. For our experiments specifically, counting synapses in the central nervous system, 20 regions of interest on one section with the area of 30.25 µm2 are optimal. It is advised to train the personnel well in recognizing the features in question (in our case synapses, synaptic features and DCV) to get reliable results. In order to identify synapses, the synaptic vesicles must be identifiable and this requires a resolution of at least 10 nm. For this, a magnification of 5000X was optimal, but it has to be noted that the magnification depends on hardware parameters such as the type and position of the cameras and would need to be adapted for other microscope and/or camera types. It also has to be noted that the protocol uses applications specific for one TEM and that users with other models have to consider the differences in the setup.
We believe our workflow can be adapted for many other applications not only in neuroscience but in a wide field of biological science and also material science (when the high resolution of a TEM is needed) whenever the research question demands a systematic uniform random sampling and the amount of samples to be examined asks for a time efficient way of analysis. For example, we are currently interested in localizing iron stores in the human brain. For this, we have recently adapted our workflow, to enable elemental analysis on ultra-thin sections in randomly chosen areas. In order to minimize the number of applications that are needed for the workflow, we aimed to apply using the SerialEM software only, because it can be programmed to move the stage to pre-set points that can be selected in a random fashion. We created customized scripts to control the TEM, with the aim of automatizing the workflow entirely. This proved feasible except for the autofocusing in filtered imaging mode, which did not yield satisfying results. We thus used DM software for focusing and for obtaining the energy-filtered images.
In summary, we present software solutions that help in obtaining electron micrographs in an unbiased way.
Disclosures
The authors have nothing to disclose.
Acknowledgements
Funded by the Austrian Science Fund, FWF, project number P 29370 B27
Materials
| Name | Company | Catalog Number | Comments |
|---|---|---|---|
| Pentobarbital | SigmaAldrich | P3761 | |
| Formaldehyde | Merck | 1040051000 | 1kg |
| Glutardialdehyde | Science Services | E 16210 | 25%; 100ml; EM grade |
| cacodylate buffer | Merck | C4945 | 250g; Dimethylarsinic acid sodium trihydrate |
| Thionine acetate/Ceristain | Merck | 861340 | |
| acetic acid | Merck | 1000631000 | 1 L |
| Sodium hydroxide | Merck | 1064951000 | 1 kg, pellets |
| osmium tetraoxide | Science Services | E 19110 | 10x1g |
| TAAB embedding resin | Science Services | TAT001 | 500g |
| DMP-30 | Science Services | TAD024 | 100g |
| DDSA | Science Services | TAD025 | 500g |
| Uranyl acetate dihydrate | Plano GmbH | 19481 | depleted, 25g |
| Ultrastain 2 | Leica | 16707235 | Lead citrate |
| Toluidine blue solution | Agar Scientific | AGR1727 | 10g |
| Pioloform | Plano GmbH | R1275 | 10g Powder |
| Proylenoxide | SigmaAldrich | 82320-1L | 1L |
| DPX embedding medium | Plano GmbH | R1320 | embedding medium for semi-thin sections on glass slide, 50 ml |
| Vibratome, Leica VT 1000 | Leica Microsystems, Vienna, Austria | ||
| Leica Ultracut UCT, ultramicrotom | Leica Microsystems, Wetzlar, Germany | ||
| Tecnai G2 20 | FEI,Eindhoven, Netherlands | ||
| Megaview wide angle camera | Olympus Soft Imaging Solution, Münster, Germany | ||
| US 1000 digital camera | Gatan, Pleasanton, USA | ||
| TEM Imaging Analysis Software | FEI,Eindhoven, Netherlands | ||
| FEI Serial Section Software | FEI,Eindhoven, Netherlands | ||
| Fiji, ImageJ 1.52e | National Institute of Health, USA | ||
| SPSS 20.0 | SPSS Inc., Chicago, IL, USA | ||
| SerialEM | Regents of the University of Colorado | ||
| RPS (random point sampling) software 0.9a | custom-made | ||
| Disector v1.0.2 (ImageJ macro) | custom-made | ||
| EFTEMSerialEM (SerialEM script) | custom-made |
References
- Howard, V., Reed, M. Unbiased Stereology: Three-Dimensional Measurement in Microscopy. , BIOS Scientific Publishers. Oxford. (1998).
- Nakamura, H., Kobayashi, S., Ohashi, Y., Ando, S. Age-changes of brain synapses and synaptic plasticity in response to an enriched environment. Journal of Neuroscience Research. 56 (3), 307-315 (1999).
- Landers, M. S., Knott, G. W., Lipp, H. P., Poletaeva, I., Welker, E. Synapse formation in adult barrel cortex following naturalistic environmental enrichment. Neuroscience. 199, 143-152 (2011).
- Reichmann, F., et al. A novel unbiased counting method for the quantification of synapses in the mouse brain. Journal of Neuroscience Methods. 240, 13-21 (2015).
- Reichmann, F., et al. Environmental enrichment induces behavioural disturbances in neuropeptide Y knockout mice. Scientific Report. 6, 28182(2016).
- Mayhew, T. M. Taking Tissue Samples from the Placenta: An Illustration of Principles and Strategies. Placenta. 29, 1-14 (2008).
- Ferguson, S., Steyer, A. M., Mayhew, T. M., Schwab, Y., Lucocq, J. M. Quantifying Golgi structure using EM: combing volume-SEM and stereology for higher throughput. Histochemistry and Cell Biology. 147, 653-669 (2017).
- Sterio, D. C. The unbiased estimation of number and sizes of arbitrary particles using the disector. Journal of Microscopy. 134 (2), 127-136 (1984).
- Gundersen, H. J., et al. The new stereological tools: disector, fractionator, nucleator and point sampled intercepts and their use in pathological research and diagnosis. APMIS. 96 (10), 857-881 (1988).
- Franklin, K. B. J., Paxinos, G. The Mouse Brain in Stereotaxic Coordinates. , Elsevier/Academic Press. (2008).
- Lewis, P. R., Knight, D. P. Staining Methods for Sectioned Material. , Elsevier/North-Holland Biomedical Press. (1988).
- Mastronarde, D. N. Automated electron microscope tomography using robust prediction of specimen movements. J Struct Biol. 152 (1), can be downloaded from http://bio3d.colorado.edu/SerialEM 36-51 (2005).
- Rampon, C., Tang, Y. P., Goodhouse, J., Shimizu, E., Kyin, M., Tsien, J. Z. Enrichment induces structural changes and recovery from nonspatial memory deficits in CA1 NMDAR1-knockout mice. Nature Neuroscience. 3 (3), 238-244 (2000).
- Xu, X., Ye, L., Ruan, Q. Environmental enrichment induces synaptic structural modification after transient focal cerebral ischemia in rats. Experimental Biology and Medicine. 234 (3), 296-305 (2009).
- Lonetti, G., et al. Early environmental enrichment moderates the behavioral and synaptic phenotype of MeCP2 null mice. Biological Psychiatry. 67 (7), 657-665 (2010).
Reprints and Permissions
