We present a protocol to study the formation of hydrates in the presence of nonionic surfactants on the interface of a water droplet submerged in cyclopentane. The protocol consists of building a low-cost, programmable, temperature regulator. The temperature control system is combined with visualization techniques and internal pressure measurements.
A subscription to JoVE is required to view this content. Sign in or start your free trial.
Method Article
Studying Surfactant Effects on Hydrate Crystallization at Oil-Water Interfaces Using a Low-Cost Integrated Modular Peltier Device
In This Article
Summary
Abstract
We introduce an approach to study the formation and growth of hydrates under the influence of nonionic surfactants. The experimental system includes a temperature regulator, visualization techniques, and inner pressure measurements. The temperature control system contains a low-cost, programmable temperature regulator made with solid-state Peltier components. Along with the temperature control system, we incorporated visualization techniques and internal pressure measurements to study hydrate formation and inhibition in the presence of nonionic surfactants. We studied the hydrate-inhibiting ability of nonionic surfactants (sorbitane monolaurate, sorbitane monooleate, PEG-PPG-PEG, and polyoxyethylenesorbitan tristearate) at low (i.e., 0.1 CMC), medium (i.e., CMC), and high (i.e., 10 CMC) concentrations. Two types of crystals were formed: planar and conical. Planar crystals were formed in plain water and low surfactant concentrations. Conical crystals were formed in high surfactant concentrations. The results of the study show that conical crystals are the most effective in terms of hydrate inhibition. Because conical crystals cannot grow past a certain size, the hydrate growth rate as a conical crystal is slower than the hydrate growth rate as planar crystal. Hence, surfactants that force hydrates to form conical crystals are the most efficient. The goal of the protocol is to provide a detailed description of an experimental system that is capable of investigating the cyclopentane hydrate crystallization process on the surface of a water droplet in the presence of surfactant molecules.
Introduction
The incentive to understand the mechanism of hydrate crystallization and inhibition comes from the fact that hydrates occur naturally in oil pipelines and can result in difficulties in flow assurance. For example, the 2010 Gulf of Mexico oil spill1 was a result of hydrate accumulation in an underwater oil piping system, causing contamination to the environment. Hence, understanding hydrate formation and inhibition is crucial in order to prevent future environmental disasters. Much of the driving force for the study of hydrate crystallization in the past years is the oil industry's effort to prevent hydrate plug agglomeration and the subsequent blockage of flow. The first study to determine that hydrates were responsible for plugged flowlines was done by Hammerschmidt in 19342. To this day, oil producers find it highly important to understand and inhibit hydrate formation for flow assurance3.
One way to prevent hydrate formation is to insulate deep water pipelines so that ice does not form. However, it is expensive to adequately insulate the pipelines, and the additional costs can be in the order of $1 million/km3. Thermodynamic inhibitors, such as methanol, can be injected into wellheads to prevent the formation of hydrates. However, large volumetric ratios of water to alcohol, as great as 1:1, are needed in order to adequately prevent the formation of hydrates4. Recently, the global cost to use methanol for hydrate prevention has been reported as $220 million/year. This is not a sustainable amount of alcohol usage5. In addition, the use of methanol is problematic because it is environmentally hazardous, and cannot be used for large-scale transport5. Alternatively, kinetic inhibitors, such as surfactants, can suppress hydrate growth at small quantities and temperatures of up to 20 °C6. Hence, surfactant presence can reduce the large amount of alcohols needed for hydrate prevention.
Surfactants are considered good inhibitors for hydrate crystallization due to two main reasons:
1) They can inhibit hydrate formation through surface property changes; and 2) They initially help the formation of hydrate cells but prevent further growth and agglomeration of the crystal down the pipeline7. Although surfactants have proved to be efficient inhibitors, there is still a large amount of information missing regarding the crystallization process in the presence of surfactants. While some studies have shown that the use of surfactants can extend the initial hydrate crystallization time at certain subcoolings, other studies have found exceptions at low surfactant concentrations. At low surfactant concentrations, the water droplets tend to coalesce and accelerate the process of hydrate formation8. The inhibition process has been explained by surfactant molecules interrupting planar hydrate growth, forcing the hydrate into hollow-conical crystal formation. The conical crystals form a mechanical barrier for crystal growth9, and thus inhibit the growth.
In this study we designed and implemented a low-cost, integrated modular Peltier device (IMPd) along with a hydrate visualization cell and used them to study cyclopentane hydrate formation in the presence of nonionic surfactants. The reason for using cyclopentane instead of low molecular weight gases (e.g., CH4 and CO2) that usually form hydrates in deep sea reservoirs, is that these gases require higher pressures and lower temperatures to form stable hydrates. Because cyclopentane forms hydrates at ambient pressure and temperatures up to ~7.5 °C, it is often used as a model material for hydrate formation10.
The integrated modular Peltier device (IMPd) consists of an open-source microcontroller, Peltier plate, CPU cooler (heat sink), and waterproof digital temperature sensor. The device can deliver a maximum temperature differential of 68 °C. The minimum temperature resolution is 1/16 °C. The entire system, including the electrical circuitry and hardware, can be constructed for less than $200. The temperature sensor reports to the microcontroller, which sends output signals to the transistor. The transistor then passes current from the DC power source through the Peltier element. The heat sink helps cool the Peltier element by convecting the heat coming from the hot side of the Peltier to the ambient air. The assembled hardware components of the IMPd system are shown in Figure 1a,b. Figure 1c shows the wiring schematic with all the components of the control loop (proportional-integral-derivative [PID] controller) and the pin-outs. The output current of the microcontroller was limited with the gate resistor R1 to a maximum current of 23 mA (I = 5 V/220 W). The pull-down resistor R2 in Figure 1c allows the gate charge to dissipate and to turn the system off. To tune the PID controller, Ziegler-Nichols based methods combined with an iterative process are used11. Microcontroller integrated development environment (IDE) software is used to monitor and send commands to the microcontroller for temperature regulation.
Along with the IMPd, we applied a novel approach using visualization techniques and internal pressure measurements. The hydrate visualization cell, which is placed on top of the IMPd, is comprised of a brass cell equipped with two double-paned observation windows. The windows allow video recording of the hydrate formation process on the water droplet in cyclopentane. The complementary metal-oxide semiconductor (CMOS) camera is placed outside the window and the pressure transducer is connected to the water injection line in order to get the internal pressure measurements of the drop. A digital transducer application is used to get the readings from the pressure transducer. A camera viewer is used to capture the videos and images from the CMOS camera. The software controls the exposure and snapshot frequency. Image processing software programs are used to track the growth of the hydrate. Figure 2a shows a schematic description of the hydrate visualization cell and Figure 2b shows an overview of the entire experimental system. The seed hydrate (Figure 2a) is required for consistent nucleation and tracking of the hydrate growth rate. The seed hydrate is a small volume (e.g., 50–100 µL) of pure water deposited on the floor of the hydrate cell. As the temperature decreases, the drop forms ice, which then turns to hydrate as the temperature increases. The small piece of the seed hydrate then contacts the water droplet. This process controls the initiation of the hydrate in the submerged water droplet. Silica desiccant is inserted into the gap between the two glass slides (Figure 2c), which serve as viewing windows. The silica desiccant helps reduce the amount of frosting and fogging on the windows. Anti-fog is also applied to the outer window to reduce fogging. Images are captured with a CMOS camera and a 28–90 mm lens. A 150 W fiber optic goose-neck lamp is used for illumination. An acrylic cover is placed on top of the brass cell in order to limit evaporation of cyclopentane. Plumbing consists of a combination of flexible polytetrafluoroethylene (PTFE) tubing and rigid brass tubing. A syringe pump with a 1 mL glass syringe and a 19 G needle control the flow of water and surfactant solution. A pressure transducer monitors the pressure changes inside the water surfactant solution droplet. 19 G PTFE tubing connects the syringe to the T-fitting and 1/16 in. (1.588 mm) brass tubing connects the transducer and brass hook to the T-fitting (Figure 2d). A brass hook, approximately 5 cm in length with a 180° bend, generates the water/surfactant solution droplet. The bend ensures that the droplet generated by the syringe sits on top of the tube throughout the experiment. A 1/16 in. stainless steel T-fitting in conjunction with PTFE crush ferrules and PTFE thread tape seal the fittings.
Using this apparatus, we examined four different nonionic surfactants with different hydrophilic-lipophilic balances (HLB) that are commonly used in the oil industry: sorbitane monolaurate, sorbitane monooleate, PEG-PPG-PEG, and polyoxyethylenesorbitan tristearate.
Access restricted. Please log in or start a trial to view this content.
Protocol
1. Hydrate formation on water droplet in cyclopentane
NOTE: The experimental procedure described below is for the study of hydrate formation on a water droplet in cyclopentane using the IMPd and hydrate visualization cell described in the introduction.
- Attach a 19 G needle to the 1 mL glass syringe (Figure 2b, C).
- Rinse the 1 mL glass syringe and 19 G needle 3x with DI water.
- Fill the syringe with DI water.
- Fill the hydrate visualization cell (Figure 2b, E) with 25 mL of cyclopentane.
- Using the syringe, insert a droplet of DI water (i.e., 50−100 µL) at the bottom of the hydrate visualization cell. This water droplet is the seed hydrate.
NOTE: The drop should be placed at the bottom of the hydrate visualization cell. The purpose of the seed hydrate is to initiate the formation of the hydrate and to form consistent nucleation and tracking of the growth rate. - Place the temperature sensor inside the hydrate visualization cell, close to the bottom of the cell.
- Put the acrylic cover on the hydrate visualization cell to prevent evaporation of the cyclopentane. Use screws to keep the cover in place.
- Adjust the lights and camera to focus. Adjust the focus on the seed hydrate.
- Set the temperature of the Peltier plate to -5 °C in the temperature control device.
- Check the temperature values read by the temperature sensor.
- Once the temperature reaches -5 °C, make sure the droplet at the bottom (seed hydrate) turns to ice.
- Set the temperature of the Peltier plate to 2 °C in 0.5 °C increments.
- When the temperature reaches 2 °C, fill the plumbing with water using the syringe, and lower the brass hook into the cyclopentane to equilibrate for 5 min.
NOTE: This temperature ensures the solid ice is converted to hydrate, because the system is above the melting point of ice, yet below that of cyclopentane hydrates11. - Start recording with the camera.
- Press the Start Measurement on the pressure transducer software to start the digital transducer recordings.
- Connect the syringe to the syringe pump.
- Set the syringe pump to inject a volume of 2 µL and activate. The syringe will plunge the water into the cyclopentane bath to form the submerged droplet.
- Use a needle tip to remove a small piece of the seed hydrate.
- Bring the needle tip with the piece of seed hydrate (Figure 3a) into brief contact with the water droplet (Figure 3b) to initiate the formation of the hydrate on the water droplet.
- Press Record on the camera capture software. Record images of the crystallization process of the droplet hemisphere from the camera at 1 Hz.
2. Hydrate formation on water surfactant droplet in cyclopentane
NOTE: Hydrate crystallization experiments with surfactant solutions are performed in the same way as pure water. However, when using a surfactant solution to study the surfactant effect on hydrate crystallization there is a need to find the critical micelle concentration (CMC) of each surfactant. The CMC can either be found in the literature9 or using the method described below.
- Prepare 50 mL of standard solutions of sorbitane monolaurate, PEG-PPG-PEG, and polyoxyethylenesorbitan tristearate by dissolving a measured mass of each surfactant into deionized water to prepare a series of 12 solutions of each surfactant, each representing a different concentration ranging from 10-4 g/100 mL–1 g/100 mL.
- Prepare solutions of sorbitane monooleate in cyclopentane at different concentrations.
NOTE: Cyclopentane is used due to the high level of hydrophobicity and low solubility of sorbitane monooleate in water. The same concentrations are used for sorbitane monooleate as well. - Measure the surface tension of each surfactant solution using the stalagmometry method.
- Place the syringe pump and syringe vertically as shown in Figure 4 in order to count falling drops.
- Program the pump to expel 1 mL of solution at a rate of 0.5 mL/min and release the drops into the air.
- Obtain the drop volume (V) as an average by dividing 1 mL by the number of observed drops.
- Test each solution at least 3x.
- Calculate interfacial tension using

where g is the acceleration due to gravity, Δp is the density change at the interface (i.e., the density difference between the surfactant solution and air), V is the droplet volume, F is an empirical correction given by12
![Static equilibrium equation; F=1/2π[0.99979-1.32045(r/1√3)]; mathematical expression.](/files/ftp_upload/60391/60391eq2a.jpg "figure-protocol-2")
NOTE: Alternatively, surface tension of some surfactant solutions can be found in the literature9. - Plot the surface tension as a function of concentration. The surface tension will decrease with increasing surfactant concentration until it flattens and becomes constant.
- Find the CMC for each surfactant (i.e., the concentration where the surface tension flattens) and use it in the experiments.
NOTE: Increasing the surfactant concentration will not change the surface tension.
- Repeat the experimental procedure in section 1, but instead of water use surfactant solution at various concentrations compared to the CMC (i.e., 0.1x CMC, 1x CMC, and 10x CMC).
3. Image processing and interfacial stress measurements
NOTE: Tracking the conical and planar hydrate growth is performed with visual analysis methods. The software programs used are described in the Table of Materials. An example of the contour detection and coloring can be found in Figure 5. Because the camera only captures 2D projection of the spherical droplet, a 3D reconstruction needs to be created.
- Tracking the hydrate growth
- Open the first image of the image sequence using image processing software.
- Use the Length tool in the software to measure the length of the brass tube in the image.
- Set the scale of the brass tube in the image based on the known diameter of 1/16 in. (1.588 mm).
- Select 10 equally spaced snapshots from each sequence. The snapshots should capture the full process, from the point of nucleation to full droplet conversion.
- Repeat the scale setting (steps 3.1.1−3.1.3) for the 10 chosen snapshots.
- Use the software to manually detect the contour of the drop in every frame. Mark the contour in red (Figure 5b).
- Use the software to manually detect the contour of the hydrate in every frame. Color the entire area of the entire area of the hydrate in black (Figure 5b).
- Use mathematical modelling software to form a 3D reconstruction of the drop as a correction to the surface area.
NOTE: Full details on the construction of the 3D surface area is described in Dann et al.13.
- Apparent average interfacial stress measurements
NOTE: Apparent average interfacial stress is calculated using the internal pressure data collected from the pressure transducer.- Use the recorded data from the pressure transducer (ΔP).
- For every data point, use the Young-Laplace relation14 to determine the apparent average interfacial stress (y),
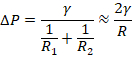
where R1 and R2 are the droplet radii of curvature and ΔP is the change in pressure within the droplet relative to t = 0.
NOTE: In the initial period following droplet formation, the two radii are approximately equal, hence R1 and R2 in the Young-Laplace equation can be replaced with the radius of the predetermined 2 µL drop equal to R = 782 µm.
Access restricted. Please log in or start a trial to view this content.
Results
Using this experimental system one can examine the hydrate formation at the oil-water interface and measure the interfacial stress associated with the crystallization process. Figure 6 shows a representative set of results that include both crystal formation and interfacial stress. In the planar shell growth (Figure 6a), the crystal grew from the two poles towards the equator. For that reason, in the planar crystal, the hydrate shell grew consta...
Access restricted. Please log in or start a trial to view this content.
Discussion
In this article we describe an experimental technique to study hydrate crystallization at the oil-water interface in the presence of nonionic surfactants. The apparatus is comprised of a temperature control system and a visualization cell that includes a brass chamber with windows, CMOS camera, and pressure transducer. The temperature control system is comprised of a microcontroller, powerful Peltier plate, 120 mm CPU cooler as the heatsink, and a waterproof digital temperature sensor. A hydrate visualization brass cell ...
Access restricted. Please log in or start a trial to view this content.
Disclosures
The authors have nothing to disclose.
Acknowledgements
The authors thank American Chemical Society - Petroleum Research Fund (ACS - PFR), grant number: PRF # 57216-UNI9, for financial support.
Access restricted. Please log in or start a trial to view this content.
Materials
| Name | Company | Catalog Number | Comments |
|---|---|---|---|
| 1/16 in. Swagelok 316 stainless steel T-fitting | Swagelok | ||
| 19 gauge PTFE tubing | Scientific Commodities, Inc. | ||
| 19-gauge needle (model: 1001 LTSN SYR) | |||
| 1-Wire DS18B20 - waterproof digital temperature sensor | |||
| Anti fog | RainX | ||
| Arduino Leonardo open-source microcontroller | |||
| Brass tubing 1/16 in. | K&S Precision Metals | ||
| Chemyx Fusion 100 Infusion Pump | Chemyx | ||
| cMOS camera acA640-750um | Basler | ||
| Cyclopentane 98% extra pure | ACROS organics | AC111481000 | |
| Fiber optic goose-neck lamp 150W | AmScope | ||
| Fotodiox macro extension tubes, 35 mm | |||
| Hamilton glass syringe 1 mL | Hamilton | ||
| ImageJ software | |||
| Kipon EOS to C-mount adapter | Kipon | ||
| Lens 28-90 mm | Canon | ||
| Mathematica software | Mathematica | ||
| OMEGA PX409-10WGUSBH pressure transducer | OMEGA | ||
| Peltier plate TEC1-12715 | Amazon | ||
| Pluronic L31 (PEG-PPG-PEG) | Sigma Aldrich | 9003-11-6 | |
| Pylon Viewer v5.0.0.6150 | Basler | ||
| Span 20 (Sorbitan laurate, Sorbitan monolaurate) | Sigma Aldrich | 1338-39-2 | |
| Span 80 (Sorbitan Monooteate) | Sigma Aldrich | 1338-43-8 | |
| Thermaltake NiC C4 120mm CPU cooler | Thermaltake | ||
| Tween 65 (Polyoxyethylenesorbitan Tristearate) | Sigma Aldrich | 9005-71-4 | |
| variable Tooluxe DC power supply |
References
- Graham, B., et al. Deep water: The Gulf Oil disaster and the future of offshore drilling. Report to the President. , (2011).
- Hammerschmidt, E. Formation of gas hydrates in natural gas transmission lines. Industrial & Engineering Chemistry. 26, 851-855 (1934).
- Sloan, E. D. A changing hydrate paradigm-from apprehension to avoidance to risk management. Fluid Phase Equilibria. 228-229, 67-74 (2005).
- Xiaokai, L., Latifa, N., Abbas, F. Anti-agglomeration in cyclopentane hydrates from bio- and co-surfactants. Energy & Fuels. 24, 4937-4943 (2010).
- Sloan, E. D. Fundamental principles and applications of natural gas hydrates. Nature. 426, 353-363 (2003).
- Sloan, E. D., Koh, C. Clathrate Hydrates of Natural Gases. , CRC Press. Boca Raton, FL. (2007).
- Lee, J. D., Englezos, P. Unusual kinetic inhibitor effects on gas hydrate formation. Chemical Engineering Science. 61, 1368-1376 (2006).
- Daimaru, T., Yamasaki, A., Yanagisawa, Y. Effect of surfactant carbon chain length on hydrate formation kinetics. Journal of Petroleum Science and Engineering. 56, 89-96 (2007).
- Karanjkar, P. U., Lee, J. W., Morris, J. F. Surfactant effects on hydrate crystallization at the water-oil interface: hollow-conical crystals. Crystal Growth & Design. 12, 3817-3824 (2012).
- Leopercio, B. C., de Souza Mendes, P. R., Fuller, G. G. Growth kinetics and mechanics of hydrate films by interfacial rheology. Langmuir. 32, 4203-4209 (2016).
- Karanjkar, P. U., Lee, J. W., Morris, J. F. Calorimetric investigation of cyclopentane hydrate formation in an emulsion. Chemical Engineering Science. 68, 481-491 (2012).
- Mori, Y. H. Harkins-brown correction factor for drop formation. AIChE Journal. 36, 1272-1274 (1990).
- Dann, K., Rosenfeld, L. Surfactant effect on hydrate crystallization at oil-water interface. Langmuir. 34 (21), 6085-6094 (2018).
- Ibach, H. Physics of Surfaces and Interfaces. , Springer Science & Business Media. Berlin, Germany. (2006).
Access restricted. Please log in or start a trial to view this content.
Reprints and Permissions
