Electrowetting-based digital microfluidic is a technique that utilizes a voltage-driven change in the apparent contact angle of a microliter-volume droplet to facilitate its manipulation. Combining this with functionalized magnetic beads enables the integration of multiple laboratory unit operations for sample preparation and identification of pathogens using Enzyme-linked Immunosorbent Assay (ELISA).
Method Article
Electrowetting-based Digital Microfluidics Platform for Automated Enzyme-linked Immunosorbent Assay
In This Article
Summary
Abstract
Electrowetting is the effect by which the contact angle of a droplet exposed to a surface charge is modified. Electrowetting-on-dielectric (EWOD) exploits the dielectric properties of thin insulator films to enhance the charge density and hence boost the electrowetting effect. The presence of charges results in an electrically induced spreading of the droplet which permits purposeful manipulation across a hydrophobic surface. Here, we demonstrate EWOD-based protocol for sample processing and detection of four categories of antigens, using an automated surface actuation platform, via two variations of an Enzyme-Linked Immunosorbent Assay (ELISA) methods. The ELISA is performed on magnetic beads with immobilized primary antibodies which can be selected to target a specific antigen. An antibody conjugated to HRP binds to the antigen and is mixed with H2O2/Luminol for quantification of the captured pathogens. Assay completion times of between 6 and 10 min were achieved, whilst minuscule volumes of reagents were utilized.
Introduction
The proposed method aims to facilitate automated sample preparation for ELISA with quantitative detection of antigens using EWOD-based approach with digital microfluidics (DMF) and magnetophoretic separation. It has been demonstrated for multiple biological applications that DMF in combination with magnetophoresis is an interesting alternative to liquid handling applications1. More specifically, the detection of pathogens is an implicit aspect in many sectors, ranging from healthcare2 to agriculture and the environment3,4 to national security5. A detection technology capable of addressing the threats from pathogens must feature high-throughput (e.g. short assay time), efficiency (low Limit of Detection – LoD – and high sensitivity) and specificity (to the target pathogen type) for it to be functional6.
Previously, EWOD-based DMF has been implemented successfully for Reverse Transcription Polymerase Chain Reaction (RT-PCR), detection of an antibiotic-resistant pathogen (Methicillin-resistant Staphylococcus aureaus or MRSA), M.pneumonia and C.albicans using a low-budget, printed-circuit-board chip and magnetophoresis7. The technique was applied also for the detection of deoxyribonucleic acid (DNA) mutations through pyrosequencing and chemiluminescent detection8. EWOD-based platforms also expand their functionality towards immunoassay applications, thereby enabling simultaneous sample recovery and detection all within a single, integrated platform. For instance, a single EWOD-chip design was demonstrated successfully with a DMF platform for point-of-care testing for both bead-based immunoassays of cardiac troponin I from a whole blood sample and as a separate experiment RT-PCR for MRSA detection2. That chip utilizes oil filler, which prevents evaporation of the droplets and facilitates the reliable automated manipulation of nanoliter volumes. Versatile bioapplications were investigated with the implementation of similar DMF approaches covering quantitative homogeneous and heterogeneous immunoassays9,10 including design of experiments (DoE) studies for assay parameter optimization11.
Despite its obvious merits to process intensification due to miniscule working volumes, an oil-filled DMF platform can be challenging and requires a certain level of expertise to operate. Oil-filled systems, because they require sealed component, are not ideal for certain in-field application where system transportability is important. In addition, an oil-based system would be very difficult if not impossible to use for some specific applications taking advantage of dry material collection on a surface such as proposed by Zhao and Cho12, Jönsson-Niedziółka et al.13, and Foat et al.14. In contrast, oil-free systems are simple to integrate and have the advantage of providing easy chip-to-chip sample translation. For these reasons, the proposed method was developed to provide an EWOD-based immunoassay on DMF which would not require oil, effectively simplifying the device operation.
In this contribution, we report on using a bespoke, free-standing, fully automated DMF platform for immunoassays, and we elaborate on the protocol for the rapid detection of biomolecules, namely: proteins, vegetative bacteria, bacterial spores and viruses. Combination of EWOD-chip with magnetic particles for automated sample preparation and immunoprecipitation has been demonstrated already with an additional off-line MS measurement15. Recently, in-field diagnostic against measles and rubella IgG has been demonstrated in remote Northwestern Kenya's population by the Wheeler group16. Both Wheeler's and our system, being transportable, self-contained, fully automated with included on-chip, real-time chemiluminescent measurements are arguably among the most advanced DMF biodetection systems available.
The two systems have been designed with very different applications in mind. Wheeler's system targets biomarker to allow biomedical diagnostics on patients whereas our biodetection system is built around defense requirement for direct detection of pathogen previously sampled from air. The similarity between the two is the underlying principle of droplet actuation, which demonstrates the broad range of life-influencing sectors that the EWOD-based technology can impact. Namely, the DMF-based detection platform and associated EWOD system could find key implication in health (biomedical diagnostic); military and civilian protection (threat detection); Agri-tech (crop monitoring) and work safety (controlled environment monitoring)
The performance of our DMF platform is assessed against fully automated detection of human serum albumin (HSA, a globular protein), Escherichia coli (E. coli, a vegetative bacteria), Bacillus atrophaeus (BG, a bacterial spore) and MS2 (a bacteriophage virus). More importantly, the proposed DMF-method is extremely versatile in the sense that the capture antibodies could be exchanged to target the detection of other antigens different from the four that are considered in this article. Sidestepping the antibody-based sensing entirely, the DMF platform could build to a potential application based on aptamer biosensing, where the magnetic beads carry specific aptamers for capture and/or detection of nucleotides. The design and realization of the different components constituting the integrated, completely self-contained DMF platform, including the high voltage waveform generator and drive electronics is disclosed elsewhere6.
Protocol
1. Preliminary steps necessary for the assay
NOTE (IMPORTANT): All preliminary steps must be conducted in a sterile environment to avoid contaminations. Sodium azide should not be used for storage as it would inhibit the activity of the horseradish peroxidase (HRP) enzyme.
- Prepare running buffer (100 mM HEPES, pH 7.5), using the (4-(2-hydroxyethyl)piperazine-1-ethanesulfonic acid, and add Tween 80 to a concentration of 0.01% (v/v).
- Immobilize the primary antibodies (capture antibodies) onto the surface of the NHS-activated magnetic microbeads by following the protocol provided by the supplier. Briefly, the Magnetic IP/Co-IP Kit (Table of Materials) protocol encompasses the following steps.
- Aliquot 0.2 mL of beads (2 mg) into a plastic tube and remove the supernatant.
- Wash the beads by adding 1 mL of ice-cold 1 mM HCl.
- Bind the selected antibody (Anti-Human Serum Albumin [15C7], Rb anti-BG polyclonal, Rb anti-E.coli MRE 162 polyclonal or Goat anti-MS2 polyclonal), 40 μg/mL in 67 mM Borate Buffer, covalently to the beads for 1 h with shaking at 37 °C. Table 1 contains the list of all antibodies used with the current protocol and the antigen pathogens6.
- Wash the unbound antibodies twice with 0.8 mL of Elution Buffer.
- Quench the reaction with 1 mL of Quenching Buffer for 1 h.
- Wash the beads once with Modified Borate Buffer and once with IP Lysis/Wash Buffer.
- Resuspend the beads in 0.5 mL of IP Lysis/Wash Buffer and store at 4 °C until required for use.
NOTE: For best results, a fresh batch of microbeads are coupled to the antibodies the day before the EWOD-isolation and ELISA on-chip. However, the microbeads coupled to the primary antibody can be stored at 4 °C up to one month. Should agglomeration occur, tap the vial to break the precipitate and to resuspend the beads in the solution. - Block the microbeads with the coupled antibody overnight, using final concentration 4 mg/mL for the microbeads, in a Blocker Casein (1% w/v) in 100 mM phosphate-buffered saline (PBS).
NOTE: The blocking step is always conducted the day before the biodetection assay run. - Separate the beads from the Blocker Casein using a magnet and remove the supernatant.
- Resuspend in 1 mL of running buffer and mix for 1 min.
- Separate the beads using the magnet and remove the supernatant.
- Repeat the above washing steps (1.2.10 and 1.2.11) twice.
NOTE: Three washing steps are sufficient to reduce the adhesion of the beads to the surface and to facilitate free movement of the droplet. - Resuspend the beads in the running buffer at a concentration of 2.5 mg/mL. This solution of microbeads is ready to use with the EWOD chip.
- Prepare a solution of the neutravidin conjugated horseradish peroxidase (HRP) and the secondary biotinylated antibody to a final concentration for each of 1 μg/mL in Running Buffer (used for BG detection6).
NOTE: To target the antigens (Table 1) various concentrations of secondary biotinylated antibody, ranging from 0.5 to 4.0 μg/mL were tested successfully. - Mix equal volumes of the Luminol with hydrogen peroxide solution just before running the assay
NOTE: Luminol is used to quantify the number of binding events based on the HRP enzyme that is bound covalently to the secondary antibody which targets the antigen (e.g., pathogen). However, different reporting molecule and strategies can be used for detection17 instead of the chemiluminescence and Luminol.
2. Manufacturing and surface treatment of the EWOD chip components
NOTE: The EWOD chip consists of an actuation plate with patterned chromium electrodes to alternate the apparent contact angle of a droplet and a cover plate to define the height of droplets.
- Draw the design of the electrodes and connectors in 2D using standard CAD software. Include also the waste collection pad with dimensions of 5 x 5 mm2 to store the used solvents (Figure 1).
NOTE: To manipulate the droplets we use 47 electrodes, each with dimensions of 1.7 x 1.7 mm2. This electrode size accommodates droplet volumes ranging from 1.5 µL to 3 µL (for a 500 µm gap). From experience, when working with a 500 µm gap, 1.5 µL is the minimum droplet size that can be actuated. It corresponds roughly to the droplet (projected) contour being circumscribed to the square pad. However, there is not any theoretical limit in size other than caused by the resistance (friction) of the body of fluid. Nonetheless, it is recommended that the volume does not exceed 3 µL for reliable actuation using a 500 µm gap. The electrodes are addressed by 48-channel electronics.
NOTE: The design dimensions and sizes of the pads can vary depending on the intended volumes and the laboratory unit operations (LUOs) that comprise the protocol. - Send the design drawing to a mask manufacturing service for printing the chromium mask onto a glass substrate. The thickness of the chromium layer is 100 nm.
NOTE: The chromium layer on the photomask used as a substrate for the EWOD chip is, by definition, opaque. The design of each of our electrodes includes a grid layout to ensure semi-transparency. - Cut the plate to size of 56 x 56 mm2 with a precision CNC Dicing/Cutting Saw.
- Stick masking tape over the electrical contacts in order to isolate them during the two coating steps.
- Coat the plate chromium-glass plate with a dielectric layer by depositing 6 µm Parylene-C onto its surface. The Gorham process18 is used with 7.4 g of DPX-C in a Parylene Deposition System (Table of Materials).
- Spin-coat amorphous fluoropolymers (Table of Materials) using a spin-coater at 1500 rpm for 30 s on top of the plate and bake it at 140 °C for 30 min.
NOTE: This renders the surface hydrophobic. One can validate whether the coating has been deposited successfully by placing a droplet of water onto the surface. The contact angle between the droplet and the plate must be in the region of 110º. - Remove the masking tape from the electrical contacts.
- Spin-coat amorphous fluoropolymers (Table of Materials) using a spin-coater at 1500 rpm for 30 s on top of the 4-in silicon wafer and bake it at 140 °C for 30 min.
NOTE: It is important that both the surfaces of the actuation and cover plates are hydrophobic in order to facilitate smooth movement of the discrete droplets during the assay.
3. Loading, assembly and operation of the EWOD chip on the DMF platform
NOTE: The EWOD chip operates using parallel-plate configuration with a precisely defined gap 0.5 mm between the actuation plate and the conductive, grounded cover plate. This sandwich assembly is described in the current section.
- Remove the lid from the DMF platform6 and place it onto the bench.
NOTE: A dark Faraday cage chamber, is necessary to prevent stray light and electromagnetic interference during the detection. There is no interlock on the lid, hence, the platform allows us to observe droplets' movement. - Place a clean actuation plate onto the rotating stage, chromium facing upwards. The plate needs to be aligned with the upper left corner of the recessed stage (Figure 2A).
- Clamp the actuation plate from the top using the panel with the 47 contact pins. This secures the plate into place and facilitates alignment with the contact pins.
- Lay the 0.5 mm shim and the 2 mm polymethylmethacrylate (PMMA) separator onto the rotating stage, in order to provide a controlled gap between the actuation and the cover plates.
NOTE: Optionally, wicking paper can be placed onto the waste disposal pad prior to aliquoting the droplets before the next step. As the assay proceeds, the waste is directly absorbed into the paper that can be removed at the end of the assay. - Load the droplets on to the proposed loading pads (Figure 1).
- Aliquot four 2.5-µL droplets from the Running buffer onto the B-, A-, R-, E-denoted pads, one droplet on each pad.
- Aliquot 2.5 µL of Luminol:H2O2 (1:1, v/v) solution onto the D-denoted pad.
- Aliquot 2.5 µL of Neutravidin conjugated to HRP (1 μg/mL) onto the F-denoted pad.
- Aliquot 2.5 µL of Biotinylated secondary antibody (1 μg/mL) onto the G-denoted pad.
- Aliquot 2.5 µL of Microbeads with conjugated primary antibody (2.5 mg/mL) go onto I-denoted pad.
- Aliquot 2.5 µL of the unknown sample onto C-denoted pad.
NOTE: The proposed loading pattern is only one example of an experimental layout, however, the loading pattern can be changed to match the users' needs, as long as those changes match the sequence defined in the software (Supplementary File 1).
- Place the cover plate on the surface of the rig, besides the round recess area, and slide it laterally into the recess and on top of the actuation plate (Figure 2B).
- Put the permanent magnet on top of the cover plate and secure it by sliding the two latches (Figure 2C).
- Rotate the stage by 180° and inspect visually if the loaded droplets are still in place (Figure 1C).
NOTE: One should be able to eyeball the position and the shape of droplets through the transparent stage and the back of the actuation plate (Figure 2D). The assay is ready to run if round droplets could be seen on top of the loading electrode pads. In case, a droplet is displaced one can remove the magnet and the cover plate, then recover the displaced droplet with a clean pipette and place it again on the loading pad. - Check that the loading position for each droplet matches the programmed actuation sequence in the software (see Supplementary File 1 for details on the software).
NOTE: To be able to visually check the position of the droplets, the photodetector needs to be dismounted (Figure 2D). - Position the photodetector screened "can" into the slot of the rotating stage.
NOTE: The photodetection system pivots around a photodiode, which has a large collection area (10 x 10 mm2) to maximize light collection without additional optics, plus a trans-impedance amplifier to minimize noise6. However, the system is extremely sensitive and can collect minute signals. To reduce the noise level, a number of electronics-based strategies were implemented (e.g., the photodetection system was protected by putting it in a Faraday cage, a metal casing known as a screened "can"). - Connect the cable to the photodetector screened "can".
NOTE: Once the EWOD chip is aligned with the photodetector, the DMF platform is completely assembled and is now ready to operate. - Place the lid over the DMF platform and start the program sequence using the software interface developed at the University of Hertfordshire.
NOTE: Additional software is used for reading and recording the luminescence from the droplet as a function of time in a CSV file (see Supplementary File 2).- Ensure that the programmed sequence (see Supplementary File 1) prompt messages appear at the interface to inform the operator that "The luminol droplet is ready to collect the extracted magnetic beads" or "The detection droplet is ready to be moved to the detection site." In both cases, confirmation from the operator is required to proceed with the sequence.
4. Operating in visual mode (Optional for optimization of protocols)
NOTE: If desired, in order to visualize every droplet-based operation, the assay can be operated by skipping steps 3.10-3.12 and replacing them by the following operations.
- Start the program sequence using the software interface.
NOTE: The droplet movement can be observed while operating in visual mode, which is useful during protocol optimization. Firstly, to check the reproducibility of the magnetic separation operation. For instance, if the amount of beads used is too low, the magnetic separation will not occur, vice versa, if the amount of beads is too high, the droplet may be immobilized by the bead pellet. Secondly, to ascertain the reliability of a new assay as some droplet formulation may cause actuation impairment that can be detected by observation. - Mount the photodetector screened "can" into the slit of the rotating stage, when prompted.
- Connect the cable to the photodetector screened "can", by inserting the pins in the socket.
- Place the lid over the DMF platform and resume the assay.
NOTE: Use the additional software for reading and recording the luminescence from the droplet as a function of time in a CSV file (see Supplementary File 2)
5. Removing liquid waste and cleaning the chip
CAUTION: Make sure the equipment is switched off and disconnected from power sources (computer, main) prior to cleaning. Wear gloves, a lab coat and goggles protective glass (PPE) when removing biological samples from the chip!
- To access the electrodes and the used solvents on the actuation plate, open the DMF platform lid and rotate the stage 180°.
- Unhinge the magnet casing, remove the magnet from the rotating stage and place it onto the bench.
- Remove the cover plate, silicon wafer, from the slit with a pair of tweezers, rinse it with DI water, dry it with compressed air and place it in a Petri dish, where the wafer can be stored and reused.
- Use a micropipette to move the liquid waste from the pad without touching the surface.
- Clean the surface by wicking off the liquid from the actuation plate using absorbent paper (filter material).
NOTE: Keeping the surface intact will increase the longevity of the actuation plate, that allows multiple uses. - Clean the actuation plate by sweeping gently the surface of the electrodes with a clean DI water droplet using a clean pipette. Then remove the droplet with wicking paper (filter material).
CAUTION: Dispose of the tissues, papers, pipettes tips and gloves that are contaminated with biological material into the bio-waste bin. - Use the actuation plate for a different assay or remove it from the DMF platform for storage or recycling.
Results
Actuation voltage impact was investigated in order to elucidate what the optimal conditions were to perform the assays. A droplet from the buffer was driven at various actuation voltages and its motion was recorded. The findings demonstrated (Figure 3) a correlation existed between the root mean square actuation voltage (Vrms) and the average velocity. However, the longevity of an actuation plate was reduced when high values for Vrms were used. Based on these results, 105 Vrms was chosen as the standard actuation voltage, 120 Vrms was found to work best for the H2O2/Luminol droplet and 165 Vrms was implemented for the extraction LUO. These voltages were included in the automated programming sequence (Supplementary File 1).
Two immunoassays (Figure 4) were tested successfully using the EWOD chip with the DMF platform for four different pathogens (Table 1). The EWOD chip facilitated the consecutive movement of the droplets from the loading pads to the mixing region and finally to the waste. There were two basic LUOs that were repeated throughout the protocol to complete ELISA. The first was the extraction LUO; briefly described here, the droplet containing the suspended beads was driven to the separation site in the middle of the mixing zone, the magnet was activated automatically to approach the chip and to pool the magnetic beads into a pellet (Figure 5). Next, the droplet was moved towards the waste pad, leaving the beads onto the actuation plate, thus concluding the extraction LUO. Mixing was the next key LUO to take place on the EWOD chip. The analyte sample with an unknown concentration of pathogens was moved onto the beads by electrowetting. Then the beads were resuspended by moving the droplet with the clumped beads over the mixing area (10 pads in total). These two LUOs were essential as they facilitated a miniaturized, rapid and reproducible sample processing with consecutive detection of the pathogens in 6 to 10 min. Figure 6 shows the complete sequence of LUOs from an immunoassay accomplished with the EWOD chip.
To meet the desired levels of automation, variations in the protocol could be introduced. For instance, the beads were separated from the antigen depleted droplet, which was then transferred to the waste pad, repeating the basic extraction LUO. At this stage, the protocol could branch depending on whether the detection antibody was conjugated to the HRP already, effectively using eight LUOs in total for the detection of the different antigens (Figure 7A-C). In these cases, the droplet with the detection antibody was brought to the beads and then mixed by actuation. Alternatively, binding the detection antibody to the Neutravidin-HRP conjugate could be performed sequentially in situ on the EWOD chip, as it was demonstrated for the quantification of E. coli (Figure 7D). Both protocols, the eight- and ten-step ELISA (Figure 4), yielded reproducible detection of antigens.
Incubation times and conjugate concentrations were varied to find experimentally the optimum conditions for the assay (Figure 7A). It was found that the incubation time of 160 s and conjugate concentration of 2 μg/mL achieved the best signal to noise ratio with a 36% increase of signal strength and virtually no change in the background noise levels. All of the figures and data used in the representative results section were modified from an earlier work6.
| Primary / Capture antibody | Detection antibody | Antigen |
| Anti-Human Serum Albumin [15C7] (anti-HSA, Abcam ab10241) | Horse Radish Peroxidase (HRP) tagged anti-HSA [1A9] (Abcam ab24438) | Human Serum Albumin (HSA, Abcam) |
| Rb anti-BG polyclonal | Biotinylated Rb anti-BG polyclonal | B. globigii (BG) spores |
| Rb anti-E.coli MRE 162 polyclonal | Biotinylated Rb anti-E.coli 162 MRE polyclonal | E. coli MRE 162 |
| Goat anti-MS2 polyclonal | Biotinylated Rb anti-MS2 polyclonal | MS2 bacteriophage virus |
Table 1: Antigens and antibodies tested with this protocol. Four types of pathogen antigens were used to demonstrate the capabilities of the EWOD chip with the DMF platform.

Figure 1: Design of the EWOD plate. (a) Schematic notation of the EWOD actuation plate with connectors (squares, Top) that are linked (lines) to the electrodes (squares, Bottom). Each pad is assigned a number and can be addressed from the software code (Supplementary File 1). The loading electrode pads are marked by arrows and denoted by a capital letter above or below each pad. A key feature for the DMF platform is the mixing zone comprised of ten pads (No. 31, 32, 33, 36, 37, 42, 43, 44, 46, 47). As a visual guide, the mixing zone is marked with a red rectangle. (b) Micrograph of the pads' microgrid design. Please click here to view a larger version of this figure.

Figure 2: Components and key stages for the digital microfluidic system (DMF) assembly. (A) Fix the EWOD actuation plate, place the shim onto the rotating stage and load the droplets. (B) Position the cover plate. (C) Mount the magnet case, fasten the latches and rotate the stage 180°. (D) The automated magnet is pointing downwards. Inspect the position and shape of the droplets, check that the printed circuit board (PCB) pins are aligned with the contacts on the EWOD chip, connect the photodetector and place it into the photodetector slot. After connecting the control electronics to a computer, the system is ready to run the assay. Please click here to view a larger version of this figure.
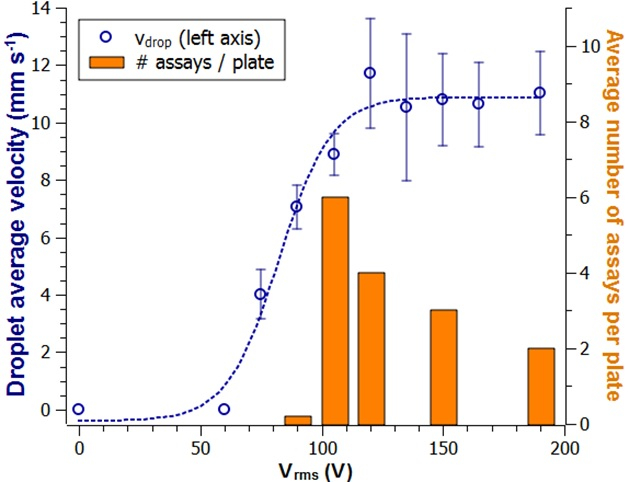
Figure 3: Repetitive usage of the actuation plates and the impact on actuation voltage. The average velocity of a droplet from the running buffer is plotted as a function of the actuation voltage (blue circles) and the standard deviation from three independent measurements (N = 3). Here the number of assays per plate (grey bars) indicates enhanced decay of the surface at higher voltages. Please click here to view a larger version of this figure.

Figure 4: Diagram of the immunoassays tested with EWOD. Each circle in this diagram represents a volume of 2.5 μL loaded onto the EWOD chip. The first protocol (on the left-hand side) shows eight LUOs using premixed antibody-HRP conjugate; whilst, the second protocol encompasses ten LUOs, separately adding of the biotinylated detection antibody, bead extraction and consecutive binding of Neutravidin-HRP conjugate. Please click here to view a larger version of this figure.

Figure 5: Magnetic bead extraction. This process is broken down into (a-c) actuating the droplet with the suspended magnetic beads to the magnetic separation site in the middle of the mixing zone (pad No. 33), (d, e) the magnet is moving into position focusing the beads, (f, g, h) beads are held in place by the magnetic force while the droplet is actuated away by EWOD towards the waste pad (pad No. 41). Please click here to view a larger version of this figure.

Figure 6: Complete immunoassay sequence using EWOD, showing the reagents, sample loading and laboratory unit operations. Each row contains a sequence of sample images from the characteristic operations on a droplet. The operations are divided into columns. Mixing is not performed for the beads in suspension, presented by a black broken line. Droplet directions are indicated by blue arrows, the beads are highlighted in one of the images by an orange arrow. The grey box (bottom right corner) separates the two images that represent movement and position in the detection area, the broken-line circle highlights the detection area. Please click here to view a larger version of this figure.

Figure 7: Calibration curves from immunoassays conducted on EWOD chip with the DMF platform. As previously reported6 the output voltages (mV) versus concentrations are shown for: (A) Human serum albumin, which is used to study the effect of the conjugate antibody concentration [C] and the incubation time, tinc, measured from the mixing of the beads with known analyte until the extraction LUO, (B) B. atrophaeus (BG) spores showing the reproducibility of the immunoassay, (C) MS2 bacteriophage immunoassay, and (D) ten-LUOs protocol results for E. coli. Abbreviations: colony forming units (cfu), plaque-forming units (pfu), number of independent experiments (N), laboratory unit operation (LUO). Figure modified from previous publication6. Please click here to view a larger version of this figure.
Supplementary File 1: Complete sequence to run the DMF platform for automated ELISA assay with Neutravidin-HRP as conjugate. Please click here to download this file.
Supplementary File 2: The GUI for the chemiluminescence measurement and an example from a measurement with the software are shown. Please click here to download this file.
Discussion
The EWOD immunoassay protocol is flexible and can include a various number of laboratory unit operations (e.g., capture antigen, mixing, incubation, bead extraction, washing) depending on the reagent type, stability and usage requirements defined by the assay protocol. As a proof of principle, in the current article, two immunoassay protocols are considered showing the implementation of eight or ten LUOs (Figure 4) with the EWOD chip described. Such miniaturization merits from the microliter, discrete volumes of reagents/analyte that increase the efficacy of the ELISA by reducing both the consumption of reagents, the time required per operation, essentially, the total experimental time (6 to 10 min). Furthermore, the assay is automated with timed manipulation of the droplets which decreases variations and improves the precision of the immunoassay17. In its present format, the experiment involves manual handling of droplets at the beginning of each assay, which is a point for further discussion in the next section.
One critical step in the current DMF method is dispensing the droplets onto the surface of the EWOD chip. Typically, a micropipette with a disposable tip is used to measure the exact volume and to load it. However, it can become challenging to immobilize the droplet on the hydrophobic surface of the actuation plate because of interactions between the droplet and the charged surface of the disposable tip. As a result, the droplet can shoot up following the outer surface of the tip instead of remaining onto the plate. To avoid this, the micropipette must be held in an upright position, perpendicular to the chip surface, without touching it, then the droplet can be dispensed on to the loading pad by bringing it in contact with the surface. Should the droplet stick to the pipette tip, return it to the stock solution, exchange the tip and redeposit a fresh droplet. In a further development of the current proof-of-concept system, automatic delivery of droplet can be envisaged.
Another critical step, before running the assay, is closing the lid of the parallel plate assembly. As stated earlier in the protocol, the lid must be slid on top of the actuation plate. The hydrophobic surface of the lid prevents the distortion and displacement of the droplets sitting on the actuation plate. To guarantee the smooth movement of the droplet, it is highly recommended to use pristine actuation plate, correct loading of the droplets and chip assembly. Reusability of the actuation plates is possible; however, the number of cycles depends on the actuation voltages (Figure 3) and the analyte/reagent deposition onto the surface, aka biofouling. The presented platform utilized chrome printed EWOD chip, which could be reused reliably for consecutive measurements up to four times at operating voltage of 120 V and intermediate plate cleaning after each experiment. Plates were recycled, to reduce the cost per experiment, by decontaminating (brushing the surface with undiluted cleaning agent before thoroughly rinsing) the biofouled amorphous fluoropolymers (Table of Materials) coating and spin-coating a fresh one on top of the plate. However, actuation plate recycling requires manual handling, costly reagents (amorphous fluoropolymers (Table of Materials)) and specialized equipment (spin-coater). Alternative EWOD chips are investigated successfully with cost-efficient substrates such as paper19, acetate films or printed circuit boards (PCBs)20,21. Such disposable consumables can facilitate reliable and affordable use of the DMF platform and can provide means to sidestep the biofouling issue.
Biofouling is the main limitation of EWOD for biological applications22,23. Earlier studies on DMF have identified two mechanisms that contribute to biofouling, namely, passive adsorption due to hydrophobic interactions, and an electrostatically driven adsorption manifesting when an electric field is applied24. The findings in the current article are consistent with this theory as it was documented the actuation plate reusability decreases at high actuation voltages. One possible explanation is that proteins adsorb readily on Fluoropolymer-coated (Teflon-like) surfaces and they aggregate faster on fouled in comparison to pristine surfaces24. As a consequence, protein-related assays on DMF are hard to quantify and may experience loss of analyte, cross-contamination and diminished precision17. The worst-case scenario is when a critical amount of protein adsorbs thus rendering the device useless. To minimize the biofouling, various approaches have been investigated from minimizing the residence time of the droplet on the chip, through coatings23, to additives (i.e., surfactants or pluronic acid) into the biomaterial-laden droplets6,22. Hence an important aspect of the immunoassay assay on EWOD is to choose anti-biofouling strategies that are compatible with the specific protocol at hand.
The automated DMF platform is designed to perform a single sandwich ELISA test per run while using microliter volumes for both reagents and analyte. When it is required, conventional sandwich ELISA kits exist based on pre-coated 96-well or 384-well plates that in combination with auxiliary laboratory equipment result in higher throughput per run; based on reagents price only, the approximate cost per assay/well is 6.04 USD (580 USD/96) and 0.33 USD (2×580 USD/384) respectively. This renders the conventional ELISA methods ideal for a large number of samples processed typically by trained technical personnel at centralized laboratory facilities. However, in remote locations, the detailed cost analysis of ELISA for environmental monitoring showed that when capital costs (i.e., laboratory operating costs, recurrent costs, sample transportation, supplies and personnel) were included the actual price per ELISA was 60 USD of which 34 USD were for supplies per sample25. In contrast, the proposed DMF platform is portable, requires minimum training to operate and with pre-coated beads can provide sample-to-answer analysis in minutes. Hence, the presented technology can be deployed to point-of-need locations and complement analyses otherwise available in centralized laboratories.
In the representative results section, the automated DMF immunoassay platform was used for direct detection of pathogens for defense application. Other possible applications for the DMF platform encompass but are not limited to, biodiagnostic, continuous monitoring and automated sampling. Potentially the DMF could impact diverse sectors from point-of-care for personalized healthcare, as well as controlled environment monitoring for the protection of patients from airborne Hospital Acquired Infection, to crop monitoring system for farming and food production.
Disclosures
The authors have nothing to disclose.
Acknowledgements
We would like to acknowledge the contribution of our colleagues from the Microfluidic & Microengineering Research Group for their work on the mechanical design and system integration. The authors would like to thank Dstl Porton Down for their invaluable support and financial contribution, to past and ongoing projects that further develop the DMF technology and its applications.
Materials
| Name | Company | Catalog Number | Comments |
|---|---|---|---|
| (4-(2-Hydroxyethyl)piperazine-1-ethanesulfonic acid, HEPES | Sigma-Aldrich | H9897 | |
| Anti-Human Serum Albumin [15C7] | Abcam | ab10241 | |
| Anti-Human Serum Albumin [1A9] (HRP) | Abcam | ab24438 | |
| B. atrophaeus (BG) spores | Dstl, UK | N/a | |
| Biotinylated Rb anti-BG polyclonal | Dstl, UK | N/a | |
| Biotinylated Rb anti-E. coli MRE 162 polyclonal | Dstl, UK | N/a | |
| Biotinylated Rb anti-MS2 polyclonal | Dstl, UK | N/a | |
| Blocker Casein | Thermo Scientific | TFS 37582 | |
| CNC Dicing/Cutting Saw | MTI Corp, USA | SYJ-400 | |
| Cytop | AGC, Japan | CTL-809M | Amorphous fluoropolymers. This is a two component coating. |
| E. coli MRE 162 | Dstl, UK | N/a | |
| Goat anti-MS2 polyclonal | Dstl, UK | N/a | |
| Hamamatsu photodiode | Hamamatsu, Japan | S9270 | |
| Hidrochloric acid (32%) | Sigma-Aldrich | W530574 | |
| Mask manufacturing service | Compugraphics, Scotland, UK | N/a | |
| MS2 virus | Dstl, UK | N/a | |
| Parylene-C, DPX-C | Specialty Coating System, USA | CAS No.: 28804-46-8 | |
| Pierce Direct Magnetic IP/Co-IP Kit | Thermo Scientific | 88828 | Contains all buffers and reagents required for enzyme immobilisation. Store at 4 °C. |
| Rb anti-BG polyclonal | Dstl, UK | N/a | |
| Rb anti-E. coli MRE 162 polyclonal | Dstl, UK | N/a | |
| Recombinant Human Serum Albumin protein, HAS | Abcam | ab201876 | |
| SCS Parylene Deposition System | Specialty Coating System, USA | 2010 | |
| Silicon wafer, 4'', p-type, <100>, 1–10 Ωcm | Pi Kem Ltd | N/a | |
| Spin Coater | SÜSS MicroTec AG, Germany | ||
| SuperSignal ELISA Femto Maximum Sensitivity Substrate | Thermo Scientific | 37075 | It contains 50 mL of Luminol/ Enhancer and Stable Peroxide solutions. Store at 4 °C. |
| Tween 80 | Thermo Scientific | 28328 | The manifacturer is Surfact-Amps Detergent Solution. |
References
- Kokalj, T., Pérez-Ruiz, E., Lammertyn, J. Building bio-assays with magnetic particles on a digital microfluidic platform. New Biotechnology. 32 (5), 485-503 (2015).
- Sista, R., et al. Development of a digital microfluidic platform for point of care testing. Lab on a Chip. 8 (12), 2091-2104 (2008).
- Starodubov, D., et al. Compact USB-powered mobile ELISA-based pathogen detection: design and implementation challenges. Advanced Environmental, Chemical, and Biological Sensing Technologies VIII. 8024, 80240(2011).
- Delattre, C., et al. Macro to microfluidics system for biological environmental monitoring. Biosensors and Bioelectronics. 36 (1), 230-235 (2012).
- Gooding, J. J. Biosensor technology for detecting biological warfare agents: Recent progress and future trends. Analytica Chimica Acta. 559 (2), 137-151 (2006).
- Coudron, L., et al. Fully integrated digital microfluidics platform for automated immunoassay; A versatile tool for rapid, specific detection of a wide range of pathogens. Biosensors and Bioelectronics. 128, 52-60 (2019).
- Hua, Z., et al. Multiplexed Real-Time Polymerase Chain Reaction on a Digital Microfluidic Platform. Analytical Chemistry. 82 (6), 2310-2316 (2010).
- Zou, F., et al. real-time chemiluminescent detection of DNA mutation based on digital microfluidics and pyrosequencing. Biosensors and Bioelectronics. 126, 551-557 (2019).
- Ng, A. H. C., Choi, K., Luoma, R. P., Robinson, J. M., Wheeler, A. R. Digital microfluidic magnetic separation for particle-based immunoassays. Analytical Chemistry. 84 (20), 8805-8812 (2012).
- Vergauwe, N., et al. A versatile electrowetting-based digital microfluidic platform for quantitative homogeneous and heterogeneous bio-assays. Journal of Micromechanics and Microengineering. 21 (5), (2011).
- Choi, K., et al. Automated digital microfluidic platform for magnetic-particle-based immunoassays with optimization by design of experiments. Analytical Chemistry. 85 (20), 9638-9646 (2013).
- Zhao, Y., Cho, S. K. Microparticle sampling by electrowetting-actuated droplet sweeping. Lab on a Chip. 6 (1), 137-144 (2006).
- Jonsson-Niedziołka, M., et al. EWOD driven cleaning of bioparticles on hydrophobic and superhydrophobic surfaces. Lab on a Chip. 11 (3), 490-496 (2011).
- Foat, T. G., et al. A prototype personal aerosol sampler based on electrostatic precipitation and electrowetting-on-dielectric actuation of droplets. Journal of Aerosol Science. 95, 43-53 (2016).
- Seale, B., et al. Digital Microfluidics for Immunoprecipitation. Analytical Chemistry. 88 (20), 10223-10230 (2016).
- Ng, A. H. C., et al. A digital microfluidic system for serological immunoassays in remote settings. Science Translational Medicine. 10 (438), 6076-6088 (2018).
- Wild, D., Davies, C. Immunoassay fundamentals. The Immunoassay Handbook: Theory and Applications of Ligand Binding, ELISA and Related Techniques. , 1-26 (2013).
- Gorham, W. F. A New, General Synthetic Method for the Preparation of Linear Poly-p-xylylenes. Journal of Polymer Science Part A-1: Polymer Chemistry. 4 (12), 3027-3039 (1966).
- Soum, V., et al. Affordable fabrication of conductive electrodes and dielectric films for a paper-based digital microfluidic chip. Micromachines. 10 (2), (2019).
- Abdelgawad, M., Wheeler, A. R. Low-cost, rapid-prototyping of digital microfluidics devices. Microfluidics and Nanofluidics. 4 (4), 349-355 (2008).
- Jain, V., Devarasetty, V., Patrikar, R. Study of Two-Dimensional Open EWOD System using Printed Circuit Board Technology. Global Journal of Researches in Engineering: Electrical and Electronics Engineering. 17 (6), (2017).
- Luk, V. N., Mo, G. C. H., Wheeler, A. R. Pluronic additives: A solution to sticky problems in digital microfluidics. Langmuir. 24 (12), 6382-6389 (2008).
- Latip, E. N. A., et al. Protein droplet actuation on superhydrophobic surfaces: A new approach toward anti-biofouling electrowetting systems. RSC Advances. 7 (78), 49633-49648 (2017).
- Yoon, J. Y., Garrell, R. L. Preventing biomolecular adsorption in electrowetting-based biofluidic chips. Analytical Chemistry. 75 (19), 5097-5102 (2003).
- Dalvie, M. A., et al. Cost analysis of ELISA, solid-phase extraction, and solid-phase microextraction for the monitoring of pesticides in water. Environmental Research. 98 (1), 143-150 (2005).
Reprints and Permissions
