This protocol provides a method to study Mycobacterium tuberculosis infection in human M1- or M2-polarized macrophages based on differentiation of peripheral-blood-monocytes to macrophage-like cells that are infected with the GFP-labeled virulent strain H37Rv, and analyzed with flow cytometry using a 10-color panel including expression of selected M1/M2 markers.
Method Article
Polarization of M1 and M2 Human Monocyte-Derived Cells and Analysis with Flow Cytometry upon Mycobacterium tuberculosis Infection
In This Article
Erratum Notice
Important: There has been an erratum issued for this article. View Erratum Notice
Summary
Abstract
Human macrophages are primary host cells of intracellular Mycobacterium tuberculosis (Mtb) infection and thus have a central role in immune control of tuberculosis (TB). We have established an experimental protocol to follow immune polarization of myeloid-derived cells into M1 (classically activated) or M2 (alternatively activated) macrophage-like cells through assessment with a 10-color flow cytometry panel that allows visualization and deep-characterization of green-fluorescent-protein (GFP)-labeled Mtb in diverse macrophages subsets. Monocytes obtained from healthy blood donors were polarized into M1 or M2 cells using differentiation with granulocyte macrophage-colony-stimulating factor (GM-CSF) or macrophage-colony stimulating factor (M-CSF) followed by polarization with IFN-γ and lipopolysaccharide (LPS) or IL-4, respectively. Fully polarized M1 and M2 cells were infected with Mtb-GFP for 4 hours before detached Mtb-infected macrophages were stained with flow cytometry at 4- or 24-hours post-infection. Sample acquisition was performed with flow cytometry and the data was analyzed using a flow cytometry analysis software. Manual gating as well as dimensionality reduction with Uniform Manifold Approximation and Projection (UMAP) and phenograph analysis was performed. This protocol resulted in effective M1/M2 polarization characterized by elevated levels of CD64, CD86, TLR2, HLA-DR and CCR7 on uninfected M1 cells, while uninfected M2 cells exhibited a strong up-regulation of the M2 phenotype markers CD163, CD200R, CD206 and CD80. M1-polarized cells typically contained fewer bacteria compared to M2-polarized cells. Several M1/M2 markers were downregulated after Mtb infection, which suggests that Mtb can modulate macrophage polarization. In addition, 24 different cell clusters of different sizes were found to be uniquely distributed among the M1 and M2 uninfected and Mtb-infected cells at 24-hours post-infection. This M1/M2 flow cytometry protocol could be used as a backbone in Mtb-macrophage research and be adopted for special needs in different areas of research.
Introduction
Macrophages are immune cells that contribute significantly to the regulation of tissue homeostasis, inflammation, and disease pathologies. Being an essential component of innate immunity, the monocyte-macrophage lineage of cells expresses heterogeneous phenotypes in response to altered environmental cues, which reflect their plasticity and adaptation to different anatomical and immunological locations1. Depending on the growth factors, cytokines and other mediators present in the microenvironment, macrophages have been categorized into two major reversible populations, each with a different role in bacterial control and clearance2: the pro-inflammatory, classically activated M1-polarized macrophages and the anti-inflammatory, alternatively activated M2-polarized macrophages that were originally named to mimic T helper (Th) cell nomenclature3. This grouping of immune polarized macrophages is often considered simplistic, as macrophage activation and differentiation is not linear, but more accurately illustrated as a continuum where each population has different characteristics and functional roles in the outcome of disease development and progression4,5,6,7. Nevertheless, there are numerous experimental advantages with the M1/M2 macrophage model that can be used in several different fields of research.
Mycobacterium tuberculosis (Mtb) is the causative agent of tuberculosis (TB) and has been estimated to infect one person every second and is considered the most lethal single infectious agent in the world (Global TB report 2019). Since the respiratory tract is the main route of Mtb infection, alveolar macrophages are the preferred host cells to be infected with Mtb and represent both the primary barriers and the infectious reservoir for Mtb in the lungs. Macrophage polarization in response to different stimuli has been extensively studied over the years7 and in most of the published work, M1 polarization of monocyte cultures in vitro is induced by Granulocyte-Macrophage Colony Stimulating Factor (GM-CSF) together with IFN-γ and LPS8,9, while M2 polarization is induced with Macrophage Colony Stimulating Factor (M-CSF) and IL-410,11. The M1 macrophages are potent effector cells that mediate antimicrobial responses against intracellular pathogens and have an essential role in antitumor immunity12. M2 macrophages, on the other hand, have an anti-inflammatory function, high phagocytic capacity and are mainly involved in wound healing and tissue repair as well as in parasite infections12. Accordingly, M1 macrophages are viewed as more effective in intracellular control of Mtb compared to M2 macrophages13. However, Mtb bacteria also have the potential to modulate macrophage polarization to subvert innate immunity14,15,16,17.
While it is common to generate macrophages from differentiation of monocytes obtained from peripheral blood18, macrophages could also be generated from induced pluripotent stem cells (iPSCs)19 or from bone marrow-derived macrophages from mice20,21. These are feasible techniques to study primary macrophage cells obtained from monocyte/macrophage progenitors that will proliferate and differentiate into a homogenous population of mature macrophage-like cells. However, these protocols rarely provide deepened knowledge on the phenotype and function of the cells obtained nor account for the natural heterogeneity observed among macrophages obtained in vivo. As Mtb is a strict human pathogen, there is also an advantage to study Mtb in humanized model systems. Flow cytometry is a powerful technology that offers the possibility to assess multiple phenotypic and functional characteristics of single cells in suspension22, something that could be fairly challenging with adherent cells such as macrophages that are also known to be autofluorescent23,24. In addition to chemical detachment of firmly adherent macrophages, Mtb infection may pose a significant stress factor to the cells that adds another level of complexity in flow cytometric analyses of Mtb-infected macrophages.
In this experimental protocol, we have used a previously established human macrophage infection model based on immune polarization of primary peripheral-blood-monocyte-derived cells that are infected with the virulent laboratory Mtb strain H37Rv, and analysed with flow cytometry using a 10-color panel including expression of selected M1 and M2 markers25. This protocol provides an efficient and reproducible method to study responses to Mtb infection in M1 or M2 polarized monocyte-derived macrophages. In addition, the use of flow cytometry on adherent Mtb-infected macrophages allows us to study a variety of surface markers associated with conventional M1 and M2 macrophages and their longitudinal response to Mtb infection. Importantly, this protocol can easily be adopted for investigations of infections with other pathogens, in anti-tumor studies or in studies of inflammatory conditions, for drug screening etc. and could also be exploited for assessment of M1/M2 macrophage polarization in human clinical samples.
Protocol
Human peripheral blood from healthy anonymous blood donors was obtained from the blood bank at Karolinska University Hospital, Huddinge, Sweden (ethical approval Dnr 2010/603-31/4). All experimental steps involving live virulent Mtb were performed at the Biosafety Level-3 (BSL-3) laboratory at the Public Health Agency of Sweden (FOHM), Solna, Sweden.
1. Preparation of media, buffers, and bacterial cultures
NOTE: Details about all the reagents and consumables are provided in the Table of Materials.
- RPMI complete medium: Supplement RPMI 1640 with 1 mM sodium pyruvate, 2 mM L-glutamine, 10 mM HEPES, and 10% heat-inactivated fetal bovine serum (FBS). Avoid antibiotics in the cell culture medium when working with Mtb infection.
- Serum-free RPMI medium: Supplement RPMI 1640 with 1 mM sodium pyruvate, 2 mM L-glutamine and 10 mM HEPES.
- Wash buffer: Prepare phosphate buffer saline (PBS) containing 0.05% (v/v) Tween-80.
- FACS buffer: Prepare PBS containing 2.5% (v/v) FBS and 0.5 mM EDTA.
- Fixation buffer: Prepare PBS containing 4% formaldehyde to PBS. Ensure it is freshly prepared before use, e.g., mixed from a stock solution of 37% formaldehyde.
- Permeabilization buffer: Add 0.1% sodium citrate and 0.1% Triton X-100 to deionized water.
- Wash buffer (for immunofluorescence): Prepare PBS containing 0.1% BSA and 0.1% Tween-20.
- Blocking buffer: Prepare PBS containing 0.1% BSA and 10% normal goat serum (NGS) to PBS.
- Staining buffer (for immunofluorescence): Prepare PBS containing 0.1% BSA to PBS.
- TB complete medium: Supplement Middle Brook 7H9 broth with 0.05% (v/v) Tween-80, 0.5% (v/v) glycerol, kanamycin (20 µg/mL), 10% (v/v) Middlebrook oleic acid, albumin, dextrose and catalase enrichment (Middlebrook OADC Enrichment).
- Bacterial cultures: Use the standard virulent Mtb laboratory strain, H37Rv, constitutively expressing green fluorescent protein (GFP), for infection of monocyte-derived cells. This Mtb strain carries a pFPV2 plasmid that contains a gene encoding GFP, as well as a gene for kanamycin resistance. The antibiotic resistance enables continuous selection of plasmid-expressing bacteria in cultures containing kanamycin. Store bacteria in TB complete medium and 70% glycerol (1:1 dilution) at -80 °C.
2. Peripheral blood mononuclear cell isolation from buffy coats
NOTE: Perform all work with human blood (potentially contagious) inside a class II biosafety cabinet. Inactivate residual blood products with disinfectants for 15 min before discarding. Blood was obtained from healthy volunteers in this case. This in vitro macrophage differentiation protocol was set up to include 10 x 106 isolated PBMCs/donor/well. From each donor, one buffy coat contains about 50 mL of a concentrated leukocyte suspension originating from whole blood, which normally provides 500–800 x 106 PBMCs from which approximately 10% or 50–80 x 106 monocytes can be retrieved.
- Load 15 mL of buffy coat blood on top of 15 mL of density gradient medium prepared in 50 mL tube. Slowly overlay blood on top of the density gradient layer by leaning the pipette tip to the wall of the tube.
- Spin the tubes at 600 x g for 25 min at room temp (RT) with 0 acceleration and 0 deceleration.
NOTE: Close lids carefully before centrifugation and always check the tube holders for potential spill over after centrifugation. - Remove the top plasma layer with a sterile Pasteur pipette and thereafter carefully collect the mononuclear cell layer into a new 50 mL tube using a sterile Pasteur pipette. Add serum-free RPMI medium to the PBMC pellet to obtain a final volume of 50 mL. Mix carefully by inverting the tube a few times before centrifugation at 500 x g for 5 min at RT.
- Discard the supernatant carefully and resuspend the cell pellet by flipping the bottom of the tube within the fingers.
- To remove the density gradient medium contamination from the PBMCs, wash cells 2–3 times with serum-free RPMI to obtain a final volume of 50 mL. Centrifuge at 500 x g for 5 min at RT. Wash until the cell supernatant becomes transparent.
- Discard the supernatant and resuspend the cells in 20 mL of serum-free RPMI medium.
- Count the cells by trypan blue staining, manually using a hemocytometer or using an automated cell counter. Dilute the cell suspension in trypan blue in 1:2 or 1:10 dilution by mixing the cell-trypan blue sample in a 96 well plate e.g., 50 µL + 50 µL (for hemocytometer counting) or 10 µL + 10 µL (for automated cell counting) and count the cells to obtain the number of live cells/mL.
CAUTION: Trypan blue is toxic and must be discarded in a separate chemical waste.
3. Differentiation and polarization of monocyte-derived cells
NOTE: For differentiation and polarization of monocyte-derived cells, a protocol that we previously established for M0, M1-like and M2-like cells as well as fully M1 and M2 polarized cells was followed25. For simplicity, only fully polarized M1 and M2 macrophages are described here.
- Use plastic adherence for isolation of monocytes. Briefly, seed freshly isolated PBMCs in a 6-well culture plate at an appropriate concentration, e.g., 10 x 106 PBMCs/well in 2 mL serum-free RPMI medium and incubate at 37 °C and 5% CO2.
- After 2–3 h, remove the non-adherent cells with a pipette and wash the wells 3 times with 1 mL serum-free medium. The attached cells are monocytes and comprises around 10% of the total PBMCs added to the well, i.e., 106 monocytes retrieved from 10 x 106 PBMCs added per well.
- For macrophage differentiation, prepare a working solution containing 50 ng/mL GM-CSF or M-CSF for M1 and M2 macrophage polarization respectively, added in 2 mL of RPMI complete medium per well. Culture the cells in a 5% CO2 incubator in 37 °C for 3 days.
- On the day 3, remove 1 mL of the cell culture medium carefully from the top layer of each well and supplement the cell cultures with 1 mL of fresh RPMI complete medium containing the double concentration of M-CSF or GM-CSF to obtain 50 ng/mL final concentration in the wells. Add the growth factors in a pre-made working solution of 100 ng/mL/well.
- On the day 6, add different stimuli for the last 18–20 h of cell differentiation to obtain fully polarized and mature M1 (interferon-γ; IFN-γ, and lipopolysaccharide; LPS (E. coli O55:B5)) or M2 (interleukin 4; IL-4) macrophages. For M1 polarization, prepare IFN-γ and LPS in RPMI complete medium and add 50 µL per well to obtain a final concentration of 50 ng/mL IFN-γ and 10 ng/mL LPS in the cell cultures. For M2 polarization, prepare IL-4 in RPMI complete medium and add 50 µL per well to obtain a final concentration of 20 ng/mL in the cell cultures.
- For differentiation of M0 polarized macrophages, stimulate the cells with M-CSF only, without any additional cytokines (providing an M2-like phenotype)25.
- Check the morphology of monocyte-derived cell cultures regularly with light microscopy to ensure that smaller monocytes are differentiated into larger macrophage-like cells. Also, monitor potential morphological differences between the M1 and M2 polarization, i.e., elongated and stretched M1 cells compared to M2 cells with a more rounded shape25.
- On the day 7, transfer the plates with monocyte-derived cells to a BSL-3 laboratory for infection with virulent Mtb.
4. Preparation of Mtb cultures
NOTE: The following steps must be performed in a BSL-3 facility. For all work with virulent Mtb, use protective clothing, respiratory protection, and ethanol resistant gloves.
- Thaw a vial with 1 mL of bacterial aliquot and mix with 9 mL of TB complete medium (1:10 dilution) in a 50 mL filtered cap tube. Culture the suspension in an incubator at 37 °C and 5% CO2.
- After 24 h, spin the bacterial suspension at 2,300 x g for 10 min and carefully pour off the medium. Resuspend the bacterial pellet with 15–20 mL of fresh TB complete medium in a new 50 mL filtered cap culture tube and incubate at 37 °C and 5% CO2. Mix the settled-down bacteria in the tube every 2–3 days to maintain a homogenous nutrient supply for all bacterial cells.
- After 7–10 days, mix the bacterial suspension properly by pipetting up and down before transferring to a 50 mL screw cap tube.
- Add 35–40 mL of sterile wash buffer to the 50 mL tube and spin the bacterial suspension at 2,300 x g for 10 min. Repeat the washing steps once. Resuspend the bacterial pellet in 1 mL of serum-free RPMI medium by pipetting with a micropipette.
- Add another 9 mL of serum-free RPMI medium and sonicate the bacterial suspension inside a class II biosafety cabinet for 5 min at 37 °C, to disrupt the bacterial clumps. Dip the tube repeatedly (3–4 times) in the water bath sonicator to ensure maximum disruption of bacterial clumps. Measure the optical density (OD) of 1 mL of bacterial suspension at 600 nm wavelength using a spectrophotometer placed inside the biosafety cabinet. Use serum-free RPMI medium to set the reference.
- Calculate the number of colony forming units (CFU) using the formula: (OD+0.155)/0.161 = Y, and Y x 107= Y x 106 CFU/mL, e.g., an OD value 0.32 provides a bacterial concentration of (0.32 + 0.155)/0.161 = 2.95, 2.95 x 107= 29.5 x 10⁶ CFU/mL.
5. Mtb infection of monocyte-derived cells
NOTE: The following steps must be performed in a BSL-3 facility.
- Resuspend the bacterial pellet in serum-free RPMI medium in a new sterile 50 mL tube and adjust the final bacterial concentration to approximately 5 x 10⁶ CFU/mL.
- Remove the cell culture medium from the 6 well plate(s) containing monocyte-derived cells. Add 1 mL of serum-free RPMI medium to each well. Add 1 mL of bacterial suspension per well to obtain a multiplicity of infection (MOI) 5:1, i.e., 5 x 10⁶ CFU per 106 macrophages in 2 mL/well and incubate the plates for 4 h in 37 °C and 5% CO2.
- After infection, wash the cells 3 times with 1 mL of sterile wash buffer to remove extracellular bacteria. Tilt the plate and carefully remove the entire wash buffer from the corners. Resuspend the Mtb-infected monocyte-derived cells in 2 mL of RPMI complete medium without antibiotics and proceed to flow cytometry staining or incubate the cells for another 24 h (or other time-points) before flow cytometry.
6. Flow cytometry staining of Mtb-infected monocyte-derived cells
NOTE: The following steps must be performed in a BSL-3 facility. The flow cytometry staining could be performed in a 96-well plate instead of tubes.
- Detach the Mtb-infected cells (and uninfected controls) from the wells in the 6 well plate(s) by incubation with 1 mL of FACS buffer per well for at least 30 min at 37 °C and 5% CO2.
- Gently pipette up and down a few times to ensure that the cells are detached. If possible, confirm cell detachment with microscopy. Transfer the cell suspension from each well to a screw capped microcentrifuge tube and spin the tubes at 200 x g for 5 min. Discard the supernatant carefully by pipetting.
- Wash the cell pellet in each tube twice with FACS buffer and spin the cells at 200 x g for 5 min.
- Stain the cells (about 0.5 x 10⁶ to 1 x 10⁶ cells/tube) with approximately 50 µL cocktail of fluorochrome-conjugated anti-human antibodies including TLR2 (AF647), CD206 (APC-Cy7), CD163 (BV605), CD80 (BV650), CCR7 (BV711), CD86 (BV786), CD200R (PE), CD64 (PE-Dazzle 594), HLA-DR (PE-Cy5) (Table 1) in combination with viability dye Zombie-UV for 30 min at 4 °C (refrigerator) in the dark.
- Wash the stained cells twice with 400 µL of FACS buffer and spin the cells at 200 x g for 5 min.
- Fix the stained cells with 200 µL of fixation buffer (freshly prepared) for 30 min at RT in the dark to ensure complete inactivation of mycobacteria.
- Wash the cells twice with 400 µL of FACS buffer and spin at 200 x g for 5 min to remove excess fix buffer.
- Resuspend the fixed cells in 400 µL of FACS buffer and transfer the samples into new 1 mL microcentrifuge tubes before taking them out of the BSL-3 laboratory for flow cytometry in BSL-2. Store the stained cells in +4 ˚C until sample acquisition.
NOTE: Spray the tubes with 70% ethanol before taking them out of the BSL-3 laboratory. Formaldehyde is toxic (carcinogenic) and must be handled in a class II biosafety cabinet. Discard formaldehyde waste in a separate chemical waste.
7. Flow cytometric data acquisition and analysis of Mtb-infected monocyte-derived cells
NOTE: Steps 7.1–7.2 should be performed in advance of the flow cytometry staining described above. To avoid problems with cell clumping and dissociation of tandem dyes after cell fixation, sample acquisition of both Mtb-infected and uninfected cells is performed within 4-10 h after primary antibody staining.
- Before flow cytometry staining described above, compensate the fluorescent signal for each fluorochrome-conjugated antibody listed in the staining panel (Table 1) using compensation beads (both positive and negative).
- Titrate the antibody dilution for staining of human macrophages to obtain the optimal signal for each fluorochrome.
- Use unstained cells to determine the level of background fluorescence necessary to set gate for the negative cell population allowing for the stained cells to be visualized (macrophages are highly auto fluorescent).
- Acquire a minimum of 50,000 cells/sample in the flow cytometer using the recommended software for data acquisition.
- Export the acquisition files from the flow cytometer in flow cytometry standard (FCS) format 3.1.
- Analyze the FCS files in flow cytometry analysis software.
- Gate macrophages according to their forward- and side scatter (FSC and SSC) characteristics and exclude dead cells by live/dead cell gating using the Zombie-UV viability dye.
- Visualize H37Rv-GFP infected macrophages in the FITC channel.
- Identify the frequency of positively stained cells and geometric mean fluorescence intensity (MFI) for all markers (Table 1).
8. Immunofluorescence staining of Mtb-infected monocyte-derived cells
NOTE: Mtb infection must be performed in a BSL-3 facility.
- For immunostaining, seed 2 x 10⁵ PBMCs/well in 500 μL of serum-free RPMI medium into 8 well chamber slides to obtain 2 x 10⁴ monocytes/well. After differentiation and M1/M2 polarization of monocytes, proceed with Mtb infection as described above. Fix the slides after 24 h of Mtb infection with fixation buffer for 30 min. Fixed slides are stored in the freezer at -20 ˚C until further analyses.
- Wash the monocyte-derived cells twice with 200 µL of PBS for 10 min each.
- Permeabilize the cells with 200 µL of permeabilization buffer for 5 min at RT.
- Wash the cells 3 times with 200 µL of PBS for 5 min each.
- Wash the cells twice with 200 µL of wash buffer for 5 min each.
- Block non-specific binding with 200 µL of blocking buffer for 30 min at RT.
- Dilute the primary antibodies 1:100 in staining buffer and incubate the M1 cells with an unconjugated CD64 antibody (Clone: 10.1) and the M2 cells with an unconjugated CD163 antibody (polyclonal) for 2 h at RT.
- Next, wash the cells 3 times with 200 µL of wash buffer for 10 min each.
- Dilute the fluorescent labeled secondary antibodies 1:1,000 in staining buffer and incubate the M1 cells with an anti-mouse IgG-Alexa Fluor 594 and the M2 cells with an anti-rabbit IgG-Alexa Fluor 594 for 1 h at RT.
- Wash the cells 3 times with 200 µL wash buffer for 10 min each.
- Remove the chamber grid and add ~20 μL of DAPI mounting medium in each well and put a 1.5 mm coverslip onto each slide.
- Seal the coverslip with a layer of nail polish.
- Acquire images using a confocal microscope with lasers emitting at 486 nm for excitation of GFP (green channel), 402 nm for DAPI (blue) and 560 nm for secondary antibody (red) respectively.
Results
A schematic illustration of the cytokine stimulations used for polarization of monocyte-derived cells to M0 (M2-like cells), M1 (fully polarized M1 cells) and M2 (fully polarized M2 cells) is presented in Figure 1A, while representative images of M0, M1 and M2 cell cultures as well as M1 cultures at day 0, 3 and 7, are shown in Figure 1B. Uninfected M0 cells were used to demonstrate the basic gating strategy (Figure 2A). Initially, the myeloid cells (~85%) were gated according to their forward scatter (FSC) and side scatter (SSC) properties including the larger cells with high granularity and excluding the small-sized debris with a low SSC and FSC that are found at the bottom left corner of the dot plot. In the second plot, doublets (i.e., cell clumps) were defined as having an increased area but similar height compared to single cells and were excluded from further analysis. Therefore, only cells proportionate between FSC-Area and FSC-Height (single cells) were included inside the slanted shape gate. Next, the Zombie-UV viability dye that stains the cytoplasmic proteins inside the dead cells, was used to exclude the dead cells from subsequent analysis. As expected, viable uninfected M0 cells were negative for Mtb-GFP expression visualized in the FITC-channel.
Next, we applied the same gating strategy to uninfected as well as Mtb-infected M1 and M2 macrophages at 4 hours post-infection (Figure 2B,C). Two sub-populations were detected in the FCS/SSC gate of uninfected M1 polarized macrophages; one population with a smaller size (FCS) and higher granularity (SSC) and the other population with a larger size and lower granularity (Figure 2B), while the main gate of uninfected M2 cells appeared more homogenous (Figure 2C). Both M1 and M2 monocyte-derived cells displayed a vertical shift to higher granularity and reduced cell size upon Mtb infection, which may reflect an increased complexity inside the cells caused by uptake of intracellular Mtb bacteria (Figure 2B,C). Furthermore, the viability stain revealed an enhanced cell death (17-22%) among the Mtb-infected M1 and M2 cells at a MOI of 5, compared to uninfected M0 cells (99%) (Figure 2A-C) or uninfected M1 and M2 cells (data not shown). Representative data showed that Mtb-GFP expression (i.e., Mtb infectivity) was substantially higher in M2 (77% GFP-positive cells) compared to M1 (19% GFP-positive cells) cells after 4 hours of infection (Figure 2B,C). After 24 hours of infection, Mtb-GFP expression was 43% and 85% in M1 and M2 cells respectively, suggesting that M1 cells had a relatively higher increase in GFP-expression from 4–24 hour after Mtb infection compared to M2 cells, 126% versus 10.4% increase in GFP-expression in M1 and M2 cells from 4–24 hours, respectively.
To characterize the efficacy of M1/M2 polarization in uninfected monocyte-derived cells, dot plots were used to identify M1 cells that were double-positive for CD64 and CD86 (CD64+CD86+) and M2 cells that were double-positive for CD163 and CD200R (CD163+CD200R+; Figure 3A,B). The selection of M1/M2 markers was primarily made based on the results from our previous work25 but also from other studies26,27,28,29. The quadrants for the stained cells, were set using corresponding gates for unstained M1/M2 cells (Figure 3A). None of these markers is exclusively expressed by M1 or M2 cells, but the proportion of positive cells as well as the intensity of the surface expression is different. This was particularly evident from the M1 stain where around 95% of M1 cells and 79% of M2 cells were CD64+CD86+, but the staining intensity was substantially higher in the M1 subset (Figure 3A). Whereas 27% of M1 cells were positive for the M2-marker CD200R, only 1% were positive for CD163, providing 0.5% CD163+CD200R+ M1 cells compared to 63% CD163+CD200R+ M2 cells (Figure 3A). After 4 hours of Mtb infection, an increase in the frequency of CD200R+ cells was observed in Mtb-GFP-positive M1 polarized cells (16%), while CD163-expression was reduced in M2 cells (Figure 3B). The heat-map demonstrates a high intensity of GFP-expression in CD163+CD200R+ M2 cells, but also in the CD64+CD86+ M2 subset as compared to the corresponding M1 cells subsets (Figure 3B). Overall, the shift in expression of the respective M1 and M2 markers is also visualized in the histograms in Figure 3C. Furthermore, Mtb-GFP bacteria were also visualized in CD64+ M1 cells and in CD163+ M2 cells by confocal microscopy, which supported an enhanced intracellular uptake and/or growth of Mtb inside M2 compared to M1 cells (Figure 3D).
To verify the results of the manual gating, we applied dimensionality reduction using Uniform Manifold Approximation and Projection (UMAP). UMAP analysis showed that Mtb infection for 4 hours was not sufficient to affect the polarization of macrophages, in contrast to 24 hours of infection, which resulted in clearly separated clusters of M1 and M2 uninfected and infected cells (Figure 4A). Uninfected M1 macrophages displayed higher expression of CD64, CD86, TLR2, HLA-DR and CCR7 compared to M2 macrophages, while uninfected M2 cells exhibited a strong up-regulation of the M2 phenotype markers CD163, CD200R, CD206 and CD80 (Figure 4B,C). In agreement to the manual gating, Mtb infection after 24 hours caused a clear downregulation of CD163, CD200R and CD206 on M2 cells and upregulation of CD86 and HLA-DR on M1 cells (Figure 4B,C), which suggests that Mtb can modulate macrophage polarization. Subsequent phenograph analysis (Figure 4D-F) identified 24 different clusters of different sizes that were uniquely distributed among the M1 and M2 uninfected and Mtb-infected cells as illustrated in the UMAP graphs (Figure 4D), pie charts (Figure 4E) and heat-maps (Figure 4F). Altogether, these results show promising efficiency of this protocol to generate phenotypically and functionally diverse M1 and M2 polarized cells in vitro that are further modulated by Mtb infection.
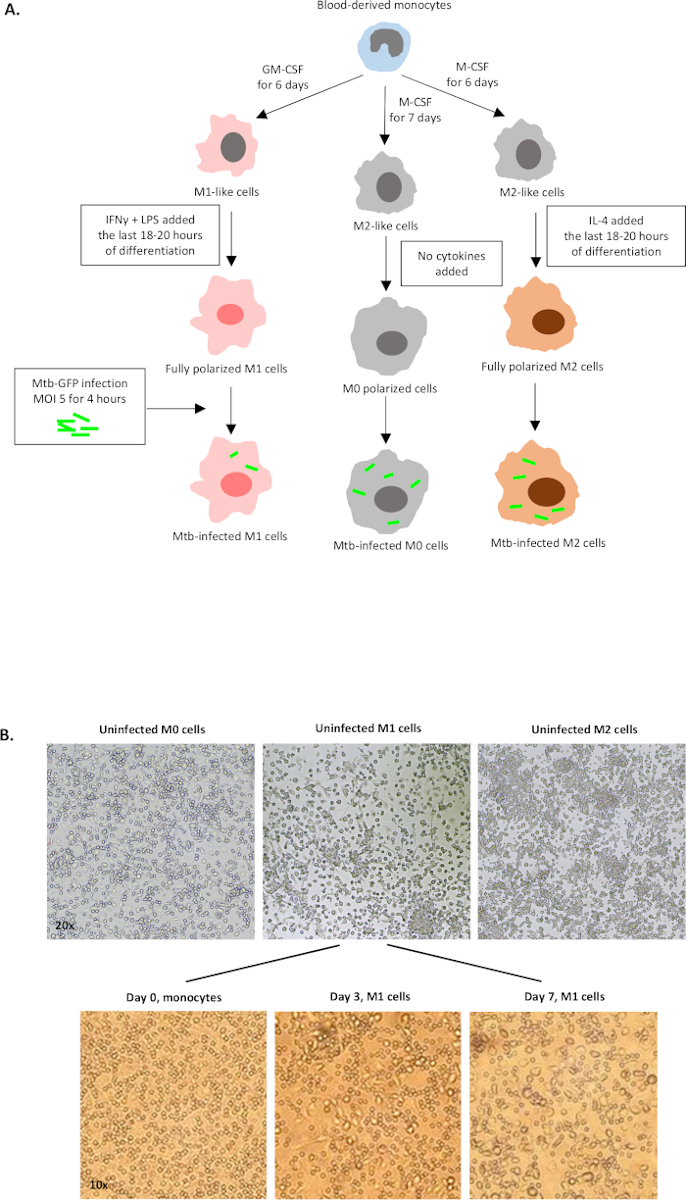
Figure 1: Schematic illustration of in vitro differentiation and polarization of human myeloid-derived cells. (A) M0 (M2-like), M1 (classically activated) and M2 (alternatively activated) cells are depicted. Monocytes obtained from healthy blood donors were polarized with different cytokines as described in the protocol and infected with the GFP-labeled Mtb strain, H37Rv, for 4 hours before analysis with 10-color flow cytometry. M1-polarized cells typically contain fewer bacteria compared to M2-polarized cells. (B) Microscopic images of fully polarized, uninfected M0, M1 and M2 cells in the 6-well plates at day 7, and representative images of M1 cell differentiation from monocytes at day 0, 3 and 7. Magnification is 20x (upper panel) and 10x (lower panel). Note that the M1 cells are more elongated and stretched compared to the more rounded M0 and M2 cells (upper panel). Please click here to view a larger version of this figure.

Figure 2: Gating strategy of differentially polarized myeloid-derived cells. Representative dot plots showing (A) Forward scatter (FSC) and side scatter (SSC) properties of uninfected M0 macrophages. The FSC-A/FSC-H plot shows manual gating of single cells proportionate for area and height. The live cell gate excluded cells that were positive for Zombie-UV (viability dye). Intracellular Mtb was detected by GFP-expression in live cells observed in the FITC channel. (B) Gating of M1 and (C) M2 macrophages showing FCS/SSC dot plots of both in uninfected cells and Mtb-infected cells 4 h and 24 h post-infection. Please click here to view a larger version of this figure.

Figure 3: Efficacy of the in vitro M1/M2 polarization protocol. Representative dot plots and quadrant gating showing subset frequencies of M1- and M2-polarized cells using CD64 and CD86 (M1) or CD163 and CD200R (M2) in (A) unstained and stained uninfected cells and (B) Mtb-infected stained cells 4 h post-infection. The dot plots in (B) illustrates fluorescence intensity of GFP-expression (heat map) in M1- and M2-polarized macrophages obtained from different sub-gates. (C) Geometric mean of fluorescence intensity (MFI) is shown in histograms from one representative donor after 4 h of Mtb infection. The MFI values in uninfected M1 (light blue) and M2 cells (light purple) are presented in the upper panel and Mtb-infected M1 (deep blue) and M2 cells (deep purple) are presented in the lower panel. (D) Representative confocal images of uninfected and Mtb-infected M1- and M2-polarized cells is shown. M1 and M2 cells were stained for CD64 and CD163 expression, respectively, using immunofluorescence. Positive surface staining is shown in red and GFP-expressing intracellular bacteria is shown in green. DAPI-stained nuclei are shown in blue color. Scale – 10 µm. The magnification of images to the right is 350x. Please click here to view a larger version of this figure.
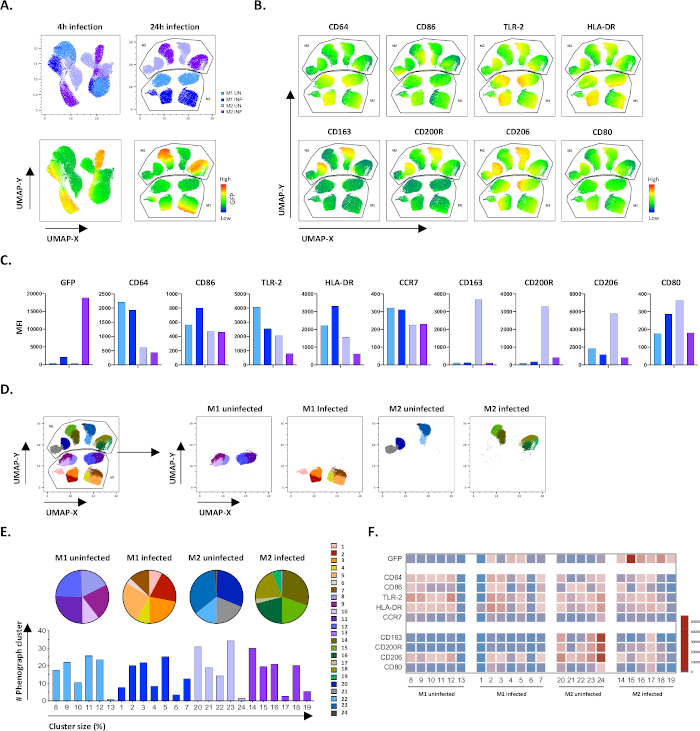
Figure 4: Dimensionality reduction with Uniform Manifold Approximation and Projection (UMAP) and phenograph analysis of uninfected and Mtb-infected M1 and M2 cells. (A) UMAP, created by concatenating 11000 live cells from uninfected and Mtb-infected M1 and M2 cell cultures from two representative blood donors, 4 h (left graphs) or 24 h (right graphs) post-infection. The heatmap for GFP-expression (lower panel) indicates uninfected and Mtb-infected cells. (B-C) MFI of markers expressed in uninfected and Mtb-infected M1 and M2 cells 24 h post-infection, shown as (B) heatmap or (C) bar plots. (D-F) Phenograph analysis identified 24 clusters that are differentially distributed among the uninfected and Mtb-infected M1 and M2 cultures. Clusters 8–13 are unique in uninfected M1 cells, clusters 1–7 are unique in Mtb-infected M1 cells, clusters 20–24 are unique in uninfected M2 cells and clusters 14–19 are unique in Mtb-infected M2 cells. The MFI of each marker in each phenograph cluster is shown in (F). The data is presented as uninfected M1 (light blue) and M2 cells (light purple) and Mtb-infected M1 (deep blue) and M2 cells (deep purple). Please click here to view a larger version of this figure.
Table 1: List of antibodies used for flow cytometry.
| Laser | Filter | Fluorochrome | Phenotype | Function | Clone | Catalog no. | Company |
| 639 | 670/30 | AF647 | TLR2 | Pathogen recognition receptor | TL2.1 | 309714 | BioLegend |
| 639 | 780/60 | APC-Cy7 | CD206 | Mannose receptor | 15-2 | 321120 | BioLegend |
| 405 | 610/20 | BV605 | CD163 | Scavenger receptor | GHI/61 | 333616 | BioLegend |
| 405 | 670/30 | BV650 | CD80 | Co-stimulatory molecule | 2D10 | 305227 | BioLegend |
| 405 | 710/50 | BV711 | CCR7 | Chemokine receptor | G043H7 | 353228 | BioLegend |
| 405 | 780/60 | BV785 | CD86 | Co-stimulatory molecule | IT2.2 | 305442 | BioLegend |
| 488 | 530/30 | GFP | Mtb | Intracellular bacteria | |||
| 561 | 586/15 | PE | CD200R | Inhibitory receptor | OX-108 | 329306 | BioLegend |
| 561 | 620/14 | PE/DAZZLE 594 | CD64 | Fc gamma receptor-I of IgG | 10.1 | 305032 | BioLegend |
| 561 | 661/20 | PE-Cy5 (PC5) | HLA-DR | MHC class II molecule | L243 | 307608 | BioLegend |
| 355 | 450/50 | BUV395 | Viability Dye | Live/dead cell marker | Zombie UV | 423108 | Invitrogen |
Discussion
This experimental protocol describes effective polarization of myeloid-derived cells into M1 or M2 phenotypes including assessment with a 10-color flow cytometry panel that allows visualization and deep-characterization of GFP-labeled Mtb in diverse macrophages subsets. Although TB is an ancient human disease, there is currently no golden standard model to study Mtb-macrophage interactions, and multi-color flow cytometry of macrophages could be complicated as compared to analyses of lymphocyte responses. Few available protocols for in vitro differentiation of human monocytes to macrophages present deep knowledge of the type of macrophages generated. A basic protocol for macrophage polarization and flow cytometric assessment of macrophage activation using a solid panel of markers can likely facilitate such characterization and offer opportunities to explore additional features of polarized cells treated under different conditions. This includes analyses of cells cultured in vitro as well as analyses of cells in vivo in clinical samples, i.e., both PBMC and single-cell suspensions from body fluids (i.e., bronchoalveolar lavage) or homogenized tissue. Accordingly, differentiation and/or activation status of monocytes and macrophages obtained from patients could be related to disease outcome. Expansion of CD16+CD163+ monocytes in peripheral blood have been reported in pulmonary TB patients30. An increased frequency of CD163+ cells was also detected in the inflamed skin of atopic dermatitis patients31. Similarly, CD206+ M2-like macrophages have been shown to inhibit proliferation and differentiation of cells in the microenvironment of adipocyte tissue32 and to be enriched in bone marrow samples from patients with acute myeloid leukemia (AML)29. An elevated ratio of CD64 (M1) to CD163 (M2) cells in whole blood of patients with osteoarthritis was found to be associated to disease severity33. Another study used CD86 (M1) and CD163 (M2) to demonstrate that high M1 expression in tissue correlated to worse outcome in a subgroup of malignant brain tumors34.
There are several significant advantages of this experimental M1/M2 flow cytometry protocol. This model provides the opportunity to study innate immune responses to virulent Mtb infection and can be developed to contain studies of adaptive immune responses by adding autologous T cells together with M1 or M2 macrophages in mixed-lymphocyte reactions (MLRs). The protocol is also suitable for drug screening and testing of different immunomodulatory and antimicrobial compounds. Here, we have previously studied the effects of vitamin D and the histone deacetylase inhibitor phenylbutyrate on myeloid-derived cells after Mtb infection25,35. M1/M2 flow cytometry could also be used to assess macrophage activation after conditioning with cell culture supernatants or patient plasma. While in vivo studies of TB co-infection with HIV or helminths or TB-diabetes co-morbidity could be challenging, the less complex M1/M2 model may facilitate studies of co-morbidities in vitro. Likewise, the protocol could be exploited for transmission studies to examine the Mtb infectivity of cells or to investigate phagocytic as well as antigen presentation capacity of individual M1/M2 cells. M1/M2 flow cytometry is also attractive for use in biomarker and vaccine studies, to follow disease prognosis during treatment and to test therapies targeting myeloid-derived cells. Importantly, a number of different methods could be applied in parallel to flow cytometry for simultaneous assessment of macrophage polarization phenotypes and functional responses using confocal microscopy (Figure 3D), real-time PCR, western blot, multiplex assays and ELISA of soluble factors in the culture supernatant as well as assessment of intracellular bacterial infectivity and growth using GFP-expression (flow cytometry and confocal microscopy) and colony forming units (CFU). Infection of M1 or M2 cells with Mtb-GFP bacteria also enables sorting the uninfected and Mtb-infected cells from the same sample for single cell-RNA sequencing analysis.
The described protocol also has some limitations including both technical and scientific disadvantages. The drawback using monocyte-derived macrophages from human blood donors is that the donor variability often is high and the fact that the cells are not polarized in the physiological environment of human tissues. Large variability in M1/M2 polarization efficacy or Mtb-infectivity between donors may result in problems with both intra- and interexperimental variations, low statistical power, and a need to include many donors to obtain reliable results. In addition, plastic adherence of monocytes from PBMCs result in a donor-dependent number of monocytes/well that may eventually provide an arbitrary MOI that could impact the macrophage polarization and cell viability after Mtb infection. Critical steps in the protocol involves proper washing to prevent other cells types to contaminate the cell cultures that could also affect macrophage polarization. While a too low MOI may mimic latent TB infection, a too high MOI will kill the cells, highlighting the importance of using an appropriate MOI. Furthermore, it could be difficult to retrieve firmly adherent cells upon detachment, which may result in a biased representation of certain macrophages subsets used for flow cytometry analyses. A crucial step in flow cytometry analysis involves proper use of beads compensation matrix and negative controls such as unstained cells or FMO (Fluorescence Minus One) controls to ensure correct manual gating.
Another limitation involves polarization of monocytes derived from blood and not from the local tissue environment. The hallmark of human TB is formation of granulomas in Mtb-infected tissues and thus, immunopathology in TB should preferentially be studied at the local tissue site. However, monocytes are recruited to the lung from peripheral blood upon inflammation/infection, where cells can differentiate into macrophages in the presence of inflammatory cytokines such as GM-CSF12. Importantly, in the physiological milieu of tissue in vivo, there is likely a large heterogeneity of macrophage polarization including a mixture and different ratios of diverse M1- and M2-like macrophage populations that contribute to the fate of TB infection36. We have previously developed a human organotypic lung tissue model which enables 3D-studies of macrophage-mediated granuloma formation in TB37. It could be interesting to exploit the current M1/M2 polarization protocol in combination with the lung tissue model to further study TB granuloma formation, effector functions and M1/M2 ratio in experimental tissue.
This M1/M2 flowcytometry protocol could readily be adapted to include an extended panel of myeloid markers useful for assessment of features associated with inhibitory as well as inflammatory responses. There is a great research interest in inhibitory immune checkpoint molecules such as PD-1, SIRP-α, IDO and arginases that could modulate macrophage responses38. In this context, polarization of myeloid cells could also involve other stimuli that promotes immunoregulatory macrophages (Mreg) or myeloid-derived suppressor cells (MDSC) that has been shown to be involved in several diseases including TB38. More advanced flow cytometry panels of M1/M2/Mreg macrophage subsets may also include intracellular staining of cytokines/chemokines IL-1β, TNF-α, IL-10 and MCP-1 or other soluble factors or effector molecules such as inducible nitric oxide (iNOS) and antimicrobial peptides. This could enhance the possibilities to study polyfunctional macrophage responses, similar to what has been extensively described for T cells39.
Currently, flow cytometry staining panels can include up to 30-40 colors, which provides the ability to immunophenotype multiple cell subsets and molecules simultaneously. The basic experimental set up of this M1/M2 flow cytometry protocol can be used as a backbone that is compatible with most old as well as new flow cytometers and can be built upon and tailored according to individual needs including the challenges posed by work with virulent Mtb in a BSL-3 environment. Nowadays, dimensionality reduction techniques such as UMAP are available in the new versions of flow cytometry software, which enables analysis of large number of parameters generated in single-cell studies that is essential for improved visualization and interpretation of high-dimensional data40. The constant technological improvements in flow cytometry will likely continue in the coming years including the combination of multi-parametric phenotyping together with modern cell sorting capabilities, where this protocol could prove useful in several macrophage based Mtb infection assays.
Disclosures
The authors have nothing to disclose.
Acknowledgements
We thank our colleagues at the Public Health Agency of Sweden, Matilda Svensson and Solomon Ghebremichael for assistance in the BSL-3 laboratory.
This work was supported by grants from the Swedish Heart and Lung Foundation (HLF) (2019-0299 and 2019-0302 to SB), the Swedish Research Council (VR) (2014-02592, 2019-01744 and 2019-04720 to SB), the Foundation to Prevent Antibiotic Resistance (Resist), Karolinska Institutet Foundations and KID to SB (partial financing of doctoral education for Marco Loreti) from the Karolinska Institutet. ML was supported from the Swedish Children’s Cancer Foundation (TJ2018-0128 and PR2019-0100).
Materials
| Name | Company | Catalog Number | Comments |
|---|---|---|---|
| 8-well chamber slides | Lab-Tek | 154534 | |
| BD Comp bead plus | BD | 560497 | |
| Bovine Serum Albumin | Sigma-Aldrich | A7906 | |
| DAPI Mounting media | Vector Laboratories | H-1200-10 | |
| EDTA (0.5 M) | Karolinska University hospital, Huddinge | N/A | |
| Falcon 6-well Flat Bottom plates | Corning Life Sciences | 353046 | |
| Fetal bovine serum (FBS) | Sigma-Aldrich | F7524 | |
| Formaldehyde | Sigma-Aldrich | F8775 | |
| Glycerol (70%) | Karolinska University hospital, Huddinge | N/A | |
| GM-CSF | Peprotech | 300-03 | |
| Goat anti-mouse IgG Alexa Fluor 594 secondary antibody | Invitrogen | R37121 | Secondary antibody for CD64 |
| Goat anti-Rabbit IgG Alexa Fluor 594 secondary antibody | Invitrogen | A-11037 | Secondary antibody for CD163 |
| HEPES | GE Healthcare Life Sciences | SH30237.01 | |
| IFN-γ | Peprotech | 300-02 | |
| IL-4 | Peprotech | 200-04 | |
| L-Glutamine | GE Healthcare Life Sciences | SH30034.01 | |
| LPS (Escherichia coli O55:B5) | Sigma-Aldrich | L6529 | |
| Lymphoprep | Alere Technologies AS | 11508545 | |
| M-CSF | Peprotech | 300-25 | |
| Middle Brook 7H10 agar plates | Karolinska University hospital, Huddinge | N/A | |
| Middle Brook 7H9 media | Karolinska University hospital, Huddinge | N/A | |
| Mouse anti-human CD64 primary antibody | Bio-Rad | MCA756G | Clone: 10.1 |
| Na-pyruvate | GE Healthcare Life Sciences | SH300239.01 | |
| Normal goat serum | Jackson ImmunoResearch | 005-000-121 | |
| Rabbit anti-human CD163 primary antibody | GeneTex | GTX81526 | Polyclonal |
| RPMI 1640 | Life Technologies Corporation | SH30096.01 | |
| Triton X-100 | Sigma-Aldrich | X-100 | |
| TubeSpin bioreactor tubes | TPP Techno Plastic Products AG | 87050 | |
| Tween-20 | Sigma-Aldrich | P9416 | |
| Tween-80 | Sigma-Aldrich | P4780 |
References
- Sica, A., Mantovani, A. Macrophage plasticity and polarization: in vivo veritas. Journal of Clinical Investigation. 122 (3), 787-795 (2012).
- Cassetta, L., Cassol, E., Poli, G. Macrophage polarization in health and disease. Scientific World Journal. 11, 2391-2402 (2011).
- Mills, C. D., Kincaid, K., Alt, J. M., Heilman, M. J., Hill, A. M. M-1/M-2 macrophages and the Th1/Th2 paradigm. Journal of Immunology. 164 (12), 6166-6173 (2000).
- Martinez, F. O., Gordon, S. The M1 and M2 paradigm of macrophage activation: time for reassessment. F1000 Prime Reports. 6, 13(2014).
- Atri, C., Guerfali, F. Z., Laouini, D. Role of human macrophage polarization in inflammation during infectious diseases. International Journal of Molecular Sciences. 19 (6), (2018).
- Flynn, J. L., Gideon, H. P., Mattila, J. T., Lin, P. L. Immunology studies in non-human primate models of tuberculosis. Immunological Reviews. 264 (1), 60-73 (2015).
- Mosser, D. M., Edwards, J. P. Exploring the full spectrum of macrophage activation. Nature Reviews Immunology. 8 (12), 958-969 (2008).
- Fleetwood, A. J., Lawrence, T., Hamilton, J. A., Cook, A. D. Granulocyte-macrophage colony-stimulating factor (CSF) and macrophage CSF-dependent macrophage phenotypes display differences in cytokine profiles and transcription factor activities: implications for CSF blockade in inflammation. Journal of Immunology. 178 (8), 5245-5252 (2007).
- Nathan, C. F., Murray, H. W., Wiebe, M. E., Rubin, B. Y. Identification of interferon-gamma as the lymphokine that activates human macrophage oxidative metabolism and antimicrobial activity. Journal of Experimental Medicine. 158 (3), 670-689 (1983).
- Leidi, M., et al. M2 macrophages phagocytose rituximab-opsonized leukemic targets more efficiently than m1 cells in vitro. Journal of Immunology. 182 (7), 4415-4422 (2009).
- Stein, M., Keshav, S., Harris, N., Gordon, S. Interleukin 4 potently enhances murine macrophage mannose receptor activity: a marker of alternative immunologic macrophage activation. Journal of Experimental Medicine. 176 (1), 287-292 (1992).
- Italiani, P., Boraschi, D. From Monocytes to M1/M2 macrophages: Phenotypical vs. functional differentiation. Frontiers in Immunology. 5, 514(2014).
- Verreck, F. A., et al. Human IL-23-producing type 1 macrophages promote but IL-10-producing type 2 macrophages subvert immunity to (myco)bacteria. Proceedings of the National Academy of Sciences. 101 (13), 4560-4565 (2004).
- Redente, E. F., et al. Differential polarization of alveolar macrophages and bone marrow-derived monocytes following chemically and pathogen-induced chronic lung inflammation. Journal of Leukocyte Biology. 88 (1), 159-168 (2010).
- Refai, A., Gritli, S., Barbouche, M. R., Essafi, M. Mycobacterium tuberculosis virulent factor ESAT-6 drives macrophage differentiation toward the pro-inflammatory M1 phenotype and subsequently switches it to the anti-inflammatory M2 phenotype. Frontiers in Cellular and Infection Microbiology. 8, 327(2018).
- Kahnert, A., et al. Alternative activation deprives macrophages of a coordinated defense program to Mycobacterium tuberculosis. European Journal of Immunology. 36 (3), 631-647 (2006).
- Marino, S., et al. Macrophage polarization drives granuloma outcome during Mycobacterium tuberculosis infection. Infection and Immunity. 83 (1), 324-338 (2015).
- Erbel, C., et al. An in vitro model to study heterogeneity of human macrophage differentiation and polarization. Journal of Visualized Experiments. (76), e50332(2013).
- Lee, C. Z. W., Kozaki, T., Ginhoux, F. Publisher Correction: Studying tissue macrophages in vitro: are iPSC-derived cells the answer. Nature Reviews Immunology. 18 (11), 726(2018).
- Ying, W., Cheruku, P. S., Bazer, F. W., Safe, S. H., Zhou, B. Investigation of macrophage polarization using bone marrow derived macrophages. Journal of Visualized Experiments. (76), e50323(2013).
- Van den Bossche, J., Baardman, J., de Winther, M. P. Metabolic characterization of polarized M1 and M2 bone marrow-derived macrophages using real-time extracellular flux analysis. Journal of Visualized Experiments. (105), e53424(2015).
- McKinnon, K. M. Flow Cytometry: An Overview. Current Protocols in Immunology. 120, 1-11 (2018).
- Njoroge, J. M., et al. Characterization of viable autofluorescent macrophages among cultured peripheral blood mononuclear cells. Cytometry. 44 (1), 38-44 (2001).
- Li, F., et al. Autofluorescence contributes to false-positive intracellular Foxp3 staining in macrophages: a lesson learned from flow cytometry. Journal of Immunological Methods. 386 (1-2), 101-107 (2012).
- Rao Muvva, J., Parasa, V. R., Lerm, M., Svensson, M., Brighenti, S. Polarization of human monocyte-derived cells with vitamin D promotes control of Mycobacterium tuberculosis infection. Frontiers in Immunology. 10, 3157(2019).
- Tarique, A. A., et al. functional, and plasticity features of classical and alternatively activated human macrophages. American Journal of Respiratory Cell and Molecular Biology. 53 (5), 676-688 (2015).
- Hristodorov, D., et al. Targeting CD64 mediates elimination of M1 but not M2 macrophages in vitro and in cutaneous inflammation in mice and patient biopsies. MAbs. 7 (5), 853-862 (2015).
- Jaguin, M., Houlbert, N., Fardel, O., Lecureur, V. Polarization profiles of human M-CSF-generated macrophages and comparison of M1-markers in classically activated macrophages from GM-CSF and M-CSF origin. Cellular Immunology. 281 (1), 51-61 (2013).
- Xu, Z. J., et al. The M2 macrophage marker CD206: a novel prognostic indicator for acute myeloid leukemia. Oncoimmunology. 9 (1), 1683347(2020).
- Liu, Q., et al. Differential expression and predictive value of monocyte scavenger receptor CD163 in populations with different tuberculosis infection statuses. BMC Infectious Diseases. 19 (1), 1006(2019).
- Sugaya, M., et al. Association of the numbers of CD163(+) cells in lesional skin and serum levels of soluble CD163 with disease progression of cutaneous T cell lymphoma. Journal of Dermatological Science. 68 (1), 45-51 (2012).
- Nawaz, A., et al. CD206(+) M2-like macrophages regulate systemic glucose metabolism by inhibiting proliferation of adipocyte progenitors. Nature Communications. 8 (1), 286(2017).
- Liu, B., Zhang, M., Zhao, J., Zheng, M., Yang, H. Imbalance of M1/M2 macrophages is linked to severity level of knee osteoarthritis. Experimental and Therapeutic Medicine. 16 (6), 5009-5014 (2018).
- Lee, C., et al. M1 macrophage recruitment correlates with worse outcome in SHH Medulloblastomas. BMC Cancer. 18 (1), 535(2018).
- Rekha, R. S., et al. Phenylbutyrate induces LL-37-dependent autophagy and intracellular killing of Mycobacterium tuberculosis in human macrophages. Autophagy. 11 (9), 1688-1699 (2015).
- Mattila, J. T., et al. Microenvironments in tuberculous granulomas are delineated by distinct populations of macrophage subsets and expression of nitric oxide synthase and arginase isoforms. Journal of Immunology. 191 (2), 773-784 (2013).
- Braian, C., Svensson, M., Brighenti, S., Lerm, M., Parasa, V. R. A 3D Human Lung Tissue Model for Functional Studies on Mycobacterium tuberculosis Infection. Journal of Visualized Experiments. (104), e53084(2015).
- Brighenti, S., Joosten, S. A. Friends and foes of tuberculosis: modulation of protective immunity. Journal of Internal Medicine. , 12778(2018).
- Chattopadhyay, P. K., Roederer, M. Good cell, bad cell: flow cytometry reveals T-cell subsets important in HIV disease. Cytometry Part A. 77 (7), 614-622 (2010).
- Becht, E., et al. Dimensionality reduction for visualizing single-cell data using UMAP. Nature Biotechnology. 37, 38-44 (2019).
Reprints and Permissions
Erratum
Formal Correction: Erratum: Polarization of M1 and M2 Human Monocyte-Derived Cells and Analysis with Flow Cytometry upon Mycobacterium tuberculosis Infection
Posted by JoVE Editors on 10/14/2020. Citeable Link.
An erratum was issued for: Polarization of M1 and M2 Human Monocyte-Derived Cells and Analysis with Flow Cytometry upon Mycobacterium tuberculosis Infection. Author and affiliation information was updated.
The author and affiliation information was updated from:
Akhirunnesa Mily1, Sadaf Kalsum1, Marco Giulio Loreti1, Rokeya Sultana Rekha2, Jagadeeswara Rao Muvva1, Magda Lourda1,3, Susanna Brighenti1
1Center for Infectious Medicine (CIM), Department of Medicine Huddinge, ANA Futura, Karolinska Institutet
2Clinical Microbiology, Department of Laboratory Medicine (Labmed), ANA Futura, Karolinska Institutet
3Childhood Cancer Research Unit, Department of Women's and Children's Health, Karolinska Institutet
to:
Akhirunnesa Mily1,2, Sadaf Kalsum1, Marco Giulio Loreti1, Rokeya Sultana Rekha3, Jagadeeswara Rao Muvva1, Magda Lourda1,4, Susanna Brighenti1
1Center for Infectious Medicine (CIM), Department of Medicine Huddinge, ANA Futura, Karolinska Institutet
2Infectious Diseases Division, International Centre for Diarrhoeal Disease Research, Bangladesh
3Clinical Microbiology, Department of Laboratory Medicine (Labmed), ANA Futura, Karolinska Institutet
4Childhood Cancer Research Unit, Department of Women's and Children's Health, Karolinska Institutet
