This protocol describes a novel mammary imaging window with a replaceable lid (R.MIW). Intravital microscopy after implantation of the R.MIW allows for longitudinal and multi-day imaging of the healthy and diseased mammary gland with a cellular resolution during the different developmental stages.
Method Article
Longitudinal Intravital Microscopy Using a Mammary Imaging Window with Replaceable Lid
In This Article
Summary
Abstract
The branched structure of the mammary gland is highly dynamic and undergoes several phases of growth and remodeling after birth. Intravital microscopy in combination with skin flap surgery or implantation of imaging windows has been used to study the dynamics of the healthy mammary gland at different developmental stages. Most mammary imaging technologies are limited to a time frame of hours to days, whereas the majority of mammary gland remodeling processes occur in time frames of days to weeks. To study mammary gland remodeling, methods that allow optical access to the tissue of interest for extended time frames are required. Here, an improved version of the titanium mammary imaging window with a replaceable lid (R.MIW) is described that allows high-resolution imaging of the mammary gland with a cellular resolution for up to several weeks. Importantly, the R.MIW provides tissue access over the entire duration of the intravital imaging experiment and could therefore be used for local tissue manipulation, labeling, drug administration, or image-guided microdissection. Taken together, the R.MIW enables high-resolution characterization of the cellular dynamics during mammary gland development, homeostasis, and disease.
Introduction
The mammary epithelium is a unique secretory organ present in mammals, which produces and secretes milk to nourish offspring. Throughout life, the mammary gland undergoes multiple rounds of development and growth, which are accompanied by structural and functional changes of the tissue1. Depending on the developmental stage, the cell types contributing to tissue remodeling are different, as well as the location within the ductal tree.
Multiphoton intravital microscopy (IVM) allows the study of mammary cell dynamics in vivo in the native and minimally perturbed setting2,3,4. To obtain visual access to the mammary gland, several temporary ex vivo or skin flap imaging techniques have been published during different stages of mammary gland development, including puberty4,5,6,7, adulthood2,8, lactation9,10,11,12, and tumor dynamics13,14,15. Although these techniques result in high spatially and temporally resolved imaging of mammary cell dynamics, the time frame is limited to hours whereas most mammary gland remodeling processes take days to weeks. Therefore, methods that allow optical access to the tissue of interest for extended time frames are required. Over the years, several permanent imaging windows have been developed for mammary tumor imaging15,16,17,18, including a titanium mammary imaging window (MIW)2,3,19. Although very useful to study mammary tumor growth, visualization of the healthy mammary gland structure remained limited to a few days. Recently, a flexible silicon imaging window was developed, which allows visualization of the pubertal mammary gland over multiple weeks20. However, the mammary gland is embedded in an adipocyte-rich fat pad, which leads to extensive light-scattering and as a result limited visibility of the mammary ductal structures. Therefore, superior imaging conditions are required at all times to visualize tissue dynamics over prolonged periods of time in the mammary gland. Neither the classical MIW, nor the flexible silicon window allow for tissue manipulation or optimization of physical tissue location before imaging, as the window forms a closed system after surgery and implantation. As a result, optimal optical access to the underlying mammary tissue is likely to become precluded over longer time periods. In contrast, the skin flap technique does allow for optimization and repositioning of the tissue during the imaging session and a skin flap can be repeated multiple times2. However, repeated imaging sessions through a skin flap are only possible when sufficient time (at least 7 days) is allocated in between surgeries to allow recovery of the skin and is therefore mostly suited to study processes at longer time scales. Moreover, it is advisable to not perform this procedure many times because of its invasive nature and large risk of infections and scarring upon wound closure.
To overcome these limitations, i.e., to ensure optimal imaging conditions for a prolonged period of time at a high frequency and at the same time allow tissue manipulation, an improved titanium version of the MIW with a replaceable lid (R.MIW) was designed to visualize the healthy and diseased mammary gland over multiple days to weeks2 (Figure 1A,B). The R.MIW was custom designed to provide optimal tissue access, enabling direct tissue manipulation over the entire duration of the IVM experiment, and thereby permits visualization of the mammary gland at the right time and place over prolonged periods of time. When closed, the R.MIW forms an airtight system comparable to the classical MIW (Figure 1C). When opened under aseptic conditions, the R.MIW allows local tissue manipulation to improve optical access and also enables local administration of substances, such as pathway inhibitors or agonists, injection of different cell types of interest, such as cancer cell or immune cell populations, or addition of tissue labeling-dyes. The lid can be opened at any moment in between imaging sessions without causing damage to the underlying tissue.

Figure 1: Design of the mammary imaging window with a replaceable lid. (A) Top view and side view of the replaceable lid of the mammary imaging window with a 10 mm coverglass glued to the ring. (B) Top view and side view of the mammary imaging window, which consists of an outer ring and inner ring with a groove in between to secure the window within the skin of the mouse using a purse-string suture. The outer ring has a small groove that fits the four projections (arms) of the lid. (C) Cartoon and pictures demonstrating the opening and closing mechanisms of the lid. The slanting projections make sure the lid is fixed inside the window frame. This figure has been modified from Messal et al. 2. Please click here to view a larger version of this figure.
This protocol describes the design and implantation procedure of the R.MIW, as well as a longitudinal IVM strategy to revisit the same mammary ducts and their visualization at a cellular resolution. The R.MIW allows following cell divisions and morphological changes during different developmental phases of the mammary gland in diverse fluorescent reporter mouse models. Taken together, the R.MIW facilitates high-resolution characterization of the cellular dynamics during mammary gland development, homeostasis, and disease.
Protocol
All procedures described in this paper were performed in accordance with the guidelines of the IACUC and KU Leuven and were carried out within the context of approved project application P160/2020. Prior to executing this protocol, please review the analgesia strategy with the institutional veterinarian and administer pre-and post-operative analgesia as per institutional guidelines.
1. Preparation of the R.MIW (estimated timing: 2 h)
NOTE: For the construction of the R.MIW, it is advisable to find a local manufacturer who specializes in working with hard materials such as titanium, as this requires special tools and expertise. Workshops specializing in the design and manufacture of titanium prosthetics usually have the machinery and expertise to produce the R.MIW parts.
- Place the lid of the R.MIW on a sterile surface with the outside of the lid facing upwards (and the arms of the lid sloping downwards; Figure 1A).
- Apply cyanoacrylate adhesive glue around the entire rim of the lid and carefully place a 10 mm round glass coverslip on top of the lid.
NOTE: Always prepare a spare lid with a glass coverslip as a backup during the surgical procedure. - Use a sterile wooden stick to position the glass coverslip and apply some force to push it down to ensure an air-tight seal between the glass coverslip and the frame of the lid. Make sure the holes in the arms of the lid are not covered up by the glass.
- Disinfect the lids and the R.MIW by submerging in 80% ethanol for at least 30 min in a closed Petri dish.
NOTE: Do not leave the lids longer than 1 h in 80% ethanol to avoid the dissolution of the cyanoacrylate adhesive glue. - Remove the excess cyanoacrylate adhesive glue from the glass coverslip by using a cotton tip soaked in acetone.
- Store the lids and the R.MIW in a sterile environment until further use.
NOTE: The R.MIW frame and lids can be kept in a sterile tube or bag for a maximum of 1 week. When resuming the experiment, always examine whether the glass coverslip is still properly attached to the lid prior to proceeding with the protocol.
2. Preparation for surgery (estimated timing: 15 min)
NOTE: For the R.MIW implantation procedure, female mice (>3.5 weeks old) of any strain can be used.
- Maintain sterility by using sterile gloves, and sterilize all items that will come in contact with the mouse. Wash surgical tools with water and mild soap, air dry, wrap in aluminum foil with no exposed corners or edges, and sterilize using an autoclave for a cycle of 20 min at 120 °C prior to the surgery.
- Prepare a sterile surgical platform and sterilize the surfaces with 80% ethanol.
NOTE: To ensure sterility, the surgery can be performed in a flow cabinet. - Turn on the heating pad and cover the mat with a sterile drape. Layout the sterile instruments on the sterile drape and place the R.MIW and a minimum of two glass-covered lids in sterile phosphate-buffered saline (PBS) in a Petri dish (close the lid to avoid external contamination).
- Anesthetize the mouse in an induction chamber using a 3% isoflurane/O2 mixture. Ensure that the animal is relaxed enough to be easily manipulated and transferred to the nose mask without any struggle.
- Transfer the mouse from the induction chamber to an anesthesia nose mask and reduce the isoflurane level to 1.5% - 2% isoflurane/O2 mixture. Verify full anesthesia by performing a paw withdrawal test.
- To perform the paw withdrawal test, firmly pinch the animal paw using fingernails or blunt end forceps. In the absence of any muscle reflex, consider the animal as unconscious and proceed for surgical preparation. Perform this test before animal manipulation and repeat regularly during the anesthetic and surgical procedures to confirm anesthesia.
- Apply eye ointment to prevent corneal dehydration.
- Shave the area around the 4th mammary gland using a razor blade (Figure 2A). Use the 4th nipple as a landmark. Remove loose hairs using sticky tape.
NOTE: Alternatively, depilatory cream can be used to remove the hairs. - Disinfect the exposed skin with 80% ethanol or povidone-iodine and position the mouse in the sterile surgical area on its back with the snout into an anesthesia nose mask using 1.5% isoflurane/O2 mixture.
- Secure the front and hind limbs of the mouse using paper tape.
NOTE: Leave the anesthetized and recovering mouse on the heating pad as much as possible, during and after surgery. - Use a precut sterile surgical drape or gauze to cover the mouse whilst leaving the surgical area exposed.
3. R.MIW implantation (estimated timing: 30 min)
- Verify if the animal is adequately anesthetized by performing a paw withdrawal test. Gently lift the skin using a fine Graefe forceps and make a 10-15 mm diagonal incision using small spring scissors in the skin on top of the 4th mammary fat pad using the 4th nipple as an orientation point (Figure 2A). Make sure not to cut or damage the peritoneum or the mammary gland.
- Define the region of interest (ROI) based on macroscopic features of the mammary tissue, including the location of the lymph node or a tumor lesion, and try to keep the ROI central with regard to the incision.
- Separate the skin from the mammary fat pad and underlying tissue layers using blunt dissection of up to 5-8 mm all around the incision line to create a pocket to fit the R.MIW frame (Figure 2BI).
- Pick up the R.MIW using sterile forceps and test whether the incision is large enough to insert the window. If needed, slightly enlarge the incision until the R.MIW fits in.
- Remove the R.MIW and place a purse-string suture all around the incision using a 5-0 silk suture (braided, non-resorbable). Place the suture 1-2 mm from the edge of the incision from the outside to the inside of the skin, starting from the caudal end of the incision.
- Move approximately 5 mm up along the incision and pass the suture thread through the skin from inside to outside. Repeat this procedure along the edge of the incision, thereby creating a circular suture consisting of 5-6 loops (Figure 2BII). The final exit of the suture thread should be located approximately 2-5 mm away from the first entrance.
NOTE: Be careful not to place the suture too close to the edge of the incision, as this increases the risk of skin tear. Placing the suture too far from the edge of the incision increases the risk of infection between the excess skin and the groove of the R.MIW. - Fit the R.MIW inside the incision and use the Graefe forceps to carefully place the skin in the groove of the R.MIW. Make sure to leave the loops of the suture outside.
- Pull on the loops of the purse-string suture and tighten the suture in the groove of the R.MIW by gently pulling on both ends of the suture (Figure 2BIII). Tie off with surgical knots and cut away the excess thread.
- Apply petroleum jelly to the inner rim of the R.MIW using a toothpick, while making sure to avoid the underlying tissue. Gently push the window frame downwards with sterile forceps or two fingertips, and position the lid into the R.MIW frame (Figure 1B). This will avoid a volume of air in between the mammary gland tissue and the R.MIW lid.
- Place the tips of thin forceps through the holes in the arms of the lid and tighten the lid by twisting the lid clockwise (approximately 5°) (Figure 1C and Figure 2BIV).
- If some air remains after tightening the R.MIW lid, use a sterile insulin needle to remove the excess air. Introduce the needle through the skin into the cavity between the mammary tissue and the lid and slowly pull out the plunger, thereby creating a vacuum between the mammary gland tissue and the R.MIW lid.
- Administer, post-surgery, analgesia such as buprenorphine (0.1 mg/kg diluted in sterile 0.9% NaCl) by subcutaneous injection. Repeat subcutaneous injection with buprenorphine at 8 h and 16 h after the surgery.
- Put the mouse back into the cage to recover and monitor closely until it is fully awake, or proceed with step 4 for immediate imaging.
- At this post-surgical stage, monitor the mice closely for signs of discomfort or complications based on vital parameters, such as respiration, reactivity, behavior, posture, and body weight. Monitor the skin surrounding the window carefully for signs of inflammation and necrosis. If no complications occur, the R.MIW will allow for repeated IVM sessions over several weeks post-implantation.
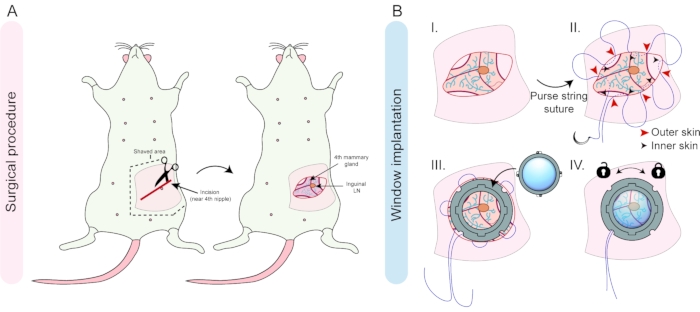
Figure 2: Overview of the surgical procedure and window implantation. (A) A diagonal incision is made near the 4th nipple of a female mouse and the skin and underlying tissue are disconnected by blunt dissection. (B) The inguinal lymph node and shape of the fat pad can be used for the right orientation of the tissue (I). A purse-string suture is placed in the skin around the incision (II), and after fitting in the window frame, the suture is tightened in the groove to secure the window frame, and secured by surgical knots (III). The last step is the insertion and locking of the lid into the window frame (IV). Please click here to view a larger version of this figure.
4. Repeated intravital microscopy through the R.MIW
NOTE: The repeated IVM strategy described here was optimized for an inverted multiphoton confocal system equipped with a motorized stage and a dark climate chamber at 35.8 °C.
- Anesthetize the mouse in an induction chamber using a 3% isoflurane/O2 mixture. Verify loss of consciousness by performing a paw withdrawal test (described in step 2.6). Apply eye ointment to prevent corneal dehydration during the imaging session.
- Inspect the condition of the R.MIW frame and lid, including the stability of the sutures or any potential damage to the lid. In case of damage to the lid, the lid can be replaced as described in step 5.
- Transfer the mouse to a pre-heated (37 °C), custom-made imaging box (Figure 3A) and place the mouse with the head into the nose cone. The imaging box consists of a frame that fits within the automated stage of the microscope. The frame is designed to hold a custom-made inlay with a hole the diameter of the R.MIW (Figure 3A) .
- An inlet with a nose cone is connected to the front of the box and attached to an isoflurane vaporizer station using 2%-3% isoflurane/O2 mixture. An outlet is connected to an anesthetic scavenging unit to ensure circulation and to prevent accumulation of isoflurane in the box. The imaging box can be closed using a transparent lid.
- Position the mouse on the inlay in such a way that the R.MIW falls in the hole of the imaging box inlay (Figure 3A). Apply parafilm and paper tape over the back of the mouse to stabilize the mouse and reduce tissue motion due to respiration.
- Close the imaging box with the lid and insert the imaging box in the stage of the microscope.
- Reduce the isoflurane dose gradually over the course of the imaging session to sustain a stable, but superficial anesthesia (typically between 1.5%-0.8% isoflurane/O2 mixture).
- Provide proper nutrition during imaging as described below.
- For imaging sessions <3 h, inject the mouse subcutaneously with 200-300 µL of sterile PBS for hydration.
- For imaging sessions >3 h, follow the steps outlined below.
- For long-term imaging, infuse the mouse with nutrients. For this, use a commercially available sterile infuse mixture containing amino acids and glucose. Place a flexible needle subcutaneously in the neck of the mouse and secure it with paper tape.
- Attach a 10 mL syringe with the prepared nutrient mix to a flexible silicon tube and push the nutrient mix through until it has reached the end of the tube.
- Connect the silicone tube to the flexible needle. Take the end of the tubing and place it through one of the holes of the imaging box (from inside to outside, leaving the needle attachment side in the box).
- Inject 50 µL of infuse solution every 30 min.
- Secure the imaging box in the stage of the microscope and define the area of interest using the epifluorescence mode of the microscope.
- Apply the desired microscope settings depending on the mouse model (Figure 3B). Vessel structures, collagen patterns (visualized by second harmonic generation), and other stable anatomical structures, including the inguinal lymph node, may be used as landmarks. Acquire images using an inverted multiphoton confocal microscope at a 12-bit depth, and a 25x water objective using a Z-step size ranging from 1.0 to 4.0 µm (total z-stack ranging from 150 to 800 µm). Apply the following standard settings: 1024 x 1024 format, 600 Hz scan speed, bidirectional mode.
- Visualize collagen I fibers by performing second harmonic generation by using an excitation wavelength of 860 nm and detection at 425-435 nm. Excitation and detection wavelengths for the different fluorophores are indicated in Table 1.
Table 1. Please click here to download this Table.
- Use the Spiral function in imaging software navigator mode to generate a large overview tilescan to create a reference map of the tissue (Figure 3B). Define the ROIs within the spiral overview, define the upper and lower Z planes to determine the Z stack. Press Start to obtain detailed three-dimensional (xyz) or four-dimensional Z-stacks (xyzt) of the tissue.
NOTE: During the entire imaging experiment the mouse should be closely monitored. For long imaging sessions, a pulse oximeter and temperature probe are recommended. The breathing of the mouse should be regular and at the same pace. If the mouse starts to show signs of gasping, the amount of isoflurane should be reduced. - At the end of each imaging session, keep the mouse on a heating pad until fully awake. If the mouse shows signs of discomfort or reduced mobility, keep the cage for a longer time on the heating pad and provide nutrient gels instead of the regular chow.
NOTE: In between imaging sessions, the mouse should be closely monitored for signs of discomfort such as decreased food and water consumption, rapid breathing, decreased movement, tremor, abnormal body posture, or unkept fur. In case of clear signs of discomfort, follow institutional guidelines regarding animal welfare and terminate the experiment when the humane endpoint is reached. - Repeat steps 4.1-4.12 for every repeated imaging session and use the overview tilescan to retrace the same position(s) over multiple time points (Figure 3B). Imaging frequency will depend on the research question and the timing of the studied process, and typically varies from imaging sessions twice a day to once per week.
- At the end of the desired experimental period, euthanize the animals with an implanted R.MIW using deep anesthesia with isoflurane followed by cervical dislocation. If desired, dissect the organs of interest for further ex vivo analyses.
- Alternatively, keep the animal alive for future in vivo analyses. In that case, remove the pouch suture holding the R.MIW by cutting it with spring scissors and carefully detach the window ring from the mouse skin using blunt forceps. Clean up the edges of the skin that previously held the window and proceed with a simple continuous suture (absorbable material, such as polyglycolic acid).
- Once the skin is closed, tie the beginning and ending suture threads with two square knots (4 throws). To minimize tissue ischemia, the knots should be loose enough to allow blood flow at the skin edge. Disinfect the wound with povidone-iodine to prevent inflammation and to promote healing of the skin.

Figure 3: Longitudinal IVM workflow. (A) Schematic depiction of a typical multi-day IVM experiment. (B) Imaging of a tumorigenic region within the adult mammary gland. Prior to each imaging session, a low-resolution overview tilescan (top panel) can facilitate the identification of the region(s) of interest over subsequent imaging days. The collagen I pattern (second harmonic generation, magenta), tissue structure and patterns of differentially labeled cells with fluorescent proteins (depicted in green, yellow, and red) can be used to retrace the same tissue area. Scale bars represent 1 mm (overview tilescan) and 100 µm (bottom panels). (C) Schematic representation of the R26-Confetti reporter construct. Upon tamoxifen-induced Cre-recombination, the Confetti construct stochastically recombines, resulting in the expression of one of the four fluorophores (nGFP, YFP, RFP, or mCFP). Please click here to view a larger version of this figure.
5. Opening and closing the lid of the R.MIW in between imaging sessions
- Maintain sterility by using sterile gloves, and sterilize all items that will come in contact with the mouse. Autoclave surgical tools prior to the surgery (see step 2 for details).
- Turn on the heating pad and cover the mat with a sterile drape and anesthetize the mouse in an induction chamber using a 3% of isoflurane/O2 mixture. Verify adequate anesthesia by performing a paw withdrawal reflex test.
- Transfer the mouse from the induction chamber to an anesthesia nose mask and reduce the isoflurane level to 1.5%-2% isoflurane/O2 mixture.
- Place the tips of thin forceps through the holes in the arms of the lid and loosen the lid by twisting the lid anti-clockwise. If needed, apply some pre-heated sterile PBS (37 °C) on the window to facilitate the loosening of the lid.
- Place the lid of the R.MIW in a sterile dish with sterile PBS until further use. Clean the coverglass of the lid with demi-water and subsequently 80% ethanol. Keep the lid in sterile PBS until further use.
- Prevent the exposed tissue from drying out by adding some drops of sterile PBS to the tissue surface.
- Apply or inject any substance or cells of interest on the exposed tissue, a maximum volume of 50 µL can be used. Wait a few minutes until the liquid is absorbed by the tissue. Alternatively, the tissue can be manipulated or repositioned using sterile, blunt forceps to optimize the imaging conditions for specific ROIs.
- Apply petroleum jelly to the inner rim of the R.MIW, making sure to avoid the underlying tissue. Position the lid into the R.MIW frame as described in step 3.9, place the tips of thin forceps through the holes in the arms of the lid, and tighten the lid by twisting the lid clockwise (approximately 5°).
Results
To study the proliferative dynamics of mammary epithelial cells during the different developmental stages of the mammary gland the described protocol was performed. The design of the R.MIW is depicted in Figure 1, and the procedure to implant an R.MIW is summarized in Figure 2. The R.MIW is surgically implanted between the mammary gland and the skin. A suture is used to hold within the window ring and prevent the mice from pulling on the sutures (Figure 2). The sutures holding the R.MIW are made of non-absorbable silk, which has hypoallergenic properties, a soft texture, and is easy to handle. The R.MIW ring is made of titanium, one of the most biocompatible materials that do not promote inflammation or necrosis after implantation21. If the aseptic conditions are followed and the sutures are well executed, the R.MIW mammary gland implantation poses a low risk of postoperative complications. Moreover, unlike abdominal imaging window implantation22, R.MIW implantation is not a limiting factor for mouse survival because the mammary gland is not a vital organ and allows daily imaging up to the limit specified in the ethical protocol. The only factor that limits the duration of window implantation is the homeostatic turnover of the skin, which will eventually lead to the sutures falling out after 4 - 6 weeks. Therefore, it is important to regularly inspect the stability of the sutures. If desired, the sutures can be removed and replaced by a new purse-string suture under aseptic conditions (as described in steps 3.5 - 3.8) to reassure window stability.
A major challenge when using the multiday imaging approach is retracing an ROI on consecutive days. To this end, a quick overview scan can be included before selecting the ROI(s) (Figure 3B). Multiple tissue landmarks can be used to retrace the same region of the tissue, including the collagen network signal (visualized by second harmonic generation), tissue structure, as well as local patterns of cells differentially or stochastically labeled with dyes or fluorescent proteins (Figure 3B). In this representative example, an R.MIW was implanted onto the 4th mammary gland of an MMTV-PyMT;R26-CreERT2het;R26-Confettihet female mouse at the onset of palpable tumor formation. Subsequently, stochastic recombination was induced by injection of 1.5 mg tamoxifen, resulting in recombination of the Confetti construct in some cells (Figure 3C). The recombined tumor cells were followed for a period of 20 days (Figure 3B,C). If imaging of the same region of the mammary gland over consecutive days is precluded, the window can be opened in an aseptic environment (as described in step 5.1) to further clear up, and reposition the tissue to improve visibility and image acquisition (Figure 3A).
Using this method, the developing mammary gland during puberty was followed at the single-cell level. Repeated IVM through an R.MIW was performed using R26-CreERT2het;R26-mTmGhet female mice between 4-6 weeks of age, in which all cells are labeled with membrane tdTomato (Figure 4A)23. Mice were injected with a low dose of tamoxifen (0.2 mg/25 g body weight), resulting in sporadic recombination of the mTmG construct, causing a change from red to green in some cells in all tissues, including the mammary gland (Figure 4B). The same ROIs were revisited over multiple days to visualize morphological changes within the mammary gland, including ductal elongation and ductal branching (Figure 4C) at a cellular resolution. Importantly, this combination of stochastic cell labeling and multi-day IVM also allows visualizing the dynamic changes of the ductal environment, such as the dynamics of single cells in the stroma surrounding the elongating and branching ducts (Figure 4D) as well as the cellular dynamics within the inguinal lymph node (Figure 4E).
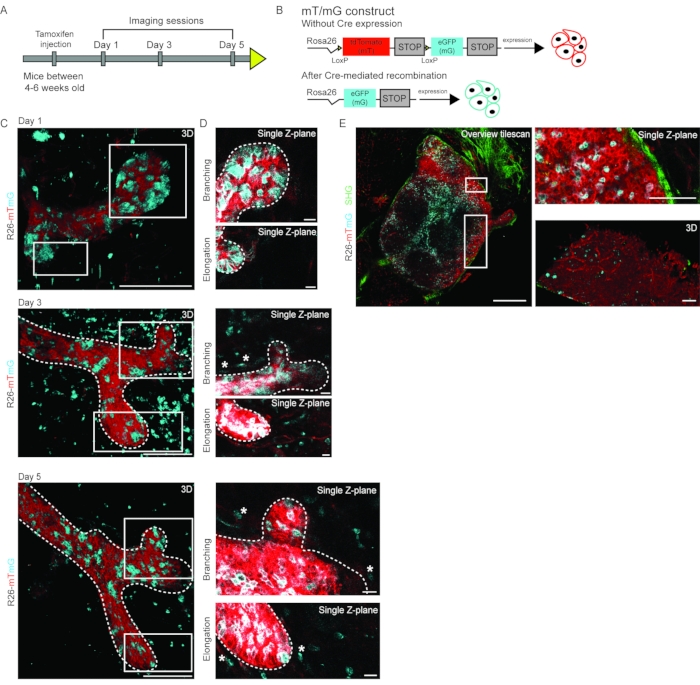
Figure 4: Multi-day IVM of pubertal branching morphogenesis. (A) Pubertal R26-CreERT2; R26-mTmG mice in age between 4-6 weeks were injected with a low dose of tamoxifen leading to Cre-mediated recombination of the R26-mTmG allele and were imaged on days 1, 3, and 5 to follow the dynamic changes in developing mammary gland. (B) Schematic representation of the R26-mTmG mouse construct, which in non-recombined conditions results in ubiquitous expression of membrane tdTomato (mT). Upon Cre-mediated recombination, mT is switched for membrane eGFP (mG) expression. (C) 3D rendering of an elongating and branching mammary duct over multiple days imaged through an R.MIW in an R26-CreERT2; R26-mTmG female mouse at 6 weeks of age. (D) Single Z-plane images of the branching tip (top panels) and the elongating branch (bottom panels). mT is depicted in red, and mG in cyan, scale bars represent 100 µm (A and B). Single cells in the stroma are highlighted by white asterisks. Note that signal intensity was manually increased to highlight the single cells in the stroma, leading to a slightly overexposed appearance of the mammary epithelial cells. (E) Representative images of the inguinal lymph node of an R26-CreERT2; R26-mTmG female mouse imaged through an R.MIW, showing an overview tile scan (left panel), zoom images (right panels) of a single Z-plane (top), and a 3D rendering (bottom). Second harmonic generation (collagen I) is shown in green, mT in red, and mG in cyan. Scale bars represent 500 µm (overview tilescan) and 100 µm (zoom images). Figure panels C and D are modified from Messal et al. 2. Please click here to view a larger version of this figure.
Similarly, in the adult mammary gland, the proposed R.MIW approach allows visualization of the same ductal structures over multiple days with uncompromised visibility. Even the use of less bright fluorescent reporter models24, such as the Cdh1-mCFP (Ecadherin-mCFP) mouse model, permits visualization of ductal stability and subtle morphological changes at a cellular resolution (Figure 5). Note that visibility between day 3 and day 5 improved significantly after tissue repositioning (Figure 5).

Figure 5: Multi-day imaging of the adult mammary gland. 3D rendered images of a mammary ductal structure of an adult female Cdh1-mCFP (cyan, marking the Ecadherin-positive luminal cells expression) mouse over multiple consecutive days. The collagen I pattern (second harmonic generation, magenta) was used to retrace the same ROI, and the Cdh1-mCFP signal was used to mark the ductal (luminal) cells. Note that visibility after day 3 was improved by the opening of the R.MIW lid and repositioning of the tissue. Scale bars represent 100 µm. Please click here to view a larger version of this figure.
To assess proliferative heterogeneity of the mammary epithelial cells during the hormonal cycle at the single-cell level, the photo-convertible Kikume Green-Red (KikGR) reporter mouse model25,26 was used, which has ubiquitous expression of the KikGR protein. KikGR is a bright fluorophore that undergoes green-to-red conversion upon exposure to violet light and the red/green ratio can be used as a proxy for the proliferative activity of a cell2 (Figure 6A,B). Using the R.MIW approach, we followed the same cells within the ductal tree of the adult mammary gland over several days and found previously unanticipated proliferative heterogeneity throughout the ductal tree (Figure 6C). High and low proliferative cells were equally distributed over the different converted areas (Figure 6C,D). Strikingly, at the local level, neighboring cells showed large differences in their red/green ratio (Figure 6C,D). Quantification of the red/green ratio of different cells (as a proxy for their proliferative activity) 10 days after photo-conversion, revealed highly variable dilution rates of some cells within the same ductal micro-environment (Figure 6E). Together, these data reveal a remarkable local proliferative heterogeneity within the adult mammary gland, and at the same time, a global uniform turnover rate.
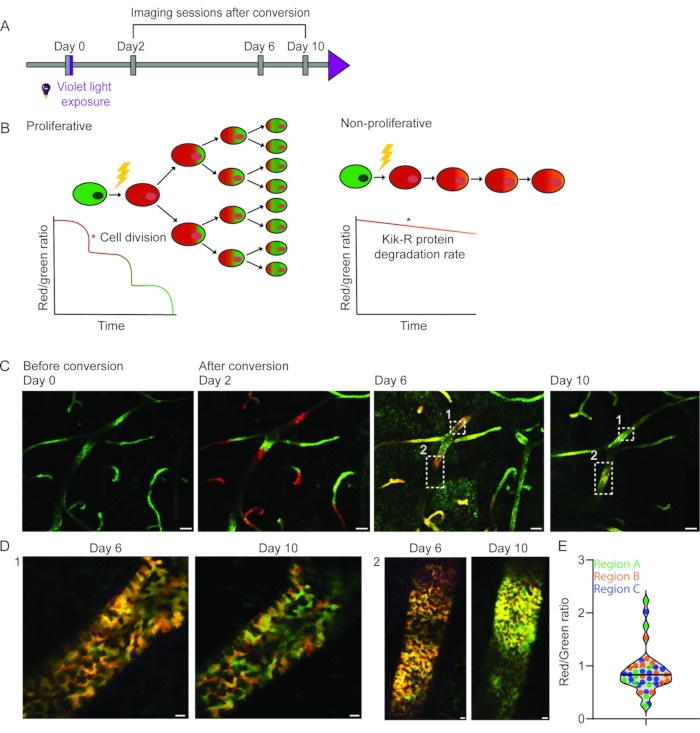
Figure 6: Longitudinal IVM of proliferative heterogeneity in the adult mammary gland using the KikGR mouse model. (A) KikGR mice were imaged at day 0 before and after exposure to violet light. The imaging sessions were repeated on days 2, 6, and 10 after conversion. (B) Schematic depiction of the hypothetical outcomes upon photo-conversion of KikGR mammary epithelial cells following proliferation (left panel) and no proliferation (right panel) as a function of time. (C) The same area of the mammary gland was imaged through an R.MIW over a period of 10 days. Smaller regions were photo-converted on day 0 and show a similar dilution rate of the Kikume red signal over time, indicating an equal turnover rate throughout the epithelium. (D) Zoom images (single Z-planes) of the indicated regions in panel C show proliferative heterogeneity at the cellular level 6 and 10 days after photo-conversion. Scale bars represent 100 µm (panel C) and 10 µm (panel D). (E) Quantification of the red/green ratio of randomly selected cells (n = 48 cells) in three photo-converted areas. A high red/green ratio is indicative of a low dilution rate and low-proliferative activity, whereas a low red/green ratio is indicative of a high dilution rate and proliferation. Figure panels C- E have been modified from Messal et al. 2. Please click here to view a larger version of this figure.
Discussion
The R.MIW allows longitudinal imaging of the healthy and diseased mammary gland in its native and minimally disrupted environment and permits repeated visualization of the mammary gland at diverse developmental stages. The R.MIW design allows the window to be opened at any point during the experiment. Long-term visual access to the tissue of interest may be hindered, for example, by the accumulation of cell debris on the coverslip. In such cases, the R.MIW can be opened before or immediately after an imaging session to allow cleaning of the entire visible tissue area and lid. The removable lid also allows manipulations of the tissue as well as local application of substances, such as specific inhibitors and therapies, labeling dyes, or specific cell types of interest.
This method overcomes the limitation of the previously described mammary skinflap procedures4,7,8,13, which are limited to one imaging session, and can visualize processes such as branching morphogenesis (Figure 5), homeostatic tissue turnover (Figure 6), or tumor growth at a cellular level (Figure 3B). Yet, at the same time, the R.MIW permits local manipulation of the tissue in between imaging sessions, which comprises a great asset of the R.MIW compared to the previously published MIW3,18 and all other imaging windows20,22. When opening the R.MIW, it is important to maintain aseptic conditions at all times to prevent any source of infection. The ability to open the R.MIW in an aseptic environment allows optimizing the imaging conditions prior to every imaging session, which greatly improves long-term visual access to the tissue of interest. Specifically, in the mammary gland, which is embedded in an adipocyte-rich stroma, this is of great value. Moreover, the replaceable lid could uniquely enable the local administration of therapeutics, different cell types, labeling dyes, image-guided microdissection, or any other local manipulation of the tissue without the need to terminate the IVM experiment. For instance, to study tumor initiation, specific cancer cell populations could be injected directly in the ductal tree or stroma at a determined IVM time-point and precise mammary gland location, as long as this ROI is accessible through the R.MIW ring. To study tumor progression, specific cancer cell populations (at a specific location, in a specific micro-environment, or with a specific behavior) could be photo-marked during the IVM session and subsequently microdissected using a fluorescent dissection microscope after the opening of the R.MIW. Isolated cells could be further processed for downstream analyses, such as (single-cell) mRNA sequencing. By using this approach, one could couple in vivo cell behavior to molecular expression profiles. The advantage of local drug administration enabled by the R.MIW allows the tissue to be imaged prior to and directly after treatment. The interval needed to remove the mouse from the imaging box and to subsequently perform local drug administration after opening the R.MIW lid can be performed in minutes, which allows the immediate phase capture of fast-acting drugs.
We show that IVM of the mammary gland through the R.MIW is compatible with many different fluorescent reporter mouse models. The adipose-rich environment is challenging to image, and therefore the use of bright fluorophores is recommended. However, as shown here, even less bright fluorophores such as mCFP can be visualized through the R.MIW in optimal imaging conditions. Inevitably, the fat pad will preclude the imaging of the deeper ductal structures, and limit the imaging to the more superficial ducts. A low-resolution overview image at the start of each IVM experiment will help to identify the ductal structures of interest that are sufficiently superficial for high-resolution imaging. Local tissue manipulation, removal of connective tissue, or repositioning of the adipose tissue after opening the R.MIW can optimize the IVM for specific ROIs that are overlaid by adipose tissue. This is an important advantage over all previous window designs, which do not allow to perform these manipulations and would require complete removal of the window itself. Specifically, for visualization of the inguinal lymph node, it is recommended to gently remove the overlying fatty tissue, which reduces light scattering and enables high-resolution imaging. When manipulating the tissue, always keep aseptic conditions and prevent bleeding or serious damage to the tissue, as they may affect the processes being studied during the IVM experiment.
The R.MIW is made of titanium, a material that is commonly used in clinical practice to replace hard tissues such as joints or bone plates. Titanium has several advantages over steel windows, including its lightweight and inert character21. Recently, several other materials were used to generate novel imaging window types, including the flexible silicon window20. In contrast to the R.MIW, the flexible window does not require any sutures for implantation and is suitable for nearly any anatomical position, specifically in the case of soft and fragile tissues. Silicon windows have a minimal impact on animal motility due to their lightweight and deformable nature and maybe more suited in experiments studying rapid tissue expansion and growth20. Another advantage over the titanium version is that silicon windows are compatible with other imaging modalities, including magnetic resonance imaging20,27. However, it will be important to keep in mind that objectives are optimized for 0.17 mm glass coverslips. Moreover, mammary tissue is susceptible to breathing movements, which are hard to restrict using the flexible window, especially when using an inverted microscope. Breathing artifacts are minimized by the R.MIW design and the fixation of the R.MIW in the inlay of the imaging box. As a result, images acquired using the proposed R.MIW setup are not distorted due to breathing artifacts. However, minor drifts in tissue localization can occur, which are usually gradual and can be corrected by using post-acquisition motion correction software28. With the increasing toolbox of IVM technologies2,20, the specific requirements for each experiment will eventually determine the best way of in vivo visualization of the tissue of interest. Different window designs have different advantages and disadvantages and depending on the research question, the available microscopy setup, the required spatial and temporal resolution, and the total time span of the studied process, the optimal approach needs to be determined.
In summary, the R.MIW facilitates high-resolution characterization of the cellular dynamics during mammary gland development, homeostasis, and disease over multiple days to weeks.
Disclosures
The authors have nothing to disclose
Acknowledgements
This work was supported by the Research Foundation Flanders (PhD grant fundamental research 11L7222N to M.C.), the Boehringer Ingelheim Foundation (PhD Fellowship to C.L.G.J.S), an EMBO postdoctoral fellowship (grant ALTF 1035-2020 to C.L.G.J.S.), and the Doctor Josef Steiner Award (to J.v.R).
Materials
| Name | Company | Catalog Number | Comments |
|---|---|---|---|
| 0.9% NaCl | BD | 306573 | Other brands available |
| 10 mm round coverglass | Fisher scientific | 10696365 | Other brands available |
| 5-0 braided silk suturs | Ethicon | W580 | |
| 80% Ethanol | homemade | NA | |
| Anesthesia induction box | Kentscientific | VetFlo-MSEKIT | |
| Buprenorphine (Vetergesic®) | Ecuphar | NA | |
| Cotton tips (sterile) | Fisher scientific | 13113743 | Other brands available |
| Cyanoacrylate adhesive | Loctite | NA | Other brands available |
| Eye ointment | Duratears | NA | |
| Flexible butterfly needle | Greiner Bio-One | 450120 | Other brands available |
| Graefe forceps (blunt) | Fine Science Tools | 11051-10 | |
| Heating pad | Kentscientific | RightTemp Jr. | Other brands available |
| Imaging box | Custom made | NA | |
| Infuse nutrient mixture | Braun | Nutriflex special 70/240 | |
| Insulin syringes | BD | 324911 | Other brands available |
| Inverted multi-photon microscope with automated stage | Leica Microsystems | NA | |
| Isoflurane vaporizer | Kentscientific | VetFlo-1231K | |
| Needle holder | Fine Science Tools | 12510-14 | |
| Parafilm | Sigma-Aldrich | P7793 | semi-transparent tape |
| Paper tape tesa | Tesa | NA | |
| Petroleum Jelly | Vaseline | NA | |
| Razor blades | Fisher scientific | 11904325 | Other brands available |
| Silicon tubing | Solutions Elastomeres | NA | Any houseware |
| Spring scissors (small) | Fine Science Tools | 15018-10 | |
| Sterile PBS | ThermoFisher Scientific | 10010023 | |
| Syringe (10 ml) | BD | 305482 | Other brands available |
| Thin forceps | Fine Science Tools | 11413-11 | |
| Titanium lid for mammary imaging window | Custom made | NA | |
| Titanium mammary imaging window | Custom made | NA | |
| Wooden sticks toothpicks | Fisher scientific | NC1678836 | Other brands available |
References
- Watson, C. J., Khaled, W. T. Mammary development in the embryo and adult: new insights into the journey of morphogenesis and commitment. Development. 147 (22), Cambridge, England. (2020).
- Messal, H. A., van Rheenen, J., Scheele, C. L. G. J. An Intravital Microscopy Toolbox to Study Mammary Gland Dynamics from Cellular Level to Organ Scale. Journal of Mammary Gland Biology and Neoplasia. 26 (1), 9-27 (2021).
- Kedrin, D., et al. Intravital imaging of metastatic behavior through a mammary imaging window. Nature Methods. 5 (12), 1019-1021 (2008).
- Dawson, C. A., Mueller, S. N., Lindeman, G. J., Rios, A. C., Visvader, J. E. Intravital microscopy of dynamic single-cell behavior in mouse mammary tissue. Nature Protocols. 16 (4), 1907-1935 (2021).
- Scheele, C. L., et al. Identity and dynamics of mammary stem cells during branching morphogenesis. Nature. 542 (7641), 313-317 (2017).
- Kotsuma, M., et al. Nondestructive, serial in vivo imaging of a tissue-flap using a tissue adhesion barrier. IntraVital. 1 (1), 69-76 (2012).
- Ingman, W. V., Wyckoff, J., Gouon-Evans, V., Condeelis, J., Pollard, J. W. Macrophages promote collagen fibrillogenesis around terminal end buds of the developing mammary gland. Developmental Dynamics: an official publication of the American Association of Anatomists. 235 (12), 3222-3229 (2006).
- Entenberg, D., et al. large-volume, high-resolution intravital imaging for tissue-wide analysis of single cell dynamics. Methods (San Diego, Calif). 128, 65-77 (2017).
- Masedunskas, A., Weigert, R., Mather, I. H. Intravital Imaging of the Lactating Mammary Gland in Transgenic Mice Expressing Fluorescent Proteins. Advances in Intravital Microscopy. , Springer. Netherlands. 187-204 (2014).
- Masedunskas, A., Chen, Y., Stussman, R., Weigert, R., Mather, I. H. Kinetics of milk lipid droplet transport, growth, and secretion revealed by intravital imaging: lipid droplet release is intermittently stimulated by oxytocin. Molecular Biology of the Cell. 28 (7), 935-946 (2017).
- Mather, I. H., Masedunskas, A., Chen, Y., Weigert, R. Symposium review: Intravital imaging of the lactating mammary gland in live mice reveals novel aspects of milk-lipid secretion. Journal of Dairy Science. 102 (3), 2760-2782 (2019).
- Stevenson, A. J., et al. Multiscale imaging of basal cell dynamics in the functionally mature mammary gland. Proceedings of the National Academy of Sciences. 117 (43), 26822-26832 (2020).
- Ewald, A. J., Werb, Z., Egeblad, M. Preparation of Mice for Long-Term Intravital Imaging of the Mammary Gland. Cold Spring Harbor Protocols. 2011 (2), 5562(2011).
- Ewald, A. J., Werb, Z., Egeblad, M. Monitoring of Vital Signs for Long-Term Survival of Mice under Anesthesia. Cold Spring Harbor Protocols. 2011 (2), 5563(2011).
- Harney, A. S., Wang, Y., Condeelis, J. S., Entenberg, D. Extended Time-lapse Intravital Imaging of Real-time Multicellular Dynamics in the Tumor Microenvironment. Journal of Visualized Experiments: JoVE. (112), e54042(2016).
- Harper, K. L., et al. Mechanism of early dissemination and metastasis in Her2+ mammary cancer. Nature. 540 (7634), 588-592 (2016).
- Sobolik, T., et al. Development of novel murine mammary imaging windows to examine wound healing effects on leukocyte trafficking in mammary tumors with intravital imaging. IntraVital. 5 (1), 1125562(2016).
- Shan, S., Sorg, B., Dewhirst, M. W. A novel rodent mammary window of orthotopic breast cancer for intravital microscopy. Microvascular Research. 65 (2), 109-117 (2003).
- Zomer, A., et al. Intravital imaging of cancer stem cell plasticity in mammary tumors. Stem Cells. 31 (3), 602-606 (2013).
- Jacquemin, G., et al. Longitudinal high-resolution imaging through a flexible intravital imaging window. Science Advances. 7 (25), (2021).
- Niinomi, M. Recent research and development in titanium alloys for biomedical applications and healthcare goods. Science and Technology of Advanced Materials. 4 (5), 445-454 (2003).
- Ritsma, L., et al. Surgical implantation of an abdominal imaging window for intravital microscopy. Nature Protocols. 8 (3), 583-594 (2013).
- Muzumdar, M. D., Tasic, B., Miyamichi, K., Li, N., Luo, L. A global double-fluorescent cre reporter mouse. Genesis. 45 (9), New York, N.Y. 593-605 (2007).
- Snippert, H. J., et al. Intestinal Crypt Homeostasis Results from Neutral Competition between Symmetrically Dividing Lgr5 Stem Cells. Cell. 143 (1), 134-144 (2010).
- Nowotschin, S., Hadjantonakis, A. K. Use of KikGR a photoconvertible green-to-red fluorescent protein for cell labeling and lineage analysis in ES cells and mouse embryos. BMC Developmental Biology. 9, 49(2009).
- Kurotaki, Y., Hatta, K., Nakao, K., Nabeshima, Y. I., Fujimori, T. Blastocyst Axis Is Specified Independently of Early Cell Lineage But Aligns with the ZP Shape. Science. 316 (5825), New York, N.Y. 719-723 (2007).
- Heo, C., et al. A soft, transparent, freely accessible cranial window for chronic imaging and electrophysiology. Scientific Reports. 6, 27818(2016).
- Warren, S. C., et al. Removing physiological motion from Intravital and clinical functional imaging data. eLife. 7, 35800(2018).
Reprints and Permissions
