This manuscript describes a novel direct plant infusion device for screening the effectiveness of molecules against the bacteria (Candidatus Liberibacter asiaticus) or its insect vector (Diaphorina citri, Kuwayama) that, in combination, are associated with Huanglongbing citrus disease.
Method Article
Direct Infusion Device for Molecule Delivery in Plants
In This Article
Summary
Abstract
Testing the function of therapeutic compounds in plants is an important component of agricultural research. Foliar and soil-drench methods are routine but have drawbacks, including variable uptake and the environmental breakdown of tested molecules. Trunk injection of trees is well-established, but most methods for this require expensive, proprietary equipment. To screen various treatments for Huanglongbing, a simple, low-cost method to deliver these compounds to the vascular tissue of small greenhouse-grown citrus trees infected with the phloem-limited bacterium Candidatus Liberibacter asiaticus (CLas) or infested with the phloem-feeding CLas insect vector Diaphorina citri Kuwayama (D. citri) is needed.
To meet these screening requirements, a direct plant infusion (DPI) device was designed that connects to the plant's trunk. The device is made using a nylon-based 3D-printing system and easily obtainable auxiliary components. The compound uptake efficacy of this device was tested in citrus plants using the fluorescent marker 5,6-carboxyfluorescein-diacetate. Uniform compound distribution of the marker throughout the plants was routinely observed.
Furthermore, this device was used to deliver antimicrobial and insecticidal molecules to determine their effects on CLas and D. citri respectively. The aminoglycoside antibiotic streptomycin was delivered into CLas-infected citrus plants using the device, which resulted in a reduction in the CLas titer from 2 weeks to 4 weeks post treatment. Delivering the neonicotinoid insecticide imidacloprid into D. citri-infested citrus plants resulted in a significant increase in psyllid mortality after 7 days. These results suggest that this DPI device represents a useful system for delivering molecules into plants for testing and facilitate research and screening purposes.
Introduction
The management of plants in commercial and landscape settings often requires the use of chemical compounds to optimize the plant growth and health. How these molecules are delivered depends on the type of molecule, the function of the molecule, the type of plant, and the management system in place. Foliar and soil applications are the easiest delivery strategies, but limitations in the uptake of some molecules necessitate direct delivery. An example of these molecules is therapeutic molecules that function best when they move systemically within the plant but cannot be effectively delivered by simple topical applications1. This is the case with Huanglongbing (HLB), also called citrus greening disease. HLB is a disease associated with a phloem-limited bacterium, Candidatus Liberibacter asiaticus (CLas), which cannot be cultured outside of the plant, or its insect vector, Diaphorina citri Kuwayama (D. citri)2.
If the putative therapeutic molecules are gene products, they can be tested by creating transgenic plants expressing these compounds. However, transgenic plant production can be time- and resource-intensive, is highly genotype-dependent, and can be inhibited by gene silencing3. In addition, even if these transgenics show promising results, regulatory and public perception constraints reduce the likelihood of their commercial acceptance4,5. The exogenous application of compounds, however, simplifies the testing of biological and synthetic molecules because it does not require the production of stable or transiently expressing transgenic plants, which reduces the time and resources for testing a molecule's effects. A method for the effective and efficient systemic plant delivery of exogenous compounds could be used for a wide variety of research and screening purposes.
One of these applications is the analysis of systemic molecule movement within a plant's vascular system, which can be done using trackable markers, whether they are fluorescent, visible, or unique chemical isotopes6,7,8,9. One commonly used fluorescent marker is 5,6-carboxyfluorescein-diacetate (CFDA), which is a membrane-permeable dye that is degraded by intracellular esterases into 5,6-carboxyfluorescein (CF) and, subsequently, becomes fluorescent and membrane-impermeable10. CFDA has been extensively used to monitor phloem transport, sink and source relationships, and vasculature patterning in plant tissue11,12.
In addition to these markers, certain compounds may directly alter the plant's physiology to increase the productivity or kill the plant in the case of herbicides. Both insecticides and antimicrobial compounds are a means of increasing plant productivity, especially in the presence of HLB. An example of an antimicrobial molecule that is used to control CLas is streptomycin. Streptomycin is an aminoglycoside antibiotic that was originally isolated from Streptomyces griseus and has been shown to inhibit bacterial growth through the inhibition of protein biosynthesis13. In terms of insecticides, the main target for HLB research is D. citri, which transmits CLas from tree to tree14. For this purpose, neonicotinoids, such as imidacloprid, are commonly utilized, as they are the gold standard for controlling insect pests15. All these varied uses are important aspects of current plant management strategies, and the development of novel products is dependent on efficient screening assays.
One method that is used for the introduction of compounds into woody plants is direct injection into the trunk. A variety of systems have been designed that vary in their needs for predrilled injection sites, and these systems utilize either pressure-based injection or passive flow16. Although pressure-based systems allow for the quick introduction of a given compound, the potential physical damage caused by forcing liquid through blocked or embolized vasculature needs to be considered17. Although the foliar or drench application of compounds is less time-intensive to implement, direct plant injection reduces waste of the compound of interest due to losses to the air or soil and can also lengthen the time that compounds are in an active state by reducing the exposure to the outside environment18. Both these aspects are important for preserving expensive reagents and ensuring consistency among replicates in research settings.
This study describes the design, construction, and use of an innovative direct plant infusion (DPI) device, which can be used to assess how compounds of interest affect a host plant. A standard 3D printer was used to manufacture both the device itself and several components associated with its construction. This in-house construction method allows researchers to modify the device and device components based on their specific experimental needs and reduces the reliance on commercially available plant injection devices. The device setup is simple and efficient, and all the auxiliary components are readily available and inexpensive. Although the system was designed for use with a variety of plant species, the examples presented here pertain to potted citrus plants. Additionally, this study demonstrates that this device is capable of efficiently delivering multiple types of compounds systemically to young citrus plants without causing lethality. The compounds tested included CFDA, which was used to assess the compound distribution in the plant, and streptomycin and imidacloprid, which were used to verify that the antimicrobial and insecticidal effects of these compounds were observed when delivered via DPI.
Protocol
1. Production of citrus plants for experimental compound injection
- Propagate small potted citrus trees from either rooted vegetative cuttings or seeds. Grow the potted citrus lines under a 16 h/8 h light/dark day length and at 28 °C.
- Select citrus plants of the appropriate size for the experiment. The described applications required the plants to be between 12 cm and 100 cm in height with trunk diameters of 4-14 mm. If new flush growth is required, cut back the plants prior to the experiment.
2. Three-dimensional printing of the DPI device and mold components
- Apply a thin layer of polyvinyl acetate-based glue to the print bed.
- Load nylon filament into the 3D printer, and prepare the printer according to the manufacturer's instructions. Import the desired .STL file (Supplementary File 1, Supplementary File 2, Supplementary File 3, Supplementary File 4, Supplementary File 5, Supplementary File 6, Supplementary File 7, Supplementary File 8, Supplementary File 9, Supplementary File 10, Supplementary File 11, Supplementary File 12, Supplementary File 13, and Supplementary File 14), set up, and start printing.
- Remove the piece from the print bed. Rinse the polyvinyl acetate-based glue from the base of the printed component with water, and remove any support structures.
- Spray the DPI component with two coats of clear gloss spray paint.
3. Fabrication of the plastisol ring mold
- Assemble a mold form large enough to hold the pattern pieces by building a rectangular enclosure using snap-together plastic blocks on a base (Supplementary Figure S1A).
- Mix the RTV silicone monomer and the catalyst together at a 10:1 ratio, and stir without introducing bubbles for 1 min. Color by adding food coloring (3 drops/25 mL of silicone mixture) and hand soap (1 mL of soap/25 mL of silicone mixture) (Supplementary Figure S1B).
- Pour a thin layer of silicone into the mold form that is sufficient to completely cover the bottom. Tamp to flatten the surface, and wait 24 h for the silicone to set (Supplementary Figure S1C).
- Pour a second layer of silicone, as described above, that is deep enough to cover the center hole core print on the pattern (visible at the top of the pattern in Supplementary Figure S1D). Insert the pattern into the liquid silicone with the center hole core print facing down. Ensure that no bubbles are trapped and that the patterns are well separated and not touching (Supplementary Figure S1E).
- Secure the patterns with either a heavy object and/or tape to prevent them from floating out of the silicone while it sets. Wait 24 h for the newly poured layer to set (Supplementary Figure S1F).
- Pour additional layers of silicone until the level is flush with the top of the pattern. Wait 24 h to cure (Supplementary Figure S1G).
- Disassemble the snap-together plastic blocks to release the mold. Remove the patterns (Supplementary Figure S1H). Inspect the mold for tears or deformities (Supplementary Figure S1I).
4. Casting of the plastisol rings
- Coat the interior of the mold, all the core components, and the O-rings with cooking oil (Supplementary Figure S2A, B). Place an O-ring around the notch in the middle of the center post core, and place the core in the center hole of the plastisol ring mold (Supplementary Figure S2C).
- Insert the delivery channel core into the hole on the side of the plastisol ring mold. Orient the V-shaped tip at the end of the delivery channel core to align with the O-ring on the center post core (Supplementary Figure S2D,E).
- Heat plastisol in the microwave for short 10 s bursts (Supplementary Figure S2F, G). Stir plastisol gently to avoid bubbles (Supplementary Figure S2H). Repeat the heating and stirring until the solution reaches a temperature between 160 °C and 170 °C (Supplementary Figure S2I).
CAUTION: Overheating of the plastisol can lead to the release of toxic fumes. Perform the procedure in a well-ventilated area or fume hood. Do not heat the plastisol over 170 °C. - Pour the molten plastisol into the plastisol ring mold near the outside edge of the mold without introducing bubbles (Supplementary Figure S2J). Wait 1 h for the plastisol rings to cool (Supplementary Figure S2K). Remove the rings from the mold. Ensure proper fit with the DPI device before use in experimental assays (Supplementary Figure S2L).
5. Attachment of the DPI device to the plant
- Find a smooth, healthy site on the trunk for the device attachment. Avoid any bumps or knots, as these can contribute to device leakage.
- Use a 2 mm diameter drill bit to drill a hole horizontally through the center of the stem at a 90° angle with the trunk surface (Supplementary Figure S3A). Run the drill bit through the hole several times to clean and smooth it to create an unobstructed hole (Supplementary Figure S3B).
- Create a vertical slice in the plastisol ring on the opposite side of the compound delivery channel (Supplementary Figure S3C). Fit the ring around the plant, and line the delivery channel up with the previously drilled hole (Supplementary Figure S3D).
NOTE: The ring must fit snugly around the trunk to avoid leakages; core assemblies with various diameters can be used to make plastisol rings for different-sized plant stems. - Add the DPI device to the plastisol ring, ensuring they fit snugly together. Align the DPI device spout with the plastisol ring delivery channel and drilled hole (Supplementary Figure S3E).
NOTE: Using a drill bit to line up the hole and the DPI device spout can be helpful. - Wrap tightly with silicone tape to hold the apparatus in place (Supplementary Figure S3F). Inspect the fully assembled and attached device to ensure proper alignment and orientation on the plant.
6. Applying the compound of interest using the DPI device
- Use a syringe or pipette to fill the DPI device with the solution of interest (Supplementary Figure S3G). Use a syringe to penetrate the silicone tape and plastisol ring on the opposite side of the DPI device to pull air out of the interior channel and avoid the introduction of air bubbles into the plant vasculature (Supplementary Figure S3H). Replace any extracted compound back into the DPI device.
- Add an additional small patch of silicone tape over the hole created by the syringe to reinforce the area and prevent tears. Inspect the apparatus for visible leakages at the attachment point, and inspect the device reservoir for a stable liquid level.
NOTE: Water can be used initially to test for leaks to avoid waste of test solution. - Cover the open end of the DPI device with wax sealing film, and pull down to form a seal and reduce the evaporation of the experimental compound. Poke a single hole in the wax film with a syringe tip to prevent the development of a vacuum, and subsequently refill the device (Supplementary Figure S3I).
- Check the apparatus daily to ensure proper alignment of the components (Supplementary Figure S3J), and top off the liquid using a syringe to avoid the reservoir running dry. Repeat this process until the desired amount of experimental solution has been introduced.
NOTE: Compounds can be successfully introduced from a given device for up to 1 month. Solution uptake durations that exceed this time frame should be tested empirically before the experimental setup.
7. Using CFDA to observe vascular movement with citrus plants
- Attach the DPI device to 25 cm tall citron (Citrus medica L.) plants, apply a single 2.0 mL treatment of either 20% DMSO in H2O control or CFDA to the DPI device, and allow it to uptake for 24 h. To follow this protocol, prepare the working CFDA solution by adding 1.6 mL of H2O to 400 µL of CFDA stock solution (the stock solution contains 10 mM CFDA dissolved in 100% dimethyl sulfoxide [DMSO]) to generate a final CFDA concentration of 2 mM and 20% DMSO.
- Make cross-sections of various tissues of the plant, and use a stereoscope or compound microscope with a fluorescent filter that includes the 498 nm wavelength to visualize the CFDA in the plant tissues. Compare the images to the 20% DMSO in H2O controls to account for autofluorescence in the tissue.
8. Measuring changes in the CLas titer in leaf samples following streptomycin treatment
- Using 0.75 m tall greenhouse-grown CLas-infected Valencia (Citrus sinensis (L.) Osbeck "Valencia") plants, collect the petiole and midrib of two HLB symptomatic leaves from each plant, chop them into small sections, pool each tissue type, and store them separately in 2 mL impact-resistant sample tubes containing a steel ball of 6.35 mm in diameter.
- Grind the sample using a homogenizer programmed for two 15 s cycles at 3.4 m/s. Extract the total nucleic acid as described previously19.
- Perform qPCR on the CLas-infected leaf samples using the qPCR mix defined in Table 1 and the reaction conditions defined in Table 2. Use plants showing robust CLas infections (robust infection is generally defined as qPCR-based Ct values < 30 for the CLas 16S LasLong (LL) primer set) for further analysis.
NOTE: The bacterial titer is estimated using CLas 16S Las Long (LL) and citrus dehydrin DNA primers to estimate the relative genome equivalents, as described previously20. - Outfit the citrus plants that meet the minimum infection titer outlined above with DPI devices, and subject them to a one-time treatment of 2.0 mL of either H2O solution or streptomycin solution at the desired concentration. To follow this study, use a single 2.0 mL treatment of 9.5 mg/mL (19 mg in total) streptomycin dissolved in H2O.
- Collect leaf samples at 7 days, 14 days, and 28 days post treatment. Assay the sampled leaves for the CLas titer using the same protocol as described above.
- At 60 days post treatment, obtain photographs of the plants treated with H2O or streptomycin. Use visual observations of the CLas infection to score the infection severity. Look for <50% of leaves showing interveinal chlorosis and vein corking along with leaf flush growth as signs of mild infection and greater than 50% of leaves with interveinal chlorosis and vein corking as well as leaf abscission and stunting of the plant growth as signs of more severe infections.
9. Measuring the mortality of D. citri following imidacloprid treatment
- Prune 0.5 m tall citron (Citrus medica L.) plants to a height of 12 cm to encourage the growth of new flush.
NOTE: The speed of flush growth can be dependent upon the plant health and time of year; so, take this into account during experimental design. - After >6 flush, 1-2 cm in length, have developed, introduce the plants into cages containing adult D. citri. Leave the plants in the cages for 24 h to allow for the deposition of eggs.
- Conduct representative egg counts on three flush shoots 1-2 days after laying, and subsequently apply the DPI devices. Fill these devices with 2.0 mL of either a water control or the desired concentration of imidacloprid (21.8% active ingredient). To follow this protocol, use 528 µL/L, 52.8 µL/L, and 5.28 µL/L of imidacloprid.
NOTE: Egg counts are a destructive measure, so the counts at this stage are used to estimate the number of eggs on the uncounted flush of the same plant and help provide a baseline for the subsequent nymph emergence counts that are conducted at the end of the experiment. - Collect the D. citri emergence rate on at least three of the remaining flush shoots. Acquire representative plant photographs 7 days after compound introduction.
Results
Direct infusion device components
The base version of the direct infusion device is 8 cm tall and 3.3 cm wide at the front and side (Figure 1A). It contains a single central reservoir that is contiguous with the spout, and the total volume that can be contained within these components is 2.0 mL (Figure 1D). The plastisol ring is 1.8 cm tall and has a diameter of 2.7 cm (Figure 1C). This ring also contains two channels: one to accommodate the DPI device spout and another of variable diameter that fits around the trunk of the tree being treated. Additionally, there is a groove around the vertical channel to direct excess treatment to surround the tree, which allows for additional compound uptake through the bark (Figure 1F). When assembled properly, the plastisol ring should be flush against the DPI device, and the spout should line up with the hole drilled in the tree (Figure 1B and Figure 1E).
CFDA
To investigate the effectiveness of the DPI device for introducing exogenous chemicals into citrus plants, 2.0 mL of 2 mM CFDA was infiltrated using the device. A fluorescence signal was detected in the vasculature of the treated plant (Figure 2A) but was absent in the control plants treated with 20% DMSO in H2O (Figure 2B). This signal was observed in all the dissected plant tissue types, including the leaf mesophyll, petiole vasculature, stem vasculature, and root vasculature (Figure 2C). This signal was observed in the plant within 24 h of treatment and was distributed relatively evenly throughout the tissues.
Streptomycin
To test whether the introduced compounds had a therapeutic effect on HLB disease, 2.0 mL of a bactericidal compound, streptomycin, was introduced into CLas-positive Valencia (Citrus sinensis) sweet orange plants at a concentration of 9.5 mg/mL (19 mg in total). These plants were maintained in greenhouse pots, and the CLas titer (measured by CLas genome equivalents per citrus genome equivalents) was monitored over time using qPCR (Figure 3A). The initial average DNA CLas titers for the streptomycin- and H2O-treated plants were 0.562 CLas genome/citrus genome and 0.49 CLas genome/citrus genome, respectively. Reductions in the mean bacterial titer were detected by qPCR 7-28 days after streptomycin treatment when compared to the H2O controls at the same time point. In addition, the difference between the time 0 and day 28 mean bacterial titers were 0.314 and 0.117 for streptomycin-treated plants and H2O-treated plants, respectively.
This experiment was designed to measure the response of the plant to different treatments over different time periods. A two-factor quadratic response surface design was used, with time treated as a quantitative discrete factor with four levels (0 days, 7 days, 14 days, and 28 days) and treatment as a categorical factor with two levels (H2O and streptomycin). Five replicates were used for each of the eight treatment combinations, and the CLas titer was measured as the response variable. The data were transformed using log10 based on a Box-Cox plot analysis. Model reduction was performed by forward selection using Akaike's information criterion (AICc)21, which resulted in the removal of both the time and interaction effects. The remaining factor, treatment, was significant (p = 0.0252), with streptomycin-treated plants showing a lower mean CLas titer (0.349) than the H2O-treated plants (0.496) over all the time points combined (Figure 3B). This reduction in CLas titer corresponded to occasional increases in new healthy flush growth after 60 days in the streptomycin-treated plants, as evidenced by photographs of representative trees treated with H2O (Figure 3C) versus 19 mg of streptomycin (Figure 3D).
Imidacloprid
Imidacloprid was introduced into juvenile Asian citrus psyllid (ACP)-infested citron plants using the DPI device to test its potential as a D. citri insecticidal screening assay. A single 2.0 mL treatment of a commercial imidacloprid insecticide solution was tested at three different concentrations (5.28 µL/L, 52.8 µL/L, and 528 µL/L), along with a water control. The average total egg count per three flush shoots prior to treatment ranged from 280.5 to 321, and there were no significant differences between the plants to be used for each treatment group (Figure 4A). The average total surviving nymphs on three flush shoots 7 days after treatment were 293.75, 268, 97.5, and 2 for the water control and 5.28 µL/L, 52.8 µL/L, and 528 µL/L imidacloprid solutions, respectively (Figure 4B). This represented a significant reduction in psyllid nymph emergence at the 52.8 µL/L (p = 0.029) and 528 µL/L (p =0.002) imidacloprid solution levels when compared to the water control according to a one-way ANOVA followed by a Tukey's post-hoc analysis. Additionally, this increase in psyllid nymph mortality at the highest imidacloprid solution level was visually apparent by the reduction in nymph honeydew production on the imidacloprid-treated lines (Figure 4D) when compared to the water control (Figure 4C).

Figure 1: The direct plant infusion device and plastisol ring. (A) The intact direct plant infusion device and (C) plastisol ring along with their dimensions. (B) The direct plant infusion device and plastisol ring connected and attached to a citrus tree. Vertical cross sections of the (D) direct plant infusion device, (F) plastisol ring, and (E) these two components connected and attached to a citrus tree. Please click here to view a larger version of this figure.

Figure 2: Cross-section of the leaf midrib of a 25 cm citrus plant. Images showing 24 h after treatment with (A) 2 mM CFDA or (B) 20% DMSO in H2O using the direct plant infusion device. (C) Cross-sections of various plant tissue 24 h after 2 mM CFDA treatment, including the trunk 5 cm above the direct plant infusion device (top left), the trunk 5 cm below the direct plant infusion device (middle left), the root (lower left), the leaf midrib (upper right), the leaf petiole (middle right), and the leaf mesophyll (lower right). Scale bars = 1 mm. Abbreviations: CFDA = 5,6-carboxyfluorescein-diacetate; DMSO = dimethyl sulfoxide. Please click here to view a larger version of this figure.
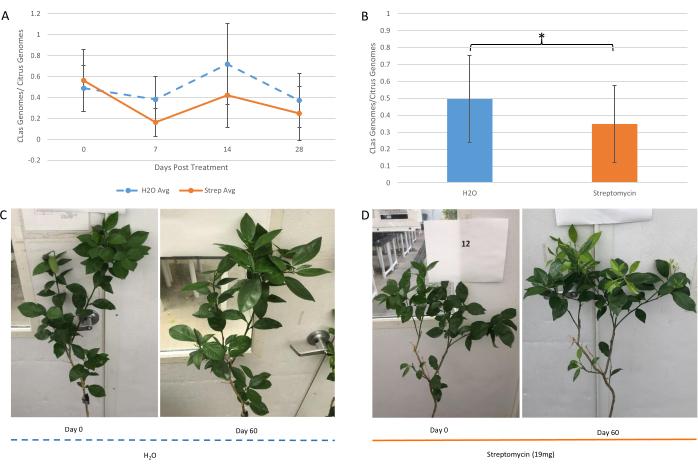
Figure 3: Monitoring the CLas titer (measured by CLas genome equivalents per citrus genome equivalents) over time using qPCR. (A) Time course showing changes in the CLas DNA titer comparing the five plants treated with 19 mg of streptomycin with the five plants treated with an H2O control. The points represent the average for a given treatment at a given time point. The error bars represent the standard error of the mean. (B) Bar graph showing the mean CLas titer of the H2O- and streptomycin-treated plants across all time points. The error bars represent the 95% confidence interval, and the asterisks denote significant differences (* = p < 0.05) between the mean CLas titers for the streptomycin- and H2O-treated plants according to a one-way ANOVA. (C) Representative images of citrus plants 0 months and 2 months after direct plant infusion treatment with either (C) H2O or (D) streptomycin. The plants treated with streptomycin show new light green leaf flush growth after 2 months, which is suggestive of a reduction in the CLas titer. Abbreviation: CLas = Candidatus Liberibacter asiaticus. Please click here to view a larger version of this figure.
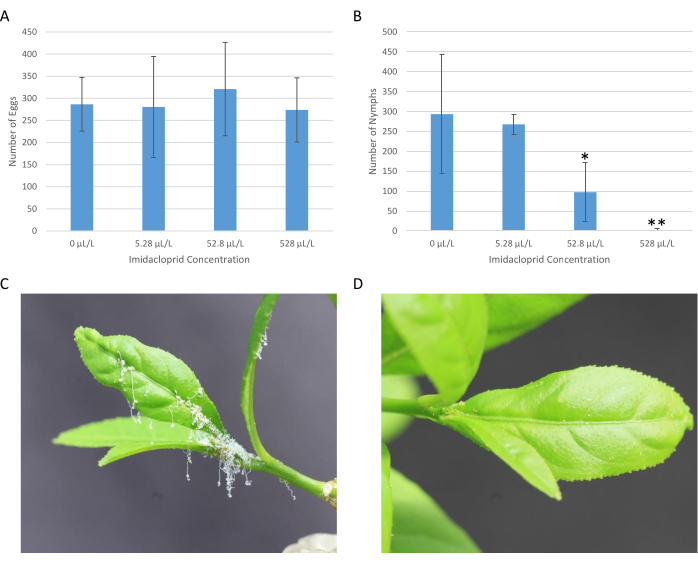
Figure 4: Monitoring the psyllid nymph mortality in juvenile ACP-infested citron plants. Bar graphs showing (A) the estimated initial egg counts and (B) the surviving D. citri nymphs on three citrus flush 7 days after treatment with a water control and various dilutions of imidacloprid. The error bars represent the standard error of the mean, and the asterisks denote significant differences (* = p < 0.05, ** = p < 0.01) between a given treatment level and the water control according to a one-way ANOVA followed by a Tukey's post-hoc analysis. Images of D. citri nymph-infested citrus flush 7 days after treatment with either (C) the water control or (D) 528 µL/L imidacloprid using the direct plant infusion device. Abbreviations: ACP = Asian citrus psyllid; D. citri = Diaphorina citri Kuwayama. Please click here to view a larger version of this figure.
| Volume per sample (µL) | Component | |||||
| 12.5 | 2x GoTaq qPCR with BRYT Green Dye Master Mix | |||||
| 5 | DNA Template (20 ng/µL) | |||||
| 0.5 | 10 µM Primer F and R for CLas | Clas: CTTACCAGCCCTTGACATGTATAGG (Forward); TCCCTATAAAGTACCCAACATCTAGGTAAA (Reverse) | ||||
| 0.5 | 10 µM Primer F and R for Citrus housekeeping | Citrus dehydrin: TGAGTACGAGCCGAGTGTTG (Forward); AAAACTTCACCGATCCACCAG (Reverse) | ||||
| 6.5 | H2O | |||||
Table 1: The qPCR mix used to quantify the CLas titer in streptomycin-treated citrus lines. The sequence of the 16S Las Long primers and citrus dehydrin primers for CLas DNA quantification and citrus DNA quantification are shown.
| Step | Temperature (°C) | Time | |
| 1 | Initial Denature | 95 | 2 min |
| 2 | Denature | 95 | 15 s |
| 3 | Annealing | 60 | 20 s |
| 4 | Extension | 72 | 20 s |
| 5 | Go to Step 2, Repeat 39x | ||
| 6 | Melt Curve | 60 ramping to 95 at 0.2 °C/s | 3 min |
Table 2: Reaction conditions for the qPCR used to quantify the CLas titer in streptomycin-treated citrus lines.
Supplementary Figure S1: Images showing the assembly process of the mold to generate the plastisol ring. (A) Snap-together plastic blocks were used to generate the first layer of the plastisol ring mold. (B) Uniformly mixed solution containing the silicone RTV rubber, catalyst, food coloring, and soap. (C) Evenly poured first layer of the plastisol ring mold. (D) Picture of the plastisol ring patterns with the center hold core print at the top. (E) Plastisol ring patterns inserted into the uncured second layer of the mold. (F) Masking tape and rubber mallet used to secure the patterns as the second layer cures. (G) Third layer of the mold added until it is flush with the top of the patterns. (H) Removing the patterns from the mold. (I) Fully constructed plastisol ring mold. Please click here to download this File.
Supplementary Figure S2: Images showing the assembly process of the plastisol ring associated with the direct plant infusion device. (A) Plastisol ring assembly components, including the mold, the center core with an O-ring, and the delivery channel core. (B) Coating the cores in non-stick spray cooking oil to facilitate the removal of the plastisol ring after hardening. (C) Insertion of the center core and O-ring into the mold. (D) Insertion of the delivery channel core perpendicular to the center core. (E) Proper assembly of the plastisol ring core components in the mold cavity. (F) Plastisol used for the generation of the plastisol ring. (G) Heating the plastisol in the microwave. (H) Stirring the plastisol after heating. (I) Checking the plastisol temperature. (J) Pouring the heated plastisol into the assembled core. (K) Allowing for the cooling of the plastisol around the assembled core. (L) Fully assembled plastisol rings attached to the direct plant infusion device. Please click here to download this File.
Supplementary Figure S3: Images showing the assembly process of the direct plant infusion device. (A) Drilling a hole through the center of the citrus plant to create a channel for compound delivery. (B) Frontal view of the drilled hole. (C) Slicing through the plastisol ring with a razor blade opposite the compound delivery channel. (D) Fitting the plastisol ring tightly around the stem at the site of the previously drilled hole. (E) Fitting the direct plant infusion device to the plastisol ring, with the compound delivery spigot on the device inserted into the channel of the plastisol ring. (F) Using silicone tape to secure the direct plant infusion device to the plastisol ring and hold the entire apparatus in place. (G) Filling the direct plant infusion device chamber with the compound of interest. (H) Using a syringe to pull air from the drilled hole in the plant and start the flow of the compound. (I) Applying wax sealing film to the opening in the direct plant infusion device chamber and poking a hole to prevent a vacuum. (J) Fully assembled direct plant infusion device on a citrus plant. Please click here to download this File.
Supplementary File 1: The plastisol ring center post core .STL file for a 4 mm tree. Please click here to download this File.
Supplementary File 2: The plastisol ring center post core .STL file for a 6 mm tree. Please click here to download this File.
Supplementary File 3: The plastisol ring center post core .STL file for an 8 mm tree. Please click here to download this File.
Supplementary File 4: The plastisol ring center post core .STL file for a 10 mm tree. Please click here to download this File.
Supplementary File 5: The plastisol ring center post core .STL file for a 12 mm tree. Please click here to download this File.
Supplementary File 6: The plastisol ring center post core .STL file for a 14 mm tree. Please click here to download this File.
Supplementary File 7: The plastisol ring delivery channel core .STL file for a 4 mm tree. Please click here to download this File.
Supplementary File 8: The plastisol ring delivery channel core .STL file for a 6 mm tree. Please click here to download this File.
Supplementary File 9: The plastisol ring delivery channel core .STL file for an 8 mm tree. Please click here to download this File.
Supplementary File 10: The plastisol ring delivery channel core .STL file for a 10 mm tree. Please click here to download this File.
Supplementary File 11: The plastisol ring delivery channel core .STL file for a 12 mm tree. Please click here to download this File.
Supplementary File 12: The plastisol ring delivery channel core .STL file for a 14 mm tree. Please click here to download this File.
Supplementary File 13: The direct plant infusion device .STL file. Please click here to download this File.
Supplementary File 14: The pattern used to create the mold for the plastisol ring .STL file. Please click here to download this File.
Discussion
For the DPI device to be considered a viable method for exogenous compound delivery into plants, it must contribute to robust and consistent compound uptake into a variety of tissue types. The experiment utilizing CFDA clearly showed both acropetal and basipetal compound movement, as well as in both the vascular system and mesophyll cells of the leaf. Additionally, and presumably because the bored hole used in this DPI device provides a large amount of surface area for compound uptake, the CFDA was present in relatively equal amounts in all sections of the stem, not just in a small subset of the vasculature adjacent to the device, as has been seen in previous dye uptake studies in plants using trunk injection6. Additionally, the delivery of green fluorescent protein and floral dye was tested using the DPI device, and a distribution of these compounds similar to CFDA was observed (data not shown). These data suggest that the device can be used to systemically deliver a variety of compounds that vary in size and molecular structure. However, it is worth noting that there were differences in the compound uptake based on the leaf development stage, with younger developing leaves taking up more compound than older established leaves. This may be due to the changes in the vasculature properties present in sink versus source tissue and should be optimized for a given experiment.
The DPI device showed sufficient compound uptake for the visualization of CFDA, GFP, and floral dye, and it also took up enough to show the antibacterial and insecticidal effects of streptomycin and imidacloprid, respectively. Both these compounds resulted in changes in the target organism viability 1 week after a single 2.0 mL treatment. These data suggest that the DPI device could be used in whole-plant assays to test the viability of a wide variety of compounds for the control of microbial and insect pests. Moreover, due to its direct contact with the vascular system, this device may even provide an opportunity to test compounds that are not efficiently taken up by the roots or epidermal cells. Of particular interest would be RNA interference (RNAi), as this could be used to modulate the gene expression within the host plant, pathogen, or pathogen vector. Previous research that introduced hairpin RNA through a drilled hole in the trunk of apple and grape plants showed that the RNA molecules were restricted to the xylem tissue, suggesting that these molecules may only be effective against chewing and xylem sap-feeding organisms22. Given that the DPI device uses a similar drilled-hole delivery system, it stands to reason that hairpin RNA delivered with this device may also be restricted to the xylem tissue. However, the observed decrease in the titer of the phloem-limited CLas after streptomycin treatment from the DPI device strongly suggests that this antibiotic was present in the phloem. Therefore, it is likely that the vascular distribution of the compounds delivered using the DPI device is dependent on their size and chemistry, and each molecule should be evaluated on an individual basis.
Although there are a number of commercially available DPI devices available on the market, the device described here can be manufactured in-house and is modifiable. In this way, improvements and changes in size may be made based on the plant species and experimental design being used, and it is not reliant on commercial products. In addition, the device is semi-permanently attached to the plant, meaning that multiple treatments of a given compound can be performed concurrently without having to reinjure the plant with multiple compound injections. On a cautionary note, the device can leak if not installed properly. As a result, the compound is lost to the environment instead of being delivered to the plant. Therefore, care should be taken to inspect the device for any signs of leakage during setup and the first few days afterward. Although drilling a hole in the tree is potentially harmful, this method was chosen to ensure robust and consistent compound uptake. Additionally, no adverse effects on plant health were seen from the attachment of the DPI device in these experiments. However, extra plants should be included in the experimental design to replace those that may lose vigor throughout the course of a given experiment. Lastly, since this device uses passive flow to introduce compounds, it can be difficult to predict the rate of uptake across different plant species or developmental stages of the same species. This may complicate experiments if the speed of compound uptake is a limiting factor. For the best results, experiments should be planned so that sufficient time is provided for the plant to fully absorb the 2.5 mL of compound, which can take up to 1 week. In conclusion, this DPI device is an effective tool for the rapid evaluation of the in planta activity of antimicrobial or insecticidal compounds against CLas and its vector, D. citri, thus providing more information on the systemic effectiveness and influence on plant performance than the previously presented detached leaf assay23. Undoubtedly, the variety of applications for this system reaches well beyond the specific uses described in this study.
Disclosures
The authors have no conflicts of interest. The use of trade, firm, or corporation names in this publication is for the information and convenience of the reader. Such use does not constitute an official endorsement or approval by the United States Department of Agriculture or the Agricultural Research Service of any product or service to the exclusion of others that may be suitable. The U.S. Department of Agriculture (USDA) prohibits discrimination in all its programs and activities on the basis of race, color, national origin, age, disability, and where applicable, sex, marital status, familial status, parental status, religion, sexual orientation, genetic information, political beliefs, reprisal, or because all or part of an individual's income is derived from any public assistance program. Not all prohibited bases apply to all programs. Persons with disabilities who require alternative means for communication of program information (Braille, large print, audiotape, etc.) should contact USDA's TARGET Center at (202) 720-2600 (voice and TDD). To file a complaint of discrimination, write to USDA, Director, Office of Civil Rights, 1400 Independence Avenue, S.W., Washington, D.C. 20250-9410, or call (800) 795-3272 (voice) or (202) 720-6382 (TDD). USDA is an equal opportunity provider and employer.
Acknowledgements
The authors would like to thank Mant Acon for the plants used in this study. The funding was provided by the U.S. Department of Agriculture (USDA) CRIS project 8062-22410-007-000-D and USDA NIFA grant 2020-70029-33176.
Materials
| Name | Company | Catalog Number | Comments |
|---|---|---|---|
| 0.5 cm Diameter Steel Balls | Ballistic Products Inc. | #SHT #T | |
| 10 mL Luer-Lok Syringe | Becton Dickinson | 382903029952 | |
| 20 G 1 Syringe Needle | Becton Dickinson | 305175 | |
| 2 mL Screw Cap Tubes | USA Scientific | 1420-9710 | |
| 3/32nd Inch Black Oxide Drill Bit | Sears | 964077 | |
| 3D Printer | Markforged | F-PR-2027 | |
| 3D Printing Software | Markforged | F-SW-FDVX | |
| 3D Printing Software | Markforged | S-FW-OEVX | |
| 5(6)-CFDA (5-(and-6)-Carboxyfluorescein Diacetate) | Invitrogen | C195 | |
| 5/64th Inch Black Oxide Drill Bit | Sears | 964502 | |
| 96 Well qPCR Machine | Roche | 5815916001 | |
| Centrifuge | Eppendorf | 22621408 | |
| Fluorescent Microscope | Olympus | SP-BX43-BI | |
| Fluorescent Microscope Filter | Chroma | 69401-ET | |
| Gloss Clear Spray Paint | Rustoleum | 249117 | |
| Grey Lego Baseplate | Lego | 11024 | |
| Handheld Cordless Drill | Makita | 6349D | |
| Homogenizer | Fisher Scientific | 15-340-163 | |
| Imidacloprid 2F | Quali-Pro | 83080133 | |
| Liquid Plastisol Medium Hardness | Fusion X Fishing Lures | XSOL-505 | |
| Red Silicone 70 Shore A O-Ring | Grainger | Varies by Size | |
| Non-Stick Cooking Spray | PAM | 64144030217 | |
| NucleoSpin Plant II | Macherey-Nagel | 740770.5 | |
| Parafilm | Bemis | HS234526A | |
| Poly Viyl Acetate Based Glue | Elmers | E301 | |
| qPCR Master Mix | Promega | A6001 | |
| qPCR Primers | Integrated DNA Technologies | Varies by DNA sequence | |
| Reverse Transcriptase | Promega | A5003 | |
| Single Edge Razor Blade | Garvey | 40475 | |
| Translucent Silicone RTV Rubber | Aero Marine Products | AM 115T | |
| Transparent Silicone Tape | Maxwell | KE30S | |
| Truncated Oncocin 112 | Genscript | Varies by peptide sequence | |
| White 1 x 6 Lego Piece | Lego | 300901 | |
| White Nylon | Markforged | F-MF-0003 |
References
- Hu, J., Wang, N. Evaluation of the spatiotemporal dynamics of oxytetracycline and its control effect against citrus huanglongbing via trunk injection. Phytopathology. 106 (12), 1495-1503 (2016).
- Bendix, C., Lewis, J. D. The enemy within: Phloem-limited pathogens. Molecular Plant Pathology. 19 (1), 238-254 (2018).
- Keshavareddy, G., Kumar, A. R. V., Ramu, V. S. Methods of plant transformation- A review. International Journal of Current Microbiology and Applied Sciences. 7 (7), 2656-2668 (2018).
- Qaim, M. Role of new plant breeding technologies for food security and sustainable agricultural development. Applied Economics Perspectives and Policy. 42 (2), 129-150 (2020).
- Siegrist, M., Hartmann, C. Consumer acceptance of novel food technologies. Nature Food. 1 (6), 343-350 (2020).
- Larson, D. W., Doubt, J., Matthes-Sears, U. Radially sectored hydraulic pathways in the xylem of Thuja occidentalis as revealed by the use of dyes. International Journal of Plant Sciences. 155 (5), 569-582 (1994).
- Mehdi, R., et al. Symplasmic phloem unloading and radial post-phloem transport via vascular rays in tuberous roots of Manihot esculenta. Journal of Experimental Botany. 70 (20), 5559-5573 (2019).
- Miller, G. S., Parente, R. M., Santra, S., Gesquiere, A. J. Tracking of fluorescent antibiotic conjugate in planta utilizing fluorescence lifetime imaging. Planta. 253 (2), (2021).
- Treydte, K., Lehmann, M. M., Wyczesany, T., Pfautsch, S. Radial and axial water movement in adult trees recorded by stable isotope tracing. Tree Physiology. 41 (12), 2248-2261 (2021).
- Nie, P. Liping Hu, Haiyan Zhang, Jixiang Zhang, Zhenxian Zhang, Lingyun Zhang, The predominance of the apoplasmic phloem-unloading pathway is interrupted by a symplasmic pathway during Chinese jujube fruit development. Plant and Cell Physiology. 51 (6), 1007-1018 (2010).
- Jiang, M., Deng, Z., White, R. G., Jin, T., Liang, D. Shootward movement of CFDA tracer loaded in the bottom sink tissues of Arabidopsis. Journal of Visualized Experiments. (147), e59606(2019).
- Liu, H., Si, C., Shi, C., Wang, S. Zhe Sun, Yanxi Shi, from apoplasmic to symplasmic phloem unloading during storage roots formation and bulking of sweet potato. Crop Science. 59 (2), 675-683 (2019).
- Erdos, T., Ullmann, A. Effect of streptomycin on the incorporation of amino-acids labeled with carbon-14 into ribonucleic acid and protein in a cell-free system of a Mycobacterium. Nature. 183 (4661), 618-619 (1959).
- Bové, J. M. Huanglongbing: A destructive, newly-emerging, century-old disease of citrus. Journal of Plant Pathology. 88 (1), 7-37 (2006).
- Motaung, T. E. Chloronicotinyl insecticide imidacloprid: Agricultural relevance, pitfalls and emerging opportunities. Crop Protection. 131, 105097(2020).
- Berger, C., Laurent, F. Trunk injection of plant protection products to protect trees from pests and diseases. Crop Protection. 124, 104831(2019).
- Archer, L., Crane, J. H., Albrecht, U. Trunk injection as a tool to deliver plant protection materials-An overview of basic principles and practical considerations. Horticulturae. 6 (6), 552(2022).
- Wise, J. C., et al. Trunk injection: A discriminating delivering system for horticulture crop IPM. Entomology, Ornithology & Herpetology: Current Research. 03 (2), (2014).
- Ammar, E. D., George, J., Sturgeon, K., Stelinski, L. L., Shatters, R. G. Asian citrus psyllid adults inoculate Huanglongbing bacterium more efficiently than nymphs when this bacterium is acquired by early instar nymphs. Scientific Reports. 10 (1), 18244(2020).
- Stover, E., Mccollum, G., Ramos, J., Shatters, R. G. Growth, health and Liberibacter asiaticus titer in diverse citrus scions on mandarin versus trifoliate hybrid rootstocks in a field planting with severe Huanglongbing. Proceedings of the Florida State Horticultural Society. 127, 53-59 (2014).
- Akaike, H. A new look at the statistical model identification. IEEE Transactions on Automatic Control. 19 (6), 716-723 (1974).
- Dalakouras, A., Jarausch, W., Buchholz, G., Bassler, A., Braun, M., Manthey, T., Krczal, G., Wassenegger, M. Delivery of hairpin RNAs and small RNAs into woods and herbaceous plants by trunk injection and petiole absorption. Frontiers in Plant Science. 9, 1253(2018).
- Ammar, E. D., Walter, A. J., Hall, D. G. New excised-leaf assay method to test inoculativity of Asian citrus psyllid (Hemiptera: Psyllidae) with Candidatus Liberibacter asiaticus associated with citrus Huanglongbing disease. Journal of Economic Entomology. 106 (1), 25-35 (2013).
Reprints and Permissions
