A subscription to JoVE is required to view this content.  Sign in or start your free trial.
ELISPOT Assay: Detection of IFN-γ Secreting Splenocytes
  • 00:01Concepts
  • 03:01Coating and Blocking the Plate
  • 04:42Plating and Activating Cells
  • 07:05Detection
  • 09:03Substrate
  • 10:01Data Acquisition and Analysis
  • 11:07Results

EliSPOT Assay: Rilevamento di splenociti secernenti IFN-γ

English

Share

Overview

Fonte: Tonya J. Webb1
1 Dipartimento di Microbiologia e Immunologia, University of Maryland School of Medicine e Marlene and Stewart Greenebaum Comprehensive Cancer Center, Baltimora, Maryland 21201

ELISPOT è un test standardizzato e riproducibile utilizzato per rilevare le risposte immunitarie cellulari. Il test utilizza un metodo basato su un saggio immunoassorbente enzimatico (ELISA) per rilevare le risposte immunitarie a singola cellula che possono essere visualizzate da macchie, da cui il nome ELISPOT. ELISPOT è stato descritto per la prima volta nel 1983, da Czerkinsky, come un metodo per enumerare il numero di ibridomi a cellule B che producono immunoglobuline antigene-specifiche (1). Lo stesso gruppo ha ulteriormente sviluppato il test per misurare la frequenza dei linfociti T che producono citochine. Ora ELISPOT è diventato un gold standard per misurare l’immunità delle cellule T antigene-specifiche negli studi clinici e nei candidati vaccini. Ad esempio, dopo la vaccinazione o durante un’infezione, le plasmacellule e le cellule B della memoria secernono anticorpi che forniscono protezione. Tipicamente, queste risposte delle cellule B sono valutate misurando i titoli sierici di anticorpi antigene-specifici. Tuttavia, questo tipo di analisi, tipicamente misurata da ELISA, potrebbe non includere le cellule B di memoria, che possono essere presenti anche in assenza di livelli sierici di anticorpi rilevabili. Inoltre, è stato ben stabilito che le cellule B della memoria circolanti sono importanti per la risposta anticorpale rapida e protettiva osservata dopo la ricon esposizione dei patogeni, quindi è fondamentale essere in grado di rilevare queste cellule. Pertanto, per valutare chiaramente le risposte delle cellule B della memoria antigene-specifica, devono essere utilizzati sia ELISA che ELISPOT (2).

Il test ELISPOT utilizza una piastra contenente pozzetti rivestiti di membrana rivestiti di anticorpi al fine di catturare le proteine secrete di interesse. Quindi, la piastra viene caricata con cellule e stimoli per indurre la produzione di proteine. Le proteine secrete vengono catturate dagli anticorpi rivestiti sulla superficie. Dopo un adeguato tempo di incubazione, le cellule vengono rimosse e la molecola secreta viene rilevata utilizzando un anticorpo biotinilato specifico per un epitopo diverso, rispetto all’anticorpo di cattura. Successivamente, viene aggiunta la streptavicina perossidasi, seguita dall’aggiunta di un substrato che consente il rilevamento delle macchie (Figura 1). Il punto di forza di questo test è che consente di quantificare il numero di cellule che producono la proteina di interesse. È importante sottolineare che si può valutare se ci sono cambiamenti nel numero totale di cellule che producono una proteina specifica o se le singole cellule all’interno di una popolazione producono più proteine. Inoltre, può fornire informazioni sulla cinetica e può essere utilizzato per valutare l’attivazione immunitaria complessiva (stimolazione mitogena) rispetto alle risposte antigene-specifiche (simulazione dell’antigene). Il test ELISPOT consentirà di rilevare una cellula attivata tra 300.000 cellule a seguito di attivazione mitogenica o antigene-specifica.

Figure 1
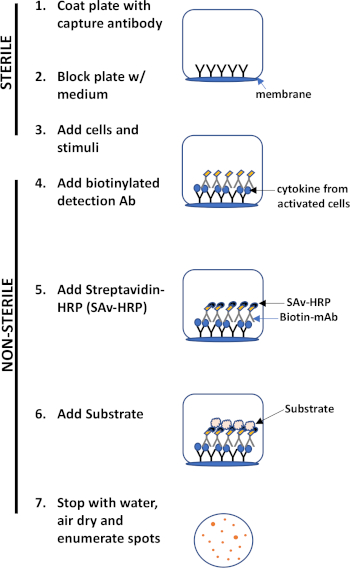
Figura 1: Panoramica del protocollo ELISPOT.

I principali vantaggi di questo test sono il suo- a. Semplicità: il protocollo è relativamente semplice e diretto. Non richiede competenze tecniche, b. Sensibilità- permette il rilevamento di cellule immunitarie a livello di singola cellula e richiede pochissime cellule rispetto ad altri metodi come la citometria a flusso, c. Funzionalità: fornisce dati quantitativi relativi alla funzione immunitaria.

Questo esercizio di laboratorio dimostra il protocollo ELISPOT per il rilevamento di splenociti secernenti IFN-γ, ma come accennato in precedenza questo test può anche essere utilizzato per valutare la secrezione di anticorpi da parte delle cellule B (3).

Procedure

1. Configurazione Tamponi e reagenti Soluzione salina sterile tamponata con fosfato (PBS) senza calcio o magnesio Tampone di rivestimento: PBS sterile o tampone carbonaato Diluente di dosaggio- 10% siero bovino fetale (FBS) in PBS Terreno di coltura cellulare – RPMI 1640 con 10% FBS, penicillina / streptomicina e L-glutammina Tampone di lavaggio – PBS contenente 0,05% Tween20 Acqua doppia distillata (…

Results

In this ELISPOT assay, splenic leukocytes from wildtype and tumor-bearing mice were analyzed for IFN-γ. Figure 2 A shows the visual image of the assay result. The numbers in the green color indicate the number of spots per well (TNTC indicates “too numerous to count”). Notice that the number of spots decreases with decreasing cell concentration.

Figure 2A
Figure 2A: Decreased immune responses in tumor-bearing mice. Please click here to view a larger version of this figure.

Typically, ELISPOT data are presented as the number of spot counts per number of cells plated. In Figure 2 B the number of spots is displayed in a bar graph, with each respective cellular concentration listed on the X-axis. For graphing purposes, 150 was used to indicate the maximum number of spots. The number of IFN-γ producing murine splenic leukocytes in tumor-bearing animals is lower than the wild type ones.

Figure 2B
Figure 2B: Decreased immune responses in tumor-bearing mice. Splenocytes were harvested from control C57BL/6 (wildtype) and tumor-bearing mice and stimulated with PMA/ionomycin for 48 hours. ELISPOT assays were used to quantitate the number of IFN-γ-producing splenic leukocytes. (A) Visual and (B) graphical representation of the data. TNTC indicates too numerous to count. For graphing purposes, 150 was used to indicate the maximum number of spots. The green numbers indicate the number of spots counted per well. The red numbers indicate the reference wells that were used to determine which spots were cells and which spots were debris, artifacts, or edge effects and should be excluded from the analysis.

Applications and Summary

The ELISPOT assay allows one to assess immune cell activation by determining the number of cells secreting a specific analyte. The size and intensity of the spots provides information regarding the amount of analyte being produced by each cell. The protocol outlined above detailed the detection of a single cytokine. However, recent developments have enhanced the utility of this assay. Currently, one can use fluorescent detection dyes in order to detect multiple analytes within a well. This permits the detection of different subpopulations of cells secreting either one or both analytes.

References

  1. Czerkinsky, C. C., Nilsson, L. A., Nygren, H., Ouchterlony, O., & Tarkowski, A. A solid-phase enzyme-linked immunospot (ELISPOT) assay for enumeration of specific antibody-secreting cells. Journal of Immunological Methods, 65 (1), 109-121(1983).
  2. Wahid, R., Simon, J. K., Picking, W. L., Kotloff, K. L., Levine, M. M., & Sztein, M. B. Shigella antigen-specific B memory cells are associated with decreased disease severity in subjects challenged with wild-type Shigella flexneri 2a. Clinical Immunology, 148 (1), 35-43 (2013).
  3. Roberts, T. J., Lin, Y., Spence, P. M., Van Kaer, L., & Brutkiewicz, R. R. CD1d1-dependent control of the magnitude of an acute antiviral immune response. The Journal of Immunology, 172, 3454-3461 (2004).

Transcript

The Enzyme-linked Immunospot, or ELISPOT, assay is a method to analyze the immune response to a pathogen or cell damage. It allows for quantification of the activation of different immune cells by detecting specific proteins they secrete. For example, ELISPOT is commonly used for measuring T-cell responses upon exposure to a foreign antigen by detecting secreted cytokines.

For a cytokine-based ELISPOT assay, the process begins with the coating of an ELISPOT microplate with a capture antibody, which is specific to the target cytokine. After the antibody coating, T-cells are added to the wells and stimulated by an external agent, like anti-CD3 antibody, for example. The cells then secrete the target cytokine, which immediately gets immobilized by the capture antibody. Since the protein is captured instantly post-secretion from live cells, without dilution or degradation, this assay has a high accuracy. After the target cytokine is immobilized, a detection antibody is added, which also binds to the captured cytokine.

The ELISPOT technique can also be used to quantify memory B-cells after an infection or vaccination by analyzing their production of specific antibodies. In an antibody-based ELISPOT, a specific antigen is used instead of an antibody for either the capture step, where the antigen will be bound to the plate, or at the detection step, where the antigen detects the target antibody post-capture. In all variations of the process, for T-cells or B-cells, the detection antibody or antigen is biotinylated, which allows it to bind to a streptavidin-conjugated detection enzyme, such as horseradish peroxidase. Then, upon addition of the peroxidase’s substrate, AEC, a dark, insoluble precipitate is produced. This precipitate marks the location of the captured protein, and each secretory cell results in a visible spot, which can be quantified using an ELISPOT reader or a microscope. The size of the spots is a relative estimate of the amount of protein secreted from each cell. This assay can detect immune responses from single cells, even in relatively small subpopulations of secretory cells, making it useful for studying immune responses at the cellular level.

In this video, you will learn how to perform an ELISPOT assay and then quantify the spots representing the secretory cells.

Throughout the experiment, ensure sterile conditions by working in a laminar flow hood and wearing gloves.

All calculations in this protocol are based on the volume needed for one 96-well plate.

First, dilute the anti-cytokine capture antibody. To do this, transfer 10 milliliters of buffer into a sterile 15 milliliter conical tube. Then, use a pipette to add 10 microliters of one milligram per milliliter of monoclonal antibody to the buffer to create a solution with a final concentration of one microgram per milliliter. Next, pour the capture antibody solution into a sterile reservoir and, using a multichannel pipette, distribute 100 microliters into each well of a 96-well ELISPOT plate.

Cover the plate with a plate cover, seal it to prevent evaporation, and incubate overnight at four degrees Celsius. The next day, uncover the ELISPOT plate in the laminar flow hood. Quickly invert the plate onto sterile wipes to remove the capture antibody solution from each well. Next, use a multichannel pipette to add 200 microliters of cell culture medium to each well. This step will block non-specific binding during the assay. Replace the plate cover and incubate in a 37 degrees Celsius incubator for two hours.

While the plate is incubating, prepare a 2X mitogen solution by adding one microliter of PMA and 20 microliters of ionomycin to 10 milliliters of cell culture medium to achieve a final concentration of 15 nanograms per milliliter PMA and one micromolar ionomycin.

Cellular suspensions of mouse splenocytes should also be prepared at this time in a sterile hood. Using a microscope and hemocytometer, measure the concentration of cells and adjust the total volume until a stock concentration of two million cells per milliliter is reached.

After incubation is complete, quickly invert the plate onto sterile wipes to remove the cell culture medium from each well. Next, add 200 microliters of the prepared cellular suspension stock solution to the wells in the top row of the ELISPOT plate. Set up the experiment in triplicate, so that each cell type tested will be plated in a set of three grouped columns. Below this, add 100 microliters of plain cell culture medium to the next five rows of the plate, below the rows containing cellular stock solution.

Next, perform a serial dilution by pipetting 100 microliters of the cell suspension from the top row into the row directly below, gently pipetting the solution up and down to evenly distribute the cells. Repeat this process for the remaining rows, moving 100 microliters from the previous row to the row below at each step, continuing until the fifth row has been serially diluted. Leave the sixth row with cell culture medium only, to serve as a control. To stimulate the cells in the experimental wells of the plate, add 100 microliters of the prepared mitogen solution to the cellular suspensions in each well of rows one through five. Be sure to leave the sixth row, which will serve as the control, unstimulated. Replace the lid and incubate the plate at 37 degrees Celsius and 5% CO2 for 24 to 48 hours.

Prepare the diluted biotinylated anti-cytokine detecting antibody. First, prepare 50 milliliters of assay diluent by adding 5 milliliters of 10% fetal bovine serum to 45 milliliters of PBS. Next, dilute the detecting antibody to a concentration of 2 micrograms per milliliter in assay diluent. Also, prepare 20 to 25 milliliters of wash buffer at this time, by mixing .05% Tween-20 and PBS.

After the incubation is complete, uncap the plate and quickly invert it to remove all liquid from the wells. Wash the plate by adding about 200 microliters of wash buffer to each well. Expel this liquid by quickly inverting and flicking the plate over a sink. Repeat this process four more times for a total of five washes. Next, add 100 microliters of the diluted detection antibody solution to each well, replace the lid, and incubate at room temperature for two hours. After incubation, expel the detection antibody solution from the wells of the plate by inverting and flicking the plate over the sink.

As before, wash the plate five times with wash buffer, expelling the liquid between each wash. After the final wash, prepare the streptavidin- horseradish peroxidase solution by diluting it according to the manufacturer’s instructions. Next, with the wells of the plate empty, add 100 microliters of diluted streptavidin- horseradish peroxidase solution to each well. Place the lid back onto the plate and incubate at room temperature for two hours.

After the incubation, no more than 15 minutes before use, activate pre-made AEC substrate solution. Discard the contents of the wells and wash the plate five times with wash buffer, as before. Then, immediately add 100 microliters of prepared AEC substrate solution into each well. Leave the plate at room temperature to develop for approximately 10 to 20 minutes, while monitoring spot development. These spots will appear as small, darkened circles on the surface of the wells. Then, stop the reaction by rinsing the plate with water and flicking it over the sink. Blot the plate on paper towels and allow to air dry overnight or until completely dry. Removing the plastic tray under the plate will facilitate drying. After drying, the spots are ready to be counted with an automated plate reader.

Here, the CTL ImmunoSpot reader is used, but this protocol can be adapted for any reader. Then, open the CTL program and click on Scan Count. Push eject for the tray to extend from the machine. Then, remove the plastic adapter and align row A on the ELISPOT plate and adapter. Choose a file name and location for the file to be saved and load the plate and adapter onto the tray. Click Load on the software and close the door on the side of the machine. Then, press Start After Counting. Ensure that the file is saved and then open the Quality Control QC software to analyze the data and count the number of spots. Export this data as an Excel file. Once analysis is complete, click Eject to retrieve the plate.

In this experiment, cells from wild type and tumor-bearing mice were plated and analyzed for IFN gamma. Notice that the number of spots decreases with decreasing cell concentration. Typically, ELISPOT data are presented as the number of spot counts per number of cells plated. In this example, the number of spots were displayed in a bar graph, with each respective cellular concentration listed on the x-axis. Notice that the number of spots indicates the number of activated cells per total number of cells in a given population.

Tags

Cite This
JoVE Science Education Database. JoVE Science Education. ELISPOT Assay: Detection of IFN-γ Secreting Splenocytes. JoVE, Cambridge, MA, (2023).