

Summary
We show a technique for in vivo live bioluminescence and near-infrared imaging of optic neuritis and encephalitis in the experimental autoimmune encephalomyelitis (EAE) model for multiple sclerosis in SJL/J mice.
Abstract
Experimental autoimmune encephalomyelitis (EAE) in SJL/J mice is a model for relapsing-remitting multiple sclerosis (RRMS). Clinical EAE scores describing motor function deficits are basic readouts of the immune-mediated inflammation of the spinal cord. However, scores and body weight do not allow for an in vivo assessment of brain inflammation and optic neuritis. The latter is an early and frequent manifestation in about 2/3 of MS patients. Here, we show methods for bioluminescence and near-infrared live imaging to assess EAE evoked optic neuritis, brain inflammation, and blood-brain barrier (BBB) disruption in living mice using an in vivo imaging system. A bioluminescent substrate activated by oxidases primarily showed optic neuritis. The signal was specific and allowed the visualization of medication effects and disease time courses, which paralleled the clinical scores. Pegylated fluorescent nanoparticles that remained within the vasculature for extended periods of time were used to assess the BBB integrity. Near-infrared imaging revealed a BBB leak at the peak of the disease. The signal was the strongest around the eyes. A near-infrared substrate for matrix metalloproteinases was used to assess EAE-evoked inflammation. Auto-fluorescence interfered with the signal, requiring spectral unmixing for quantification. Overall, bioluminescence imaging was a reliable method to assess EAE-associated optic neuritis and medication effects and was superior to the near-infrared techniques in terms of signal specificity, robustness, ease of quantification, and cost.
Introduction
Multiple sclerosis is caused by the autoimmune-mediated attack and destruction of the myelin sheath in the brain and the spinal cord1. With an overall incidence of about 3.6 cases per 100,000 people a year in women and about 2.0 in men, MS is the second most common cause of neurological disability in young adults, after traumatic injuries2,3. The disease pathology is contributed to by genetic and environmental factors4 but is still not completely understood. Autoreactive T lymphocytes enter the central nervous system and trigger an inflammatory cascade that causes focal infiltrates in the white matter of the brain, spinal cord, and optic nerve. In most cases, these infiltrates are initially reversible, but persistence increases with the number of relapses. A number of rodent models have been developed to study the pathology of the disease. The relapsing-remitting EAE in SJL/J mice and the primary-progressive EAE in C57BL6 mice are the most popular models.
The clinical EAE scores, which describe the extent of the motor function deficits, and body weight are the gold standards to assess EAE severity. These clinical signs agree with the extent of immune cell infiltration and myelin destruction in the spinal cord and moderately predict drug treatment efficacy in humans5. However, these signs mainly reflect the destruction of the ventral fiber tracts in the spinal cord. Presently, there is no easy, non-invasive, reliable, and reproducible method to assess in vivo brain infiltration and optic neuritis in living mice.
The in vivo imaging agrees with the 3 "R" principles of Russel and Burch (1959), which claim a Replacement, Reduction, and Refinement of animal experiments6, because imaging increases the readouts of one animal at several time points and allows for a reduction of the overall numbers. Presently, inflammation or myelin status is mainly assessed ex vivo via immunohistochemistry, FACS-analysis, or different molecular biological methods7, all requiring euthanized mice at specific time points.
A number of in vivo imaging system probes have been developed to assess inflammation in the skin, joints, and vascular system. The techniques rely on the activation of bioluminescent or near-infrared fluorescent substrates by tissue peroxidases, including myeloperoxidase (MPO), matrix metalloproteinases (MMPs)8, and cathepsins9 or cyclooxygenase2. These probes have been mainly validated in models of arthritis or atherosclerosis9,10. A cathepsin-sensitive probe has also been used for fluorescence molecular tomographic imaging of EAE11. MMPs, particularly MMP2 and MMP9, contribute to the protease-mediated BBB disruption in EAE and are upregulated at sites of immune cell infiltration12, suggesting that these probes may be useful for EAE imaging. The same holds true for peroxidase or cathepsin-based probes. Technically, imaging of inflammation in the brain or spinal cord is substantially more challenging because the skull or spine absorb bioluminescent and near-infrared signals.
In addition to inflammation indicators, fluorescent chemicals have been described, which specifically bind to myelin and may allow for quantification of myelination13. A near-infrared fluorescent probe, 3,3'-diethylthiatricarbocyanine iodide (DBT), was found to specifically bind to myelinated fibers and was validated as a quantitative tool in mouse models of primary myelination defects and in cuprizone-evoked demyelination14. In EAE, the DBT signal was rather increased, reflecting the inflammation of the myelin fibers5.
An additional hallmark of EAE and MS is the BBB breakdown, resulting in increased vascular permeability and the extravasation of blood cells, extracellular fluid, and macromolecules into the CNS parenchyma. This can lead to edema, inflammation, oligodendrocyte damage, and, eventually, demyelination15,16. Hence, visualization of the BBB leak using fluorescent probes, such as fluorochrome-labeled bovine serum albumin5, which normally distribute very slowly from blood to tissue, may be useful to assess EAE.
In the present study, we have assessed the usefulness of different probes in EAE and show the procedure for the most reliable and robust bioluminescent technique. In addition, we discuss the pros and cons of near-infrared probes for MMP activity and BBB integrity.
Subscription Required. Please recommend JoVE to your librarian.
Protocol
1. EAE Induction in SJL/J Mice
- Mice
- Use 11-week-old female SJL/J mice and allow them to habituate to the experimental room for about 7 days. Use n = 10 mice per group.
- For the assessment of medication effects, administer the drug and placebo for the control group continuously via the drinking water or via food pellets starting 3 or 5 days after immunization (n = 10 per group). During the peak of the disease, administer medication or placebo with milk or 3% sugar water-soaked corn flakes.
- Immunization material
- Use an EAE induction kit consisting of antigen (peptide of proteolipid protein, PLP139-151, 1 mg/mL emulsion) in an emulsion with complete Freund's adjuvant (CFA, heat-killed Mycobacterium tuberculosis H37 Ra) and 2 vials (5 µg each) of lyophilized pertussis toxin (PTX).
- Dissolve the PTX (2 µg/mL) in 1x phosphate-buffered saline (PBS; i.e., add 1.5 mL of PBS to each PTX tube, mix well, remove with the same pipet tip, and add to 1 mL of PBS in a 50-mL tube); mix well.
- Immunization
- Inject PLP/CFA subcutaneously in 2 portions, each 100 µL, both at the base of the tail. Do not inject into the back of the neck, because any immune reactions in the skin in the upper back or neck will disturb imaging of the head and spinal cord.
- Inject 100 µL of PTX intraperitoneally (i.p.), twice per mouse, the first 1 - 2 h after immunization and the second at 24 h.
- For the control mice, inject CFA without PLP (2 portions of 100 µL) plus PTX without PLP.
- Mouse handling after immunization
- Weigh the mice every other day up to day 7, and then weigh them daily.
NOTE: Mice lose about 1 - 2 g of body weight during EAE. The decline marks the onset of EAE. - Assess clinical symptoms daily from day 7 according to the standard scoring systems (i.e., Score 0: no obvious changes in motor functions; score 0.5: distal paralysis of the tail; score 1: complete tail paralysis; score 1.5: mild paresis of one or both hind legs; score 2: severe paresis of hind legs; score 2.5: complete paralysis of one hind leg; score 3: complete paralysis of both hind legs; score 3.5: complete paralysis of hind legs and paresis of one front leg. Euthanize mice with scores of 3.5 or higher for > 12 h.
- Weigh the mice every other day up to day 7, and then weigh them daily.
- EAE course and time of imaging
- Perform the first imaging at the onset of the disease, when the mice reach scores > 1, which will occur around day 10 - 12 after immunization.
- Perform the second imaging at the peak, which will be reached 1 or 2 days after the initial symptoms develop and will last for 1 - 3 days.
NOTE: Subsequently, the mice will fully recover within 7 to 10 days. Imaging during the intervals may still show vascular leaks, but inflammation indicators should be negative.
2. Bioluminescent and Near-infrared Imaging of Optic Neuritis and Brain Inflammation
- Setup of the imaging system
- Perform in vivo imaging with any equipment that allows for the analysis of bioluminescence and near-infrared signals.
- Keep mice under 2 - 2.5% isoflurane anesthesia during all imaging procedures.
- Position one or two mice beside each other in the apparatus using the middle gas supplies. Position the upper spine in the center.
- Use two mice simultaneously, one per group, for evaluation of medication effects to compare pairs. This is important for bioluminescent imaging.
- Shield the site of immunization with black cloth and take a photograph and baseline image to assess the correct positioning of the mouse/mice. Use the B-focus with a 6.5-cm distance to the camera for all images.
- Injection and imaging of bioluminescent inflammation probe
- Use the in vivo imaging system settings: Epi-BLI, Em filter open, Ex filter block, fstop 1, binning 8, focus B = 6.5 cm, ad exposure 120 s; take a baseline image.
- Inject 100 µL i.p. of the ready-to-use chemiluminescent reagent (40 mg/mL). Mix well before filling the syringe.
- Capture bioluminescence images 5, 10, and 15 min after injection. The time course of the bioluminescent peak differs between animals.
NOTE: The peak will occur 5 - 10 min after injection; a decline at 15 min indicates that no further images are required. Use mouse pairs of control and treatment groups to eliminate minor biases due to different time courses. - Fill in descriptions relevant to the experiment. Observe a dialog box pop up automatically; it includes information, such as mouse strain, sex, time point, time of probe injection, group, etc. Save the files all in one folder; they will have time tags and all descriptions.
- Injection and imaging of near-infrared fluorescent nanoparticles for BBB integrity
- Use near-infrared epifluorescence imaging in the B-focus (distance: 6.5 cm). The excitation/emission maxima of the pegylated fluorescent nanoparticles are 675/690 nm. Capture two images at different wavelengths, at Ex640/Em700 and Ex675/Em720; use a 2-s exposure, binning 8, and fstop 2. Take a baseline image.
- Inject 70 µL of pegylated fluorescent infrared nanoparticles i.v. through the tail vein and imagine the mice 3 h and 24 h after injection using the above settings. Mix the solution well before filling the syringe.
- Inject 0.9% sodium chloride in control mice, which will be needed to assess the specificity of the signal.
- Injection and imaging of the near-infrared fluorescent probe for MMP activity
- Shave or depilate the head and upper spine region cautiously one day before taking the baseline image. The skin must not be injured.
- Use near-infrared epifluorescence imaging in the B-focus (distance: 6.5 cm). The excitation/emission maxima of the MMP activatable probe are 680/700 nm. Capture two images at different wavelengths, at Ex640/Em700 and Ex675/Em720; use a 1-s exposure, binning 8, and fstop 2. Take a baseline image.
- Add 200 µL of 1x PBS to the 1.5-mL tube of the ready-to-use solution (20 nmol/1.5 mL in 1x PBS) so that it will be sufficient for 10 mice; mix well before filling the syringe.
NOTE: The provided volume does not take into account that some volume is lost during syringe filling and injection. - Inject 150 µL of the probe i.v. through the tail vein 24 h before imaging. Inject PBS only in control animals to assess the specificity of the signal.
- At 24 h after injection, take Epi-FL images at least at two wavelengths, Ex640/Em700 and Ex 675/Em720, with the settings explained above (1-s exposure, focus B, binning 8, and fstop 2).
NOTE: The use of two wavelengths allows for spectral unmixing by subtracting the unspecific signal.
3. Image Analyses
- Bioluminescence analysis (BLI)
- Double-click the software to open it.
- In the upper menu bar, click on the file browser icon, go to the directory of the folder of the experiment, and select it; this will open all files in the folder in a table.
- Configure the columns showing the descriptions relevant to the experiment.
- For quality control, double-click on a file of a non-responder mouse without symptoms of EAE and/or a naïve mouse to check the specificity of the EAE signals.
NOTE: There should be no signal in naïve mice and minimal signal in non-responder mice.- Check the baseline image before the injection of the probe for each mouse as further control of the specificity of the signal; it should be negative.
- To select an image, double-click on the first file of the first EAE mouse and check the bioluminescent intensity (LUT bar range) and localization. Check all images one by one. Close the file with the lowest intensity for each mouse (i.e., keep 2 out of 3 images for each mouse).
- Image adjustment and exportation
- Double-click the first file to be quantified. Observe a new window pop up. Under "options" (upper menu), customize the labels to display in each image.
- In the right tool palette, go to "image adjustment." By default, minimum and maximum intensities are set to "auto" and displayed in rainbow pseudocolor. Select "manual" to change the settings if necessary.
NOTE: For example, all exported images may have identical LUT bars (identical minima and maxima) to be easily comparable. The adjustment of the minima and maxima has no impact on the quantitative results. - Click on image export, select png, the directory, and an image name
- Quantification of Regions of Interest (ROI)
- Go to the "ROI" tool in the tool palette. Select the ROI method (circle, rectangular, auto, or free-hand) and the number of ROIs. Observe the ROI window pop up in the image window.
- Using the mouse, adjust the size and position. Use identical ROI thresholds for all images if the auto-ROI tool is used. Use identical areas for all images if ROI sizes and positions are defined manually (e.g., circular ROIs).
- Click on "measure RO.I. Observe a new window pop up. Customize the columns (e.g., file name, animal number, group, experiment, area, total counts, average counts, SD counts, min and max counts, area, time point, time of probe injection, etc.). Save the customized settings. When ready, select all (Ctrl + A), and copy and paste the table into a spreadsheet.
- Export the image as a png with the ROIs in place. Save and close the image file.
- Repeat the procedure (steps 3.1.6 - 3.1.7) for all image files that need to be quantified. Copy all ROI quantifications into the spreadsheet.
NOTE: Here, results can be sorted by group, time point, etc. and statistically analyzed. Use the total counts of bioluminescence signals in the ROIs for statistical analyses.
- Near-Infrared (NIR) analysis of fluorescent nanoparticles
- Using the controls in the software, adjust the threshold of the image.
NOTE: This has no impact on the quantitative result. - Visually compare the images captured at Ex/Em 675/720 and Ex/Em 640/700 to assess the specificity of the signal.
- Use the images captured at Ex/Em 675/720 for the quantitative analysis (excitation maximum: 680 nm). Define ROIs, for which the auto-ROI tool may be used. Adjust the auto-ROI threshold and use it for all images. Quantify the total radiant efficiency in ROIs (see step 3.1).
- Using the controls in the software, adjust the threshold of the image.
- Near-Infrared (NIR) analysis of protease-sensitive probe
- Using software controls, adjust the threshold of the image.
NOTE: This has no impact on the quantitative result. Perform spectral unmixing of the auto-fluorescence. The unmixing tool is implemented in Living Image. The auto-unmixing uses the Ex/Em 640/700 as the specific and 675/720 as the auto-fluorescent image. - Select the unmixed image and define the ROIs, as described above. Use the total radiant efficiency in ROIs for quantitative and statistical analyses.
- Using software controls, adjust the threshold of the image.
Subscription Required. Please recommend JoVE to your librarian.
Representative Results
Time Course of Bioluminescence of Optic Neuritis
The bioluminescence signal of the inflammation probe was the strongest around the eyes and occurred exclusively in EAE mice with optic neuritis. A signal occurred in neither the non-EAE mice nor the mice not injected with the inflammation probe. The signal disappeared when the mice recovered. Hence, the signal is specific for optic neuritis, and the peak of the signal parallels the peak of the clinical EAE scores. Figure 1 shows two examples of SJL/J mice imaged at day 10 and 14 after EAE induction. The bioluminescent signal was the highest on day 10 and disappeared when the mice started to recover. The time courses of the clinical scores matched the disappearance of the bioluminescent signal (example-1) or preceded (example-2) the decline of the scores.

Figure 1. Time Course of Optic Neuritis and Clinical Scores in EAS-SJL/J Mice. Bioluminescent images of optic neuritis were captured 10 min after the injection of the inflammation probe (100 µL i.p.) during the 1st flare of the disease in two SJL/J mice at different time points after immunization. The bioluminescent images (left panel) were captured 10 and 14 days after immunization and are presented as rainbow pseudocolor photograph overlays. Lut bars range from blue (low-) to red (high-bioluminescence). Scale bar: 1 cm. The right panel shows bar charts of the individual total bioluminescence counts in ROIs (mean ± sd of 3 images each) and the time courses of the clinical EAE scores. The red arrows mark the imaging days. Please click here to view a larger version of this figure.
Assessment of Treatment Efficacy
Inflammation probe
The effects of the medication (R-flurbiprofen 5 mg/kg/d)5 are shown in Figure 2. Five examples of the bioluminescent images in each group are presented. The scores in the vehicle and treatment group were heterogeneous, but in all mice, the bioluminescent signal in the eye showing inflammation in the optic nerve was lower in the medication group (Figure 2A). The quantification of the total bioluminescent counts in ROIs confirmed significant treatment efficacy (Figure 2B, with box plots of the total bioluminescent counts, unpaired 2-tailed t-test, P < 0.05). The imaging results agreed with the therapeutic effects of the medication in terms of the clinical scores and histopathologic manifestations of EAE in the spinal cord and optic nerve5.

Figure 2. Efficacy of Medication in EAE-SJL/J Mice Using Bioluminescent Imaging. SJL/J mice received vehicle or medication (R-flurbiprofen 5 mg/kg/d) from day 5 after immunization. Images were captured after the injection of the inflammation probe (100 µL i.p.) at the 1st EAE peak, n = 10 per group. EAE developed in 7/10 in both groups, and EAE non-responders were without signal. A) Bioluminescence images in living mice captured 5 - 15 min after the i.p. injection of 100 µL of the inflammation probe are presented as rainbow pseudocolor photograph overlays. LUT bars range from blue (low-) to red (high-intensity). Scale bar: 1 cm. The individual peak of the total bioluminescent counts in ROIs was used for quantification. ROIs were restricted to the head. The PLP injection sites were shielded with black cloth. B) Box plots showing the quantification of the total counts in ROIs. The box represents the interquartile range, the line is the median, and the whiskers show the minimum to maximum. The total counts differed significantly between groups (2-sided unpaired t-test, P < 0.05), showing a reduction of optic neuritis and encephalitis in mice receiving medication. Please click here to view a larger version of this figure.
Pegylated fluorescent nanoparticles
Epifluorescence images of near-infrared nanoparticles revealed vascular leaks around the eyes and in the brain in both treatment groups (Figure 3A, 2 examples). The particles distribute very slowly from the blood to the interstitial space, except for sites of inflammation, where the dye accumulates, allowing for an assessment of BBB integrity. The leakage was evident at 3 h and 24 h after the injection of the nanoparticles, but it was stronger at the later time point. There was no specific signal in non-EAE mice or mice not injected with nanoparticles (right panel). Hence, the signal was specific. The quantitative analysis of radiant efficiency in ROIs (Figure 3B) did not reveal significant differences between treatment groups (n = 3 per group, unpaired 2-tailed t-test, P < 0.05).

Figure 3. Assessment of Blood Brain Barrier Disruption with Pegylated Fluorescent Nanoparticles. SJL/J mice received vehicle or medication (R-flurbiprofen 5 mg/kg/d) from day 5 after immunization. Images were captured 3 h and 24 h after the injection of near-infrared-labeled nanoparticles (70 µL i.v.) during the 1st EAE peak, n = 3 per group. EAE non-responders were without signal. The auto-ROI tool was used for the quantification of the radiant efficiency. The ROIs were restricted to the head. The PLP injection sites were shielded. A) Exemplary epifluorescence images of living mice, captured 3 h and 24 h after the injection of nanoparticles. Images of mice without EAE or without the injection of nanoparticles were used as imaging controls. Scale bar: 1 cm. LUT bars range from dark red (low-) to yellow (high-intensity). B) Bar charts showing the quantification of the radiant efficiency in ROIs (mean ± SD). Treatment groups did not significantly differ (2-sided unpaired t-test). Please click here to view a larger version of this figure.
Matrix metalloproteinase-sensitive probe
After subtracting the auto-fluorescence, images of the protease-activatable MMP probe revealed inflammation in the brain and the spinal cord in EAE mice (Figure 4A, examples of 4 mice per group). There was no signal in mice not injected with the probe, and a weak signal occurred in an EAE mouse without clinical symptoms (non-responder). Images in Figure 4 show the signal at Ex/Em 640/700 subtracted by the image at Ex/Em 675/720. Differences between the treatments were revealed only after the quantitative analysis of the radiant efficiency in auto-ROIs after spectral unmixing (Figure 4B, unpaired 2-tailed t-test, n = 6 and 4, P < 0.05).
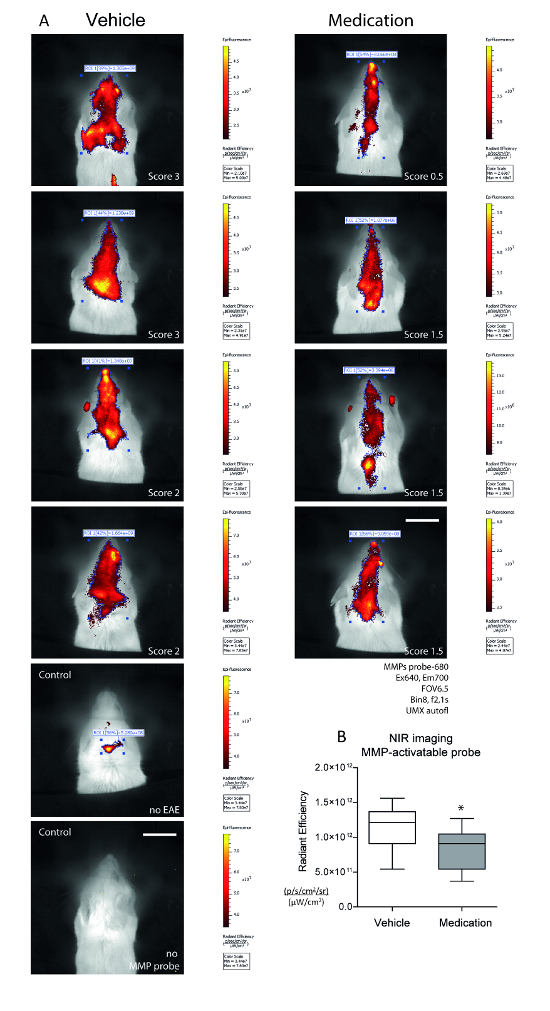
Figure 4. Assessment of Metalloproteinase Activity with Near-infrared MMP-sensitive Imaging Probe. SJL/J mice received vehicle or medication (R-flurbiprofen 5 mg/kg/d) from day 5 after immunization. Images were captured 24 h after the injection of the probe (150 µL i.v.) at the 1st EAE peak, n = 6 and 4. The PLP injection sites were shielded. EAE non-responders and mice without MMP probe injections were used as controls. Each 2 images were captured at Ex/Em 640/700 nm (specific signal) and 675/720 nm (auto-fluorescence). Using the spectral unmixing tool, the auto-fluorescence was subtracted and subsequently, the auto-ROI tool was used to identify the sites of specific MMP activity. The total radiant efficiency was used for quantification. A) Exemplary epifluorescence images in living mice captured 24 h after probe injection. The images are the result of spectral unmixing (UMX). Scale bar: 1 cm. LUT bars range from dark red (low-) to yellow (high-intensity). B) Box plots showing the quantification of the total radiant efficiency in ROIs. The box represents the interquartile range, the line is the median, and the whiskers show the minimum to maximum. The asterisk indicates a significant difference between groups (2-sided unpaired t-test, P < 0.05). Please click here to view a larger version of this figure.
Subscription Required. Please recommend JoVE to your librarian.
Discussion
The present video shows techniques for bioluminescence and near-infrared fluorescence in vivo imaging of EAE in SJL/J mice. We show that bioluminescence imaging using an inflammation-sensitive probe mainly shows optic neuritis, and the quantification agrees with the clinical evaluation of EAE severity and the effects of medication. However, the bioluminescence imaging method was not able to detect inflammation of the lumbar spinal cord, which is a primary site of EAE manifestation17, likely because the signal is absorbed by the spine.
The near-infrared imaging is more sensitive, but at the expense of high interference with auto-fluorescence, which does not occur with bioluminescence. The exposure time of NIR is much shorter (1 - 2 s) as compared to BLI (2 - 5 min), which makes NIR the preferred method for time series with rapidly changing signal intensities.
Critical Steps within the Protocol and Limitations of the Technique
Signals of the immunization site interfere with spinal cord imaging in EAE, but this can be circumvented by locating both injection sites at the base of the tail, which was not inferior to the recommended injection sites (neck and base of the tail). Nevertheless, it is necessary to shield the injection sites with black cloth.
For bioluminescence imaging, it is crucial to capture a time series of images, because the kinetics differ between animals. To avoid biases caused by kinetics, imaging of pairs of control (e.g., vehicle or wild type) and verum (e.g., drug or transgenic) mice is advantageous. According to the manufacturer, the signal should be stable for 30 min. However, in EAE, we observed faster and more transient kinetics, with peaks occurring at 5 - 10 min and a substantial decline at 15 min.
For near-infrared imaging, the manufacturer recommends the Ex/Em setting for a specific probe. Nevertheless, it was useful to run a filter series initially and to always capture images at least at two excitation/emission combinations, which closely match the reported Ex/Em maxima and can later be used for spectral unmixing of unspecific signals.
It is important to use white mice, like SJL/J, because light and fluorescence are highly absorbed by black fur. Black mice need to be cautiously shaved on the head and back one day before imaging. Skin lesions must be avoided, because they will appear as inflammatory spots and interfere with the imaging of the brain or spinal cord. For NIR imaging, the manufacturer recommends the depilation of all mice, even white mice. Even after shaving, the head and back results in black mice were less convincing than with white mice (not shown). For the primary-progressive EAE model in C57BL6 mice, white C57BL6 mice, which are commercially available, may be an alternative. Hairless, immunocompetent SKH1 mice are useful for near-infrared imaging, but not EAE, because these mice have an albino genetic background and do not reliably develop EAE (maximum score: 0.5 - 1). Bioluminescent imaging using the inflammation probe in these mice revealed several inflammatory spots in the skin (not shown) where hair follicles are lost.
NIR imaging of protease activity revealed brain and spinal cord inflammation, but signals were superimposed by auto-fluorescence, requiring spectral unmixing before quantitative analysis. Hence, NIR imaging was less robust than bioluminescence imaging and was more expensive. However, the use of protease activatable probes may be useful for the assessment of drugs that specifically target matrix metalloproteinases.
Advantages and Disadvantages
The different imaging techniques are complimentary and address specific questions. The advantages of bioluminescent imaging are affordability (about 20 Euro/mouse); a lack of auto-bioluminescence, which would interfere with the signal; high specificity; convenient i.p. injection and image analysis; and robustness and reliability. Disadvantages are long exposure times and signal absorption by black fur and bone.
Advantages of NIR are the broader availability of NIR-labeled probes, ease of custom NIR labeling, short exposure time, and high sensitivity. Disadvantages are high costs (50 - 100 Euro/mouse), absorption by fur, strong interference with auto-fluorescence, and the necessity for spectral unmixing and image processing before analysis.
A number of probes are available that detect sites of inflammation because they are activated by pro-inflammatory enzymes that are upregulated at sites of inflammation (e.g., peroxidases or metalloproteinases) due to the infiltration of immune cells. Some of these probes will also detect cancers demonstrating immune cell infiltration into the tumor microenvironment or the release of enzymes by the tumor itself (e.g., MMPs). Probes that accumulate in tissue due to capillary leakage will detect disruptions in the BBB, but also at other sites of inflammation and cancer.
Significance of the Technique with Respect to Existing/Alternative Methods
The combination of "imaging plus clinical sores" was superior to "scores only" for the assessment of the disease status and the detection of medication effects. The bioluminescence signal around the eyes also agrees with previous histopathological studies showing myelin destruction and immune cell infiltrates in the optic nerve5. About 2/3 of MS patients develop episodes of optic neuritis. So far, there are no reliable, non-invasive methods to quantify optic neuritis in living mice except diffusion magnetic resonance imaging (MRI) and optical coherence tomography (OCT), which are technically demanding18. OCT has been introduced into EAE as a method showing retinal changes and atrophy during EAE, suggesting an autoimmune reaction in the optic nerve19.
Compared to the method described in this manuscript, OCT is a higher stressor for the mice, because it requires deep anesthesia. The readout is not a direct visualization of the optic nerve19.
Near-infrared imaging of fluorescent nanoparticles was useful to visualize the disruption of the BBB, which is another hallmark of EAE and MS. Besides MRI20,21, there is no non-invasive method for the in vivo monitoring of BBB integrity. This would be quite useful, because experimental drugs and phyto-medications specifically act by tightening the barrier22,23, which normally hinders excessive lymphocyte recruitment into the CNS24. Preventing leukocyte attachment or transmigration through the BBB and reducing its leakiness is an effective strategy in MS treatment25, and nanoparticle imaging may help to assess efficacy of candidate drugs. So far, the particles are expensive. Intravital microscopy is another technique used to visualize BBB integrity26, but it normally requires long-lasting, deep anesthesia (e.g., with ketamine and xylazine) because of the craniotomy and disallows re-awakening the mice, hence preventing time course analyses. However, intravital microscopy provides high-resolution images at the cellular to subcellular levels, which is not achievable with in vivo imaging.
Future Applications or Directions after Mastering the Technique
In summary, the imaging techniques presented in the present video help to assess the individual courses of the disease and to monitor the effects of medication, which were in part not revealed by clinical scores alone. The techniques agree with the 3 "R" principles of Replacement, Reduction and Refinement in animal experiments and are useful add-on tools in drug research.
Subscription Required. Please recommend JoVE to your librarian.
Disclosures
The authors declare that they have no competing financial interests.
Acknowledgments
This research was supported by the Deutsche Forschungsgemeinschaft (CRC1039 A3) and the research funding program "Landesoffensive zur Entwicklung wissenschaftlich-ökonomischer Exzellenz" (LOEWE) of the State of Hessen, Research Center for Translational Medicine and Pharmacology TMP and the Else Kröner-Fresenius Foundation (EKFS), Research Training Group Translational Research Innovation - Pharma (TRIP).
Materials
| Name | Company | Catalog Number | Comments |
| AngioSpark-680 | Perkin Elmer, Inc., Waltham, USA | NEV10149 | Imaging probe, pegylated nanoparticles, useful for imaging of blood brain barrier integrity |
| MMP-sense 680 | Perkin Elmer, Inc., Waltham, USA | NEV10126 | Imaging probe, activatable by matrix metalloproteinases, useful for imaging of inflammation |
| XenoLight RediJect Inflammation Probe | Perkin Elmer, Inc., Waltham, USA | 760535 | Imaging probe, activatable by oxidases, useful for imaging of inflammation |
| PLP139-151/CFA emulsion | Hooke Labs, St Lawrence, MA | EK-0123 | EAE induction kit |
| Pertussis Toxin | Hooke Labs, St Lawrence, MA | EK-0123 | EAE induction kit |
| IVIS Lumina Spectrum | Perkin Elmer, Inc., Waltham, USA | Bioluminescence and Infrared Imaging System | |
| LivingImage 4.5 software | Perkin Elmer, Inc., Waltham, USA | CLS136334 | IVIS analysis software |
| Isoflurane | Abbott Labs, Illinois, USA | 26675-46-7 | Anaesthetic |
References
- Compston, A., Coles, A. Multiple sclerosis. Lancet. 372 (9648), 1502-1517 (2008).
- Dunn, J. Impact of mobility impairment on the burden of caregiving in individuals with multiple sclerosis. Expert Rev Pharmacoecon Outcomes Res. 10 (4), 433-440 (2010).
- Dutta, R., Trapp, B. D. Mechanisms of neuronal dysfunction and degeneration in multiple sclerosis. Prog Neurobiol. 93 (1), 1-12 (2011).
- Sawcer, S., et al. Genetic risk and a primary role for cell-mediated immune mechanisms in multiple sclerosis. Nature. 476 (7359), 214-219 (2011).
- Schmitz, K., et al. R-flurbiprofen attenuates experimental autoimmune encephalomyelitis in mice. EMBO Mol Med. 6 (11), 1398-1422 (2014).
- Balls, M. The origins and early days of the Three Rs concept. Altern Lab Anim. 37 (3), 255-265 (2009).
- Barthelmes, J., et al. Induction of Experimental Autoimmune Encephalomyelitis in Mice and Evaluation of the Disease-dependent Distribution of Immune Cells in Various Tissues. J Vis Exp. (111), (2016).
- Leahy, A. A., et al. Analysis of the trajectory of osteoarthritis development in a mouse model by serial near-infrared fluorescence imaging of matrix metalloproteinase activities. Arthritis Rheumatol. 67 (2), 442-453 (2015).
- Scales, H. E., et al. Assessment of murine collagen-induced arthritis by longitudinal non-invasive duplexed molecular optical imaging. Rheumatology (Oxford). 55 (3), 564-572 (2016).
- Nahrendorf, M., et al. Dual channel optical tomographic imaging of leukocyte recruitment and protease activity in the healing myocardial infarct. Circ Res. 100 (8), 1218-1225 (2007).
- Eaton, V. L., et al. Optical tomographic imaging of near infrared imaging agents quantifies disease severity and immunomodulation of experimental autoimmune encephalomyelitis in vivo. J Neuroinflammation. 10, (2013).
- Kandagaddala, L. D., Kang, M. J., Chung, B. C., Patterson, T. A., Kwon, O. S. Expression and activation of matrix metalloproteinase-9 and NADPH oxidase in tissues and plasma of experimental autoimmune encephalomyelitis in mice. Exp Toxicol Pathol. 64 (1-2), 109-114 (2012).
- Wang, C., et al. In situ fluorescence imaging of myelination. J Histochem Cytochem. 58 (7), 611-621 (2010).
- Wang, C., et al. Longitudinal near-infrared imaging of myelination. J Neurosci. 31 (7), 2382-2390 (2011).
- Engelhardt, B. Molecular mechanisms involved in T cell migration across the blood-brain barrier. J Neural Transm. 113 (4), 477-485 (2006).
- Badawi, A. H., et al. Suppression of EAE and prevention of blood-brain barrier breakdown after vaccination with novel bifunctional peptide inhibitor. Neuropharmacology. 62 (4), 1874-1881 (2012).
- Simmons, S. B., Pierson, E. R., Lee, S. Y., Goverman, J. M. Modeling the heterogeneity of multiple sclerosis in animals. Trends in immunology. 34 (8), 410-422 (2013).
- Lin, T. H., et al. Diffusion fMRI detects white-matter dysfunction in mice with acute optic neuritis. Neurobiol Dis. 67, 1-8 (2014).
- Knier, B., et al. Neutralizing IL-17 protects the optic nerve from autoimmune pathology and prevents retinal nerve fiber layer atrophy during experimental autoimmune encephalomyelitis. J Autoimmun. 56, 34-44 (2015).
- Schellenberg, A. E., Buist, R., Yong, V. W., Del Bigio, M. R., Peeling, J. Magnetic resonance imaging of blood-spinal cord barrier disruption in mice with experimental autoimmune encephalomyelitis. Magn Reson Med. 58 (2), 298-305 (2007).
- Mori, Y., et al. Early pathological alterations of lower lumbar cords detected by ultrahigh-field MRI in a mouse multiple sclerosis model. Int Immunol. 26 (2), 93-101 (2014).
- Bittner, S., et al. Endothelial TWIK-related potassium channel-1 (TREK1) regulates immune-cell trafficking into the CNS. Nat Med. 19 (9), 1161-1165 (2013).
- Theien, B. E., et al. Differential effects of treatment with a small-molecule VLA-4 antagonist before and after onset of relapsing EAE. Blood. 102 (13), 4464-4471 (2003).
- Hawkins, B. T., Davis, T. P. The blood-brain barrier/neurovascular unit in health and disease. Pharmacol Rev. 57 (2), 173-185 (2005).
- Coisne, C., Mao, W., Engelhardt, B. Cutting edge: Natalizumab blocks adhesion but not initial contact of human T cells to the blood-brain barrier in vivo in an animal model of multiple sclerosis. J Immunol. 182 (10), 5909-5913 (2009).
- Andresen, V., et al. High-resolution intravital microscopy. PLoS One. 7 (12), e50915 (2012).
- Bukilica, M., et al. Stress-induced suppression of experimental allergic encephalomyelitis in the rat. Int J Neurosci. 59 (1-3), 167-175 (1991).
