JoVE Science Education
Microbiology
A subscription to JoVE is required to view this content.  Sign in or start your free trial.
JoVE Science Education Microbiology
Growth Curves: Generating Growth Curves Using Colony Forming Units and Optical Density Measurements
  • 00:01Concepts
  • 03:44Set-Up
  • 08:52Data Analysis and Results

Curvas de crescimento: gerando curvas de crescimento usando unidades formadoras de colônias e medições de densidade óptica

English

Share

Overview

Fonte: Andrew J. Van Alst1, Rhiannon M. LeVeque1, Natalia Martin1, e Victor J. DiRita1
1 Departamento de Microbiologia e Genética Molecular, Michigan State University, East Lansing, Michigan, Estados Unidos da América

As curvas de crescimento fornecem informações valiosas sobre cinética de crescimento bacteriano e fisiologia celular. Eles nos permitem determinar como as bactérias respondem em condições variáveis de crescimento, bem como definir parâmetros ideais de crescimento para uma determinada bactéria. Uma curva de crescimento arquetípico progride através de quatro estágios de crescimento: defasagem, exponencial, estacionária e morte (1).

Figure 1
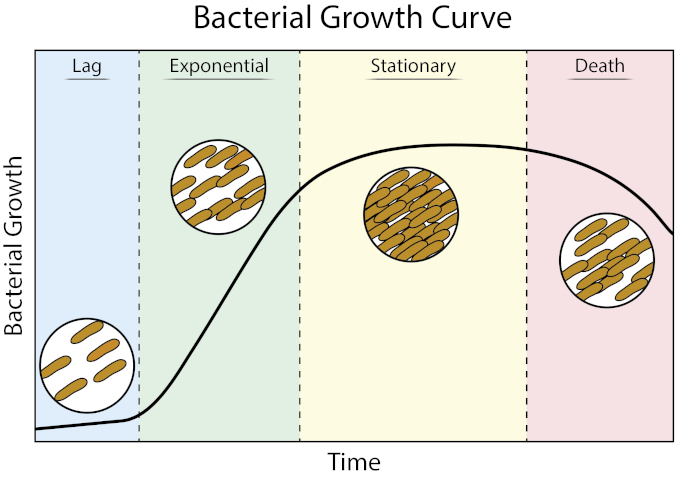
Figura 1: Curva de crescimento bacteriano. Bactérias cultivadas em crescimento cultural em lote através de quatro fases de crescimento: defasagem, exponencial, estacionária e morte. A fase de defasagem é o período de tempo que leva para as bactérias chegarem a um estado fisiológico capaz de rápido crescimento celular e divisão. A fase exponencial é o estágio de crescimento e divisão celular mais rápido durante o qual a replicação do DNA, transcrição de RNA e produção de proteínas ocorrem em uma taxa constante e rápida. A fase estacionária é caracterizada por uma desaceleração e planalto do crescimento bacteriano devido à limitação de nutrientes e/ou acúmulo intermediário tóxico. A fase de morte é o estágio durante o qual a lise celular ocorre como resultado de uma severa limitação de nutrientes.

A fase de defasagem é o período de tempo que leva para as bactérias chegarem a um estado fisiológico capaz de rápido crescimento celular e divisão. Essa defasagem ocorre porque leva tempo para as bactérias se adaptarem ao seu novo ambiente. Uma vez que os componentes celulares necessários são gerados em fase de defasagem, as bactérias entram na fase exponencial de crescimento onde a replicação do DNA, transcrição de RNA e produção de proteínas ocorrem em uma taxa constante e rápida (2). A taxa de rápido crescimento celular e divisão durante a fase exponencial é calculada como o tempo de geração, ou o tempo de duplicação, e é a taxa mais rápida na qual as bactérias podem se replicar sob as condições determinadas (1). O tempo de duplicação pode ser usado para comparar diferentes condições de crescimento para determinar qual é mais favorável para o crescimento bacteriano. A fase de crescimento exponencial é a condição de crescimento mais reprodutível, pois a fisiologia celular bacteriana é consistente em toda a população (3). A fase estacionária segue a fase exponencial onde o crescimento celular planalto. A fase estacionária é provocada devido ao esgotamento de nutrientes e/ou ao acúmulo de intermediários tóxicos. As células bacterianas continuam a sobreviver nesta fase, embora a taxa de replicação e divisão celular seja drasticamente reduzida. A fase final é a morte, onde o esgotamento severo de nutrientes leva ao lise das células. Características da curva de crescimento que fornecem mais informações incluem a duração da fase de lag, o tempo de duplicação e a densidade celular máxima alcançada.

A quantificação de bactérias na cultura em lote pode ser determinada utilizando unidades formadoras de colônias e medidas de densidade óptica. A enumeração por unidades formadoras de colônias (UFC) fornece uma medição direta da contagem de células bacterianas. A unidade padrão de medida para a UFC é o número de bactérias culturaáveis presentes por 1 mL de cultura (UFC/mL) determinado por técnicas de diluição serial e revestimento de spread. Para cada ponto de tempo, é realizada uma série de diluição de 1:10 da cultura do lote e 100 μl de cada diluição é espalhada banhada por meio de um espalhador de células.

Figure 2
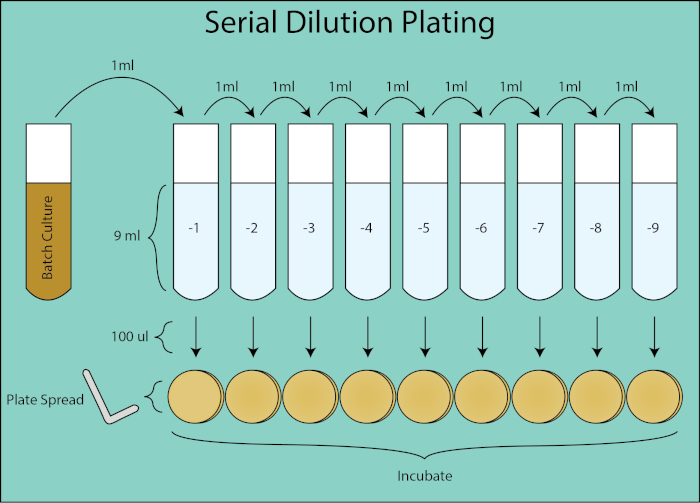
Figura 2. Esquema de revestimento de diluição serial. Fluxo geral para diluição de revestimento da cultura de lote. A cultura do lote é diluída em série 1:10 transferindo 1 mL da diluição anterior para o tubo subsequente contendo PBS de 9ml. A partir de cada tubo de diluição, 100 μl é espalhado banhado por meio de um espalhador de placa que é uma diluição adicional de 1:10, pois é 1/10do volume de 1 mL no cálculo da UFC/mL. As placas são incubadas e enumeradas assim que colônias clonais crescem nas placas.

As placas são então incubadas durante a noite e colônias clonais enumeradas. A placa de diluição que cresceu 30-300 colônias é usada para calcular a UFC/mL para o ponto de tempo dado (4, 5). A variação estocástica na contagem de colônias abaixo de 30 estão sujeitas a maior erro no cálculo da UFC/mL e colônias de contagem superiores a 300 podem ser subestimadas devido à aglomeração e sobreposição de colônias. Utilizando o fator de diluição para a placa dada, a UFC da cultura do lote pode ser calculada para cada ponto de tempo.

A densidade óptica dá uma aproximação instantânea da contagem de células bacterianas medida usando um espectrofotômetro. A densidade óptica é uma medida de absorção de partículas de luz que passam por 1cm de cultura e detectadas por um sensor de fotodiodo (6). A densidade óptica de uma cultura é medida em relação a uma mídia em branco e aumenta à medida que a densidade bacteriana aumenta. Para células bacterianas, um comprimento de onda de 600 nm (OD600) é normalmente usado ao medir a densidade óptica (4). Ao gerar uma curva padrão que relaciona unidades de formação de colônias e densidade óptica, a medição da densidade óptica pode ser usada para aproximar prontamente a contagem de células bacterianas de uma cultura de lote. No entanto, essa relação começa a se deteriorar já em 0,3 OD600 à medida que as células começam a mudar de forma e acumular produtos extracelulares na mídia, influenciando a leitura da densidade óptica no que se refere à UFC (7). Este erro torna-se mais pronunciado durante as fases estacionárias e de morte.

Aqui, Escherichia coli é cultivada em caldo luria-bertani (LB) a 37°C ao longo de 30 horas (7). Tanto as curvas de crescimento da UFC/mL quanto da densidade óptica foram geradas, bem como a curva padrão que relaciona a densidade óptica à UFC.

Figure 3
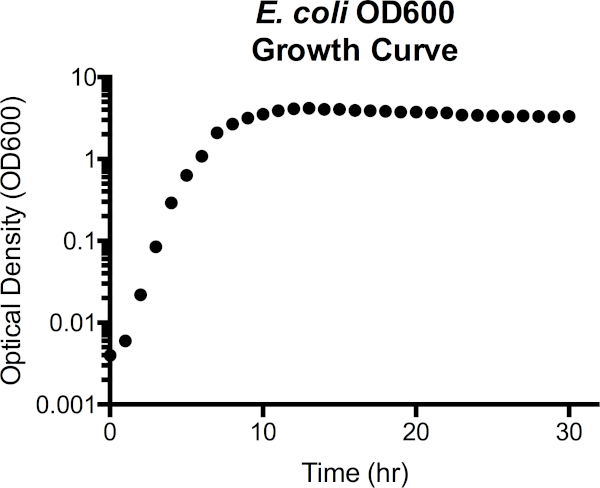
Figura 3. Escherichia coli densidade óptica a 600 nm comprimento de onda (OD600) curva de crescimento. Os valores de densidade óptica foram retirados diretamente do espectotômetro após o em branco com mídia LB estéril. Os valores OD600 superiores a 1,0 foram diluídos 1:10 combinando cultura de 100 μl com 900 μl de LB fresco, novamente medido, e depois multiplicado por 10 para obter o valor OD600. Este passo é dado à medida que a precisão na medição do espectotômetro é reduzida a alta densidade celular. A partir da curva, a fase de defasagem se estende para cerca de 1h de crescimento, passa para fase exponencial de 2h às 7h, então começa a planar, entrando em fase estacionária. A fase da morte não é uma transição acentuada, no entanto, como a densidade óptica gradualmente começa a diminuir após 15h.

Figure 4
Figura 4. Curva de crescimento da colônia Escherichia coli por mililitro (CFU/mL). Os valores de UFC/mL para cada ponto de tempo foram calculados a partir da placa de diluição que continha 30-300 colônias. A partir da curva, a fase de lag se estende para cerca de 2h de crescimento, passa para fase exponencial das 2h às 7h, então começa a planar, entrando em fase estacionária. A fase de morte não é uma transição acentuada, no entanto, como a UFC/mL gradualmente começa a diminuir após 15h de um pico de 2 x 10⁹ para aproximadamente 5 x 10⁸ às 30 horas.

Figure 5
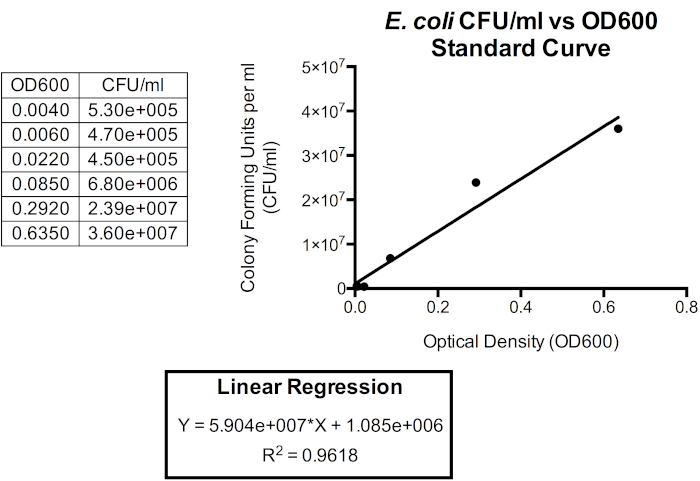
Figura 5. Curva de padronização para CFU/mL versus OD600. Uma regressão linear pode ser usada para relacionar essas unidades para que a densidade óptica possa ser usada para aproximar a densidade celular bacteriana. A densidade óptica pode ser usada para fornecer e aproximação instantânea da UFC/mL da cultura do lote. Aqui, apenas os primeiros seis pontos de tempo são traçados à medida que a relação entre OD600 e CFU/mL é menos precisa além de 1.0 OD600 à medida que a forma celular e os produtos extracelulares começam a se acumular à medida que as bactérias entram em fase estacionária, que ocorre pouco depois de atingir 1,0 OD600. Mudanças na forma celular e produtos extracelulares na mídia influenciam a leitura da densidade óptica e, portanto, a relação entre densidade óptica e o número de bactérias na cultura também é impactada.

O tempo de duplicação também foi determinado em 15 minutos e 19 segundos. A partir desse dado, a capacidade de crescimento da LB para E. coli pode ser visualizada e ser usada para comparação entre diferentes mídias ou bactérias.

Procedure

1. Configuração Materiais de laboratório necessários: mídia líquida, mídia de ágar solidificada, frascos de Erlenmeyer, tubos de ensaio de 15 mL, soro fisiológico tamponado de fosfato (PBS), espalhador de células bacterianas, 70% de etanol e um espectotógrafo. Todas as soluções e vidros devem ser esterilizados antes do uso. Prepare a estação de trabalho esterilizando com 70% de etanol. Trabalhe perto de um queimador bunsen para evitar a contaminação da mídia. <…

Results

Plots of colony forming units and optical density are two ways to visualize growth kinetics. By determining the relationship between CFU/mL and OD600, the optical density plot also provides an estimate of CFU/mL over time. Conditions that result in the shortest doubling time are considered optimal for growth of the given bacteria.

Applications and Summary

Growth curves are valuable for understanding the growth kinetics and physiology of bacteria. They allow us to determine how bacteria respond in variable growth conditions as well as define the optimal growth parameters for a given bacterium. Colony forming unit and optical density plots both contain valuable information depicting the duration of lag phase, maximum cell density reached, and allowing for the calculation of bacterial doubling time. Growth curves also allow for comparison between different bacteria under the same growth conditions. Additionally, optical density provides a means of standardizing initial inoculums, enhancing consistency in other experiments.

Determining which approach to use when designing a growth curve experiment requires consideration. As the preferred method for generating growth curves, colony forming unit plots more accurately reflect the viable cell counts in batch culture. Colony forming unit plots also allow for measuring bacterial growth in conditions that would otherwise interfere with an optical density measurement. However, it is a more time consuming process, requiring extensive use of reagents, and must be performed manually. Optical density plots are less accurate and provide only an estimate of the colony forming units, requiring a standard curve to be generated for each unique bacteria. Optical density is primarily used for its convenience as it is far less time consuming and does not require many reagents to perform. What is most attractive to optical density, is that spectrophotometric incubators can automatically generate growth curves, vastly increasing the number of culture conditions that can be tested at once and eliminating the need to constantly attend the culture.

References

  1. R. E. Buchanan. 1918. Life Phases in a Bacterial Culture. J Infect Dis 23:109-125.
  2. CAMPBELL A. 1957. Synchronization of cell division. Bacteriol Rev 21:263-72.
  3. Wang P, Robert L, Pelletier J, Dang WL, Taddei F, Wright A, Jun S. 2010. Robust growth of Escherichia coli. Curr Biol 20:1099-103.
  4. Goldman E, Green LH. 2015. Practical Handbook of Microbiology, Third Edition. CRC Press.
  5. Ben-David A, Davidson CE. 2014. Estimation method for serial dilution experiments. J Microbiol Methods 107:214-221.
  6. Koch AL. 1968. Theory of the angular dependence of light scattered by bacteria and similar-sized biological objects. J Theor Biol 18:133-156.
  7. Sezonov G, Joseleau-Petit D, D'Ari R. 2007. Escherichia coli physiology in Luria-Bertani broth. J Bacteriol 189:8746-9.

Transcript

Bacteria reproduce through a process called cell division, which results in two identical daughter cells. If the growth conditions are favorable, bacterial populations will grow exponentially.

Bacterial growth curves plot the amount of bacteria in a culture as a function of time. A typical growth curve progresses through four stages: lag phase, exponential phase, stationary phase, and death phase. The lag phase is the time it takes for bacteria to reach a state where they can grow and divide quickly. After this, the bacteria transition to the exponential phase, characterized by rapid cell growth and division. The rate of exponential growth of the bacterial culture during this phase can be expressed as the doubling time, the fastest rate at which bacteria can reproduce under specific conditions. The stationary phase comes next, where bacterial cell growth plateaus and the growth and death rates even out due to environmental nutrient depletion. Finally, the bacteria enter the death phase. This is where bacterial growth declines sharply and severe nutrient depletion leads to the lysing of cells.

Two techniques can be used to quantify the amount of bacteria present in a culture and plot a growth curve. The first of these is via colony forming units, or CFUs. To obtain CFUs a one to ten series of nine dilutions is performed at regular time points. The first of these dilutions, negative one in this example, contains 9mL of PBS and 1mL of the bacterial culture. Resulting in a 1:10 dilution factor. Then, 1mL of this solution is transferred to the next tube, negative two, resulting in a 1:100 dilution factor. This process continues through the last tube, negative nine, resulting in a final dilution factor of 1:1 billion. After this, 100 microliters of each dilution is plated. The plates are then incubated and the clonal colonies are counted. The dilution plate for a given time point that grows between 30 and 300 colonies is used to calculate the CFUs per milliliter for that time point.

The second common method of measuring bacterial concentration is the optical density. The optical density of a culture can be measured instantly, in relation a media blank, with a spectrophotometer. Typically a wave length of 600 nanometers, also referred to as OD600, is used for these measurements, which increase as cell density increases. While optical density is less precise than CFUs, it is convenient because it can be obtained instantaneously and requires relatively few reagents. Both techniques can be used together to create a standard curve that more accurately approximates the bacterial cell count of a culture. In this video, you will learn how to obtain CFUs and OD600 measurements from timed serial dilutions of E. coli. Then, two growth curves using the CFU and OD600 measurements, respectively, will be plotted before being related by a standard curve.

When working with bacteria, it is important to use the appropriate personal protective equipment such as a lab coat and gloves and to observe proper aseptic technique.

After this, sterilize the work station with 70% ethanol. First, prepare the LB broth and LB solid agar media in separate autoclaveable bottles. After partially closing the caps of the bottles, sterilize the media in an autoclave set to 121 degrees Celsius for 35 minutes. Next, allow the agar media to cool in a water bath set to 50 degrees Celsius for 30 minutes. Once cooled, pour 20 to 25 mL into each Petri dish. After this, allow the plates to set for 24 hours at room temperature.

To prepare the single colony isolates that will later be used to produce a liquid bacterial culture, use previously frozen stock and proper streak plating technique to streak E. coli for isolation on LB agar. Incubate the dish at 37 degree Celsius overnight. After this, cool a flame sterilized inoculation loop on the agar before selecting a single colony from the streaked plate. Inoculate 4 mL of liquid media in a 15 mL test tube. Then, grow the E. coli at 37 degrees Celsius overnight with shaking at 210 rpm.

To set up the 1:1000 volume of bacterial culture that will be used in the growth curve, first obtain an autoclaved 500 mL Erlenmeyer flask. Then, use a 50 mL serological pipette to transfer 100 mL of sterile media to the flask. Next, label nine 15 ml test tubes consecutively as one through nine. These numbers correspond to the dilution factor that will be used to calculate the colony forming unit, or CFU. Then, add 9 mL of 1X PBS to each tube. After this, label the prepared agar plates with the corresponding time points and dilution factors that will be grown. In this example with E. coli, after the starting time point, time points are taken once every hour. Using the previously prepared overnight liquid E. coli culture, inoculate the media in the autoclave 500 mL Erlenmeyer flask with 1:1000 volume of culture. Swirl the media to evenly distribute the bacteria.

After blanking a spectrophotometer, clean the cuvette with a lint-free wipe. Next, dispense 1 mL of the culture into the cuvette and place it into the spectrophotometer to obtain the optical density of the culture at time point zero. Then, grow the E. coli at 37 degrees Celsius with shaking at 210 rpm. At each time point after time point zero, withdraw another 1 mL of bacterial culture from the flask and repeat the optical density measurement. If the optical density reading is greater than 1.0, dilute 100 microliters of bacterial culture with 900 microliters of fresh media and then measure the optical density once more. This value can be multiplied by 10 for the OD 600 measurement.

To obtain the colony forming unit measurement for each time point, withdraw an additional 1 mL of bacterial culture from the flask at each time point. Dispense the bacterial culture into the negative one test tube and vortex to mix. Then, perform the dilution series by first transferring 1 mL from the negative one tube into the negative two tube and vortex to mix. Transfer 1 mL from the negative two tube into the negative three tube and vortex to mix. Continue this serial transfer down all the dilution tubes to the negative nine tube. Dispense 100 microliters of cell suspension onto the correspondingly labeled plate for each dilution. For every dilution, sterilize a cell spreader in ethanol, pass it through a Bunsen burner flame, and cool it by touching the surface of the agar away from the inoculate. Then, use the cell spreader to spread the cell suspension until the surface of the agar plate becomes dry. Incubate the plates upside down at 37 degrees Celsius. Once visible colonies arise, count the number of bacterial colonies on each plate. Record these values and their associated dilution factors for each plate at each time point.

To create an OD 600 growth curve, after ensuring all the data points are entered correctly into a table, select all of the time points and their corresponding data. To generate a colony forming unit growth curve plot, choose the dilution plate where the colony counts fell within the range 30 to 300 bacteria for each time point. Multiply the colony count number by the dilution factor, and then by ten. This is because the 100 microliters spread is considered an additional 1:10 dilution when calculating colony forming units per milliliter. After this, plot the colony forming units versus time on a semi-log scale.

These plots produced with OD 600 and CFU measurements, respectively, can provide valuable information on E. coli growth kinetics. The optical density and colony forming units can be related, so that CFUs per milliliter can be estimated from OD 600 measurements, saving time and materials in future experiments.

To do this, plot the colony forming units against the optical density on a linear scale for OD 600 readings less than or equal to 1. 0. After this, generate a linear regression trend line in Y = MX + B format, where M is the slope and B is the y-intercept. Right click on the data points and select add trend line and linear. Then, check the box to display the equation on the chart and display the R squared value on the chart. The R squared value is the statistical measurement of how closely the data matched the fitted regression line. In this example, the first 6 time points are plotted with OD 600 on the x axis and CFUs per milliliter on the y axis. In future experiments with the same growth conditions, these slope and y-intercept values can be plugged into this equation to estimate CFUs from OD 600 readings. Next, look at the colony forming unit growth curve plot. During the exponential phase, identify two time points with the steepest slope between them. To calculate the doubling time, first calculate the change in time between the selected time points. Then, calculate the change in generations using the equation shown here. Here, lower case b is the number of bacteria at time point three and upper case B is the number of bacteria at time point two. Finally, divide the change in time by the change in generations. In this example, the doubling time is 0. 26 hours or 15 minutes and 19 seconds. Comparing doubling times across different experimental treatment allows us to identify the best growth conditions for a certain bacterial species. Therefore, the treatment with the lowest doubling time will be most optimal of the conditions tested.

Tags

Cite This
JoVE Science Education Database. JoVE Science Education. Growth Curves: Generating Growth Curves Using Colony Forming Units and Optical Density Measurements. JoVE, Cambridge, MA, (2023).