We describe the imaging approaches we use to investigate the distribution and mobility of the transfected fluorescent proteins resident in the endoplasmic reticulum (ER) by means of the confocal imaging of living cells. We also ultrastructurally analyze the effect of their expression on the architecture of this subcellular compartment.
The lipids and proteins in eukaryotic cells are continuously exchanged between cell compartments, although these retain their distinctive composition and functions despite the intense interorganelle molecular traffic. The techniques described in this paper are powerful means of studying protein and lipid mobility and trafficking in vivo and in their physiological environment. Fluorescence recovery after photobleaching (FRAP) and fluorescence loss in photobleaching (FLIP) are widely used live-cell imaging techniques for studying intracellular trafficking through the exo-endocytic pathway, the continuity between organelles or subcompartments, the formation of protein complexes, and protein localization in lipid microdomains, all of which can be observed under physiological and pathological conditions. The limitations of these approaches are mainly due to the use of fluorescent fusion proteins, and their potential drawbacks include artifactual over-expression in cells and the possibility of differences in the folding and localization of tagged and native proteins. Finally, as the limit of resolution of optical microscopy (about 200 nm) does not allow investigation of the fine structure of the ER or the specific subcompartments that can originate in cells under stress (i.e. hypoxia, drug administration, the over-expression of transmembrane ER resident proteins) or under pathological conditions, we combine live-cell imaging of cultured transfected cells with ultrastructural analyses based on transmission electron microscopy.
The discovery of green fluorescent protein (GFP) and its spectral variants, and the parallel development of fluorescence microscopy, have opened up completely new avenues for the investigation of protein behavior in cells. Techniques such as fluorescence recovery after photobleaching (FRAP) and fluorescence loss in photobleaching (FLIP), which are possible because of the intrinsic capacity of fluorophores to extinguish their fluorescence under intense illumination, are based on confocal live-cell imaging and the use of transfected fluorescent fusion proteins1-3. They are widely used to assess not only the localization of proteins, but also their mobility and vesicular transport, which can reveal important clues concerning their function4.
The unique feature of eukaryotic cells is the presence of intracellular compartments that have specific lipid and protein compositions. Although organelles are physically isolated, they need to communicate with each other and share molecular components in order to maintain cellular homeostasis. The secretory pathway guarantees that the proteins and lipids synthesized in the ER reach the correct final destination in which they exert their function. Intracellular organelles can also be connected by dynamic contact sites that allow molecules (lipids) to be directly exchanged between compartments. Moreover, many proteins have to assembled in large heteromeric complexes or associated with specific lipid species (lipid rafts/microdomains) in order to become functionally active or to be transported to their final destination. All of these biological aspects greatly influence the kinetic properties of proteins, and can therefore be appropriately investigated by means of the techniques described below.
Our group has widely used FRAP and FLIP combined with electron microscopy in order to study the architecture of the ER and its different subdomains. The ER is the first station of the secretory pathway and plays a key role in protein and lipid sorting5. It is a highly dynamic organelle whose distinct subdomains reflect its many different functions (i.e. protein and lipid biosynthesis and trafficking, protein folding, Ca2+ storage and release, and xenobiotic metabolism). However, although they are morphologically, spatially, and functionally distinct, these domains are continuous with each other, and their relative abundance can be modified in cells under physiological and pathological conditions. The best known and usually spatially segregated domains of the ER are the nuclear envelope, and the smooth and rough ER; however, we and others have demonstrated that there are ER structures with a more elaborate architecture and three-dimensional organization in various cell types and tissues under physiological conditions that can also be induced by means of stressful stimuli such as hypoxia, drug administration, or the over-expression of ER-resident transmembrane proteins2,6 (and references therein).
We have also recently demonstrated the presence of such structures in cell models of human diseases1,7. Originating from the stacked cisternae of smooth ER, they were given the collective name of organized smooth endoplasmic reticulum (OSER) in 20036, although they are also known as karmellae, lamellae, and crystalloid ER on the basis of their architecture which, like their size, can vary. After the cells are transfected with GFP fused to the cytosolic region of tail-anchored (TA) ER-resident proteins (dEGFP-ER), the weakly dimerizing tendency of GFP in trans dramatically alters the organization and structure of the ER. FRAP and FLIP experiments showed that dEGFP-ER is free to diffuse within OSERs, and the fact that it moves from the reticular ER to the OSER and vice versa indicates that the aggregates are continuous with the surrounding reticular ER. Ultrastructural analysis has allowed us to correlate the fluorescence data with a detailed description of OSER architecture and organization at nanoscale level: OSERs are always made up of stacks of paired cisternae of smooth ER but may have different forms of spatial organization, such as regularly arranged sinusoidal arrays or whorls, or hexagonal "crystalloid" tubular arrays. These rearrangements lead to cubic morphologies8 which, as they have been found in cells under physiological conditions9 and following stresses such as hypoxia10, drug treatment11, and cancer9, may have significant potential as ultrastructural markers.
After this first demonstration using GFP fusion proteins, we used imaging experiments to analyze the proliferation of ER domains in response to pharmacological treatments12, assess the tendency of fluorescent proteins to oligomerise in cells13, and to investigate the role of a mutant, ALS-linked TA protein in the formation of intracellular aggregates of ER origin that may be relevant to its pathogenicity1,8. It has been suggested that the formation of intracellular aggregates (which occurs in many neurodegenerative diseases14) may be a protective mechanism designed to prevent the interactions between toxic mutant proteins and the surrounding cell components15.
What follows is a description of a combination of optical and electron microscopy methods for investigating constructs whose C-terminal hydrophobic domains are inserted into the membrane of the ER, and an analysis of their dynamic behavior and the effects of their over-expression on ER domain architecture in cultured cells (see Figure 1 for a flowchart of the experimental protocol).
1. Plasmid, Cell Culture, and Transfection with ER Fluorescent Proteins
2. Live Fluorescence Scanning Confocal Microscopy
3. Ultrastructural Analysis by Means of Transmission Electron Microscopy
Given the toxicity of many of the reagents, all of the procedures should be carried out wearing an appropriate lab. coat and gloves under a fume hood.
Figure 2 shows an example FRAP study of protein mobility. The mobility of dEGFP-ER protein is demonstrated by the rapid fluorescence recovery after photobleaching in bleached OSERs. For the quantitative analysis, the half time and mobile fraction were derived from experimentally measured data by fitting the following monoexponential equation:
F(t) = Fpost + (Frec-Fpost)(1-e-t/τ)
where Fpost is the fluorescence signal after photobleaching, Frec is the maximum fluorescence recovery value that is reach after bleaching, t the time of registration and τ the time constant.
Please note the importance of acquiring images without saturated pixels that could alter the fluorescence recovery and, consequently, the protein mobility analysis. It is also essential to always normalize the fluorescence signal in the bleached ROI to the total fluorescence of the same cell in order to consider fluorescence intensity variations due to bleaching during image acquisition or small changes in the focus plane.
An example of a FLIP experiment to study the continuity between intracellular compartments is shown in Figure 3. OSERs are physically connected with the rest of the ER as demonstrated by the progressive emptying of the ER when the OSER domain is continuously bleached.
For a proper analysis, the acquisition of saturated pixels must be avoided (see above); furthermore, the acquisition parameters must be set up with laser powers as low as possible in order to avoid photobleaching due to image acquisition. For this reason it is strongly recommended to image an unbleached cell in the same field that will be used to normalize the fluorescence signal of the bleached cell.
All experiments have to be performed in the presence of cycloheximide, a translation inhibitor, in order to avoid any increase in the ER fluorescence signal (and consequently total fluorescence) due to protein biosynthesis.
Transmission electron microscopy demonstrated that the fluorescent aggregates observed in cultured cells transfected with dEGFP-ER represent patches of smooth and flattened ER cisternae that spatially organized themselves into well-defined 3D geometries classified on the basis of their patterns: linear or curved stacks (often associated with the nuclear envelope, not shown) (Figures 4A and B) that may be continuous with regions of sinusoidal ER (Figure 4A); the membranes in some regions are organized into lattices with a square or hexagonal symmetry (crystalloid ER, not shown). Adjacent cisternae are separated by a thin layer of slightly electron-dense cytoplasm about 11 nm thick that is continuous with the cytoplasm surrounding the aggregates.
Figure 1. Flow chart of the experimental procedure. The cultured cells are first transfected with jetPEI (see Protocol) in order to over-express the fluorescent fusion protein of interest. After 24 hr, the live transfected cells are visualized and FRAP and FLIP experiments are performed using a confocal microscope equipped with a controlled temperature CO2 incubator, and the recorded images are exported and analyzed using appropriate software (e.g. ImageJ). For the ultrastructural analysis, the transfected cells are fixed, pelleted and embedded in epon epoxy resin blocs. Ultrathin sections are obtained using a diamond knife, collected on copper grids, and observed under a transmission electron microscope. Click here to view larger figure.
Figure 2. FRAP experiment using COS-7 cells transiently transfected with dEGFP-ER. A) Two OSER structures (red ROIs) were bleached, and fluorescence recovery was recorded over time. Clear fluorescence recovery can be detected 1 min post-bleaching, and the signal further increases 4 min later (scale bar 10 μm). B): Quantitative analysis of the FRAP experiment showing the recovery half-time and the mobile fraction of the dEGFP-ER protein. Click here to view larger figure
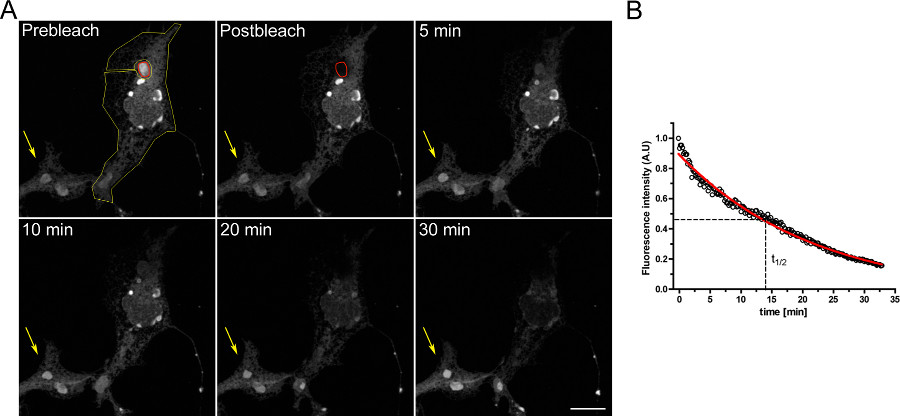
Figure 3. FLIP experiment using COS-7 cells transiently transfected with dEGFP-ER. A) The continuous bleaching of an OSER (indicated by the red ROI) causes a progressive decrease in fluorescence in the rest of the ER and in other OSER structures within the same cell (indicated by the yellow ROI). The yellow arrow indicates a portion of an unbleached cell in which the fluorescence signal is constant over time. (Scale bar 10 μm). B) Quantitative analysis of the FLIP experiment. Click here to view larger figure
Figure 4. After fixation and embedding, cells expressing high levels of dEGFP-ER in which OSER structures could be detected by means of fluorescence optical microscopy were observed through a transmission electron microscope. A) Low magnification view of a portion of cytoplasm of a cell containing an OSER consisting of stacked cisternae and undulating sinusoidal membranes. Mitochondria (M) can be seen clustered around the OSER structures, whereas ribosomes decorate only the membranes of the outermost cisternae (arrowheads and inset). The 11 nm thick electron-dense space between the membranes is continuous with the cytoplasm (arrow and inset) (L = lysosomes/(auto-)phagosomes) (scale bar 1.5 μm; inset 0.25 μm). B) An OSER can be formed by lamellar ER: i.e. stacks of flattened ER cisternae that can be continuous or fragmented in their appearance in thin sections. Vesicles budding from the outermost cisternae of the stack can occasionally be observed (asterisk) (PM, plasma membrane) (Scale bar 150 nm).
The protocols and imaging approaches described in this paper have been used to investigate the distribution and mobility of transfected TA fluorescent proteins resident in the ER of living cells. We have also analyzed the effect of the over-expression of these proteins on the architecture of this subcellular compartment by means of ultrastructural analyses.
The combination of live-cell confocal imaging and electron microscopy represents is a very powerful means of investigating the dynamic properties of proteins, and may provide important information concerning protein function. The described methods are not time consuming (typically three days of work), and the development of many user-friendly software applications for image acquisition and analysis makes photobleaching-based, live-cell imaging relatively simple.
The main limitation of these techniques is the use of fluorescent fusion proteins because the fluorescent tag can affect the proper folding and/or assembly of the protein of interest. In addition, over-expression can alter the behavior of transfected, fluorescently tagged proteins, and may therefore not reflect the real properties of endogenous proteins; however, this can be overcome by using of inducible and stably transfected cells in which the expression level can be precisely modulated to obtain levels comparable with those of the endogenous protein1,7. The tendency of FPs to oligomerise has been widely documented and could significantly alter the behavior (i.e. kinetics, unwanted protein-protein interactions and formation of aggregates) of chimeric proteins. The use of optimized monomeric fluorescent proteins should therefore be considered17.
Another critical aspect of dynamic imaging studies using fluorescence and photobleaching is the time needed to bleach the fluorescence efficiently and measure fluorescence recovery (and thus protein mobility) precisely, which also depends on the area of the ROI and local cell thickness. If a given GFP-tagged protein has a high diffusion coefficient, diffusion could occur during the bleaching and thus interfere with recovery time measurements. In order to obtain rapid and efficient bleaching, it is strongly recommended that a "zoom in" function (if available) and more than one laser line be used. Although the use of a fast scan module (i.e. a resonant scanner) can greatly improve the speed of imaging during the recovery phase of an experiment, in our hands it also considerably reduces bleaching efficiency. However, alternative scanning systems (such as a spinning disc equipped with a dedicated photobleaching device), and more powerful lasers can improve both bleaching efficiency and acquisition speed.
Most fluorescent proteins used in FRAP and FLIP experiments show some degree of reversible photobleaching and blinking that must be considered when performing quantitative analyses. The fluctuations between fluorescent and dark states occur in the second to minute time-scale. For EGFP, It has been shown that during bleaching experiments, fluorescence variations might involve less than 10% of the molecules, thus in the present protocol this phenomenon is negligible. If all conditions are kept constant, this will introduce a constant bias in the results. If other fluorescent proteins are used, in which the reversible fraction is significantly higher (i.e. YFP), or to detect and evaluate photobleaching reversibility, this can be done by measuring fluorescence recovery after photobleaching in the entire living cell; if recovery is observed this can only be the result of photobleaching reversibility18.
The potential toxicity of light during the experiments is another critical factor, particularly because photobleaching requires strong lighting. It is well known that excited fluorophores tend to react with oxygen to produce free radicals that can affect various intracellular processes and even cell viability19, and so it is necessary to establish a balance between efficient bleaching and minimal phototoxicity; furthermore, cell viability should always be checked after live-cell imaging experiments. Given the short recording time, we did not consider the genotoxic effect of short wavelength light (405 nm) in the example described in this paper but, if a longer experiment is needed, a 405 nm laser line should not be used.
We chose not to use a correlative approach to transmission electron microscopy because of the heterogeneous nature of OSER architecture and the fact that we wanted to observe as many cells (and structures) as possible. The diversity of the fine structure of protein aggregates in cells may be a key feature of different diseases and we were interested in obtaining a broad range of samples, whereas a correlative approach allows the observation of fewer events during the same period time. However, correlative light-electron microscopy (CLEM) should be the first choice when investigating events in structures that cannot be easily identified (such as less prominent ER subdomains) or in a limited number of cells (such as micro-injected cells). It is worth noting that our experiments were characterized by a high degree of transfection efficiency (at least 30% of the cells were transfected), otherwise the possibility of observing OSER structures noncorrelatively is quite limited.
The authors have nothing to disclose.
The authors are grateful to Fondazione Filarete for its help and support in the publication of this article. We would also like to thank Centro Europeo di Nanomedicina for the use of the TECNAI G2 transmission electron microscope.
Name of Material/ Equipment | Company | Catalog Number | Comments/Description |
Dulbecco’s Modified Eagle medium (DMEM) | Invitrogen | 41966029 | |
Dulbecco’s Modified Eagle medium (DMEM) w/o phenol red | Invitrogen | 31053028 | |
Fetal Bovine Serum (FBS) | Invitrogen | 10270106 | |
Pen/Strep | Invitrogen | 15140-122 | |
L-Glutamine 200 mM solution | Invitrogen | 25030-024 | |
jetPEI | Polyplus Transfection | PP10110 | |
OxyFluor | Oxyrase Inc. | OF-0005 | |
Glutaraldehyde Grade I | Sigma Aldrich | G5882 | |
Sodium Cacodylate Trihydrate | Sigma Aldrich | C0250 | |
Osmium Tetroxide 4% solution | Electron Microscopy Science | 19150 | |
Uranyl Acetate dihydrate | Sigma Aldrich | 73943 | slightly radioactive |
Propylene Oxide | Sigma-Aldrich | 82320 | |
EPON embedding medium kit | Sigma-Aldrich | 45359-1EA-F | |
Lead Citrate | Electron Microscopy Science | 17800 | |
Bench top centrifuge | Eppendorf | 5415 D | |
Spectral Confocal Microscope | Leica Microsystems | TCS SP5 | |
CO2 Microscope Cage Incubation System | OkoLab | ||
Ultramicrotome | Leica Microsystems | UC6 | |
Diamond knife | Diatome | Ultra 45 ° | |
Transmission Electron Microscope | FEI | Tecnai G2 | |
GraphPad Prism Software | GraphPad Software, Inc | ||
steel culture cell chamber for 24 mm coverslip | Bioscience Tools | CSC-25 | |
Electron Microscopy grids | Electron Microscopy Science | G300Cu |