A high-throughput protocol was developed for combined proteomics and glycomics purification and LC-MS/MS quantification in plasma. Deamidation analysis of N-linked glycosylation motifs was specific to deglycosylated sites. Accurate quantitation of N-glycans was achieved by coupling filter aided N-glycan separation to the individuality normalization when labeling with glycan hydrazide tags strategy.
Method Article
A Quantitative Glycomics and Proteomics Combined Purification Strategy
* These authors contributed equally
In This Article
Summary
Abstract
There is a growing desire in the biological and clinical sciences to integrate and correlate multiple classes of biomolecules to unravel biology, define pathways, improve treatment, understand disease, and aid biomarker discovery. N-linked glycosylation is one of the most important and robust post-translational modifications on proteins and regulates critical cell functions such as signaling, adhesion, and enzymatic function. Analytical techniques to purify and analyze N-glycans have remained relatively static over the last decade. While accurate and effective, they commonly require significant expertise and resources. Though some high-throughput purification schemes have been developed, they have yet to find widespread adoption and often rely on the enrichment of glycopeptides. One promising method, developed by Thomas-Oates et al., filter aided N-glycan separation (FANGS), was qualitatively demonstrated on tissues. Herein, we adapted FANGS to plasma and coupled it to the individuality normalization when labeling with glycan hydrazide tags strategy in order to achieve accurate relative quantification by liquid chromatography mass spectrometry and enhanced electrospray ionization. Furthermore, we designed new functionality to the protocol by achieving tandem, shotgun proteomics and glycosylation site analysis on hen plasma. We showed that N-glycans purified on filter and derivatized by hydrophobic hydrazide tags were comparable in terms of abundance and class to those by solid phase extraction (SPE); the latter is considered a gold standard in the field. Importantly, the variability in the two protocols was not statistically different. Proteomic data that was collected in-line with glycomic data had the same depth compared to a standard trypsin digest. Peptide deamidation is minimized in the protocol, limiting non-specific deamidation detected at glycosylation motifs. This allowed for direct glycosylation site analysis, though the protocol can accommodate 18O site labeling as well. Overall, we demonstrated a new in-line high-throughput, unbiased, filter based protocol for quantitative glycomics and proteomics analysis.
Introduction
In the field of proteomics, filter aided sample preparation (FASP) has been widely adopted for its ability to minimize the amount of starting material, decrease sample preparation artifacts, and maximize sample throughput1. However, such a method has yet to emerge and gain traction for the field of glycomics. Development of high-throughput, quantitative workflows are needed because of the integral role of glycosylation in biological defense and its modulation by cancer or diseases2,3. In mammals, N-glycans are composed of repeating saccharide units (hexoses (Hex), hexosamines (HexNac), sialic acids (NeuAc), and fucoses (Fuc)), which decorate a core structure (Hex3HexNac2)4 covalently bound to asparagine. Though the glycospace is considerably large when isomers are counted (>1012), it is quite small on a composition basis and molecular weights typically range from 1,000-8,000 Da5. The compositional homogeneity of the class and the hydrophilicity of glycans pose unique challenges to purification, separation, and mass spectrometry (MS) workflows6.
Traditionally, N-glycans are digested from proteins or peptides by peptide-N-glycosidase F (PNGase F) and then enriched by lectin affinity chromatography7, captured by hydrazide beads8, or purified via solid phase extraction (SPE)9,10. While these methods are all highly effective, they introduce extra steps for desalting and limit the number of samples simultaneously processed. Over the last decade, a number of high-throughput platforms for glycomics have been proposed. Kim et al. published a semi-automated method using a vacuum-operated, SPE 96-well plate11. Alternatively, an affinity-filter method (N-glyco-FASP) was developed by the Mann group, which required the initial derivatization of the filter with a composite of lectins12. Lastly, the Thomas-Oates group proposed a semi-quantitative method, the Filter Aided N-Glycan Separation (FANGS), which exploited the narrow composition size of the glycospace13. Relying on molecular weight cut-off filters, small contaminants were first washed to waste and then the N-glycans were digested and eluted. Deglycosylated proteins remain on the filter in this protocol and can be subjected to in-line FASP.
Identification and quantification of glycans by electrospray ionization (ESI) MS requires off-line separations for (partial) resolution of isomers and derivatization for detection of low-abundant species. Labeling in the individuality when normalizing with glycan hydrazide tags strategy confers compatibility with reverse-phase liquid chromatography (RPLC)14,15. The 4-phenethyl-benzohydrazide (P2PGN) hydrophobic tag mediates the hydrophilicity of the glycans, enhancing ionization by, on average, four-fold16. Though other techniques, such as permethylation17 or amine-reactive tagging chemistries18, offer similar advantages, in the hydrazide reaction, glycans are reacted 1:1 stoichiometrically in facile conditions. Relative quantification is achieved by tandem analysis of samples derivatized with native (NAT) or 13C6 stabile isotope labels (SIL).
The following method evolves FANGS for plasma applications and couples it to the P2GPN hydrophobic tag for accurate relative quantification. Furthermore, it was designed to perform shot-gun proteomics, deamidation profiling, and quantitative glycomics on a single aliquot of sample, without compromising the integrity of the analyses.
Protocol
1. Protein and Glycoprotein Denaturation and Alkylation
- For standard preparations, load 2.5 μl of a 0.1 μg/μl solution of glycoprotein (e.g. Fetuin or RNase B) onto a 30 kDa or 10 kDa molecular weight (MW) cut-off filter.
- For biological plasma samples, check the protein concentration by a standard Bradford19 or bicinchoninic acid20 (BCA) protein assay. Dilute the plasma, if necessary, with 100 mM ammonium bicarbonate (NH4HCO3) in H2O (PNGase Digest Buffer) at a pH of ~7 to contain between 10-100 mg/ml total protein. Load 2.5 μl plasma (25-250 μg protein) onto a filter.
Note: This protocol has only been tested on plasma from blood samples collected in the presence of ethylenediaminetetraacetic acid (EDTA).
- For biological plasma samples, check the protein concentration by a standard Bradford19 or bicinchoninic acid20 (BCA) protein assay. Dilute the plasma, if necessary, with 100 mM ammonium bicarbonate (NH4HCO3) in H2O (PNGase Digest Buffer) at a pH of ~7 to contain between 10-100 mg/ml total protein. Load 2.5 μl plasma (25-250 μg protein) onto a filter.
- Add 2 μl of 1 M Dithiothreitol Solution (DTT) to each sample in the filter.
- Dilute the sample with 200 μl PNGase digest buffer.
- Cap the filter sample tube and lightly vortex, being careful not to disturb the filter from its seat. Incubate the sample at 56 °C for 30 min to denature the proteins and glycoproteins.
- To alkylate the samples, add 50 μl 1 M Iodoacetamide, to give a final concentration of ~200 mM, and incubate at 37 °C for 60 min.
NOTE: If proteomics analysis is not desired, step 1.5 may be skipped. - Concentrate the denatured glycoprotein onto the filter by centrifuging samples at 14,000 x g for 40 min. Discard flow through.
2. N-linked Glycan Enzymatic Digestion
- Wash the sample with 100 μl PNGase digest buffer. Concentrate the glycoprotein on the filter at 14,000 x g for 20 min and discard flow through.
- Repeat the wash and concentrate step twice, for a total of three times, yielding a concentrate in the filter dead volume (~5 μl). Discard all flow-through.
- Discard collection vial once washes are complete. Collect all future eluents and washes in a new collection vial.
NOTE: PNGase digest buffer in H218O may be used during the PNGase F digestion step for stable isotope labeling of de-glycosylated asparagine sites, which become chemically deamidated.
- Add 2 μl of glycerol-free PNGase F (75,000 x units/ml) to filter after transferring to a fresh collection vial. Add 98 μl of PNGase digest buffer, bringing total volume to 100 μl, and gently pipette up and down on the filter to mix. Enzymatically digest the glycans under the conditions in steps 2.2.1, 2.2.2, OR 2.2.3.
NOTE: Three methods for the deglycosylation of proteins may be used. For solely glycomics analysis (no proteomics), the long incubation in step 2.2.1 is recommended. For glycomics and proteomics research, steps 2.2.2 and 2.2.3 will produce high quality peptides with minimal non-specific deamidation.- Glycomics-only digestion protocol (18hr): Incubate samples at 37 °C for 18 hr to enzymatically cleave all N-glycans.
- Spike-in digestion protocol (SPI): Incubate samples at 50 °C for 2 hr. Working quickly, remove samples and spike in an additional 2 μl of glycerol-free PNGase F (75,000 x units/ml). Lightly vortex the samples for 1-2 sec to mix. Incubate the samples at 50 °C for an additional 2 hr.
- Microwave digestion protocol (MD): Place samples in a microcentrifuge tube floating rack. Float samples in a 1 L beaker filled with 1 L of deionized (DI) water. Place the beaker in the center of a microwave oven (950 W) with a rotating plate. Microwave at 60% power (570 W) for 5 min. To cool, remove samples and hold at room temperature for 2 min. Then microwave for an additional 5 min at 60% power.
NOTE: Microwave power settings will need to be adjusted based on the maximum power output of the microwave. Average power should be held constant between models.
3. Elution of N-glycans
- Elute glycans by centrifuging the sample at 14,000 x g for 20 min at 20 °C.
- Add 100 μl of PNGase digest buffer to the filter and centrifuge at 14,000 x g for 20 min at 20 °C. Collect wash containing any remaining N-linked glycan, in the same collection vial as the eluent. Repeat twice. Remove filter and place in new collection vial.
- Incubate glycan samples in the -80 °C freezer until frozen (30-60 min). Dry to completion, at room temperature, in vacuum concentrator (4-6 hr).
NOTE: N-glycans may be stored at -20 °C for up to six months prior to derivatization.
4. Protein FASP Digestion
NOTE: If proteomics or deamidation site analysis is not desired, section 4 of the protocol may be skipped.
- Rinse the filter, containing the deamidated peptides, with 400 μl of 8 M urea buffer. Cap the collection vial and lightly vortex to mix. Concentrate on the filter at 14,000 x g for 15 min. Discard all flow-through.
- Repeat step 4.1 two additional times, for a total of three urea buffer washes.
- Rinse the filter, containing the deamidated peptides, with 400 μl of 2 M urea, 10 mM CaCl2 buffer (trypsin digest buffer). Cap the collection vial and lightly vortex to mix. Concentrate on the filter at 14,000 x g for 15 min. Discard all flow-through.
- Repeat step 4.1 two additional times, for a total of three trypsin digest buffer washes.
- Discard collection vial once washes are complete. Collect all future eluents and washes in a new collection vial.
- Add 50 μl porcine modified trypsin in a 1:50 or 1:5 trypsin: protein (w/w) ratio for discovery or quantitative proteomics experiments, respectively. Cap the collection vial and lightly vortex to mix.
- Incubate samples at 37 °C for 2 hr. Working quickly, remove samples and spike in an additional 50 μl of trypsin at the 1:50 or 1:5 trypsin: protein ratio. Lightly vortex the samples for 1-2 sec to mix. Incubate the samples at 50 °C for an additional 2 hr.
- Elute the peptides by spinning at 14,000 x g for 15 min.
- Rinse the remaining peptides from the filter with 400 μl 1% formic acid and 0.001% Zwittergent 3-16 (quench buffer). Elute off the filter by spinning at 14,000 x g for 15 min.
- Quantify the peptide concentration in the samples by Bradford19 or BCA assay20.
- Incubate peptide samples in the -80 °C freezer until frozen (30-60 min). Dry to completion, at room temperature, in vacuum concentrator (4-6 hr).
NOTE: Dried peptides may be stored at -20 °C for up to three months. - Resuspend tryptic proteins just prior to liquid chromatography-mass spectrometry (LC-MS) analysis in 2% acetonitrile, 98% H2O, and 0.1% formic acid (mobile phase A) to desired concentration. Tryptic peptide concentrations from 2.5 μl plasma range from 100 - 300 ng/μl.
5. Derivatization of N-linked Glycans with Hydrophobic Hydrazide Tags
- Reconstitute dried heavy (SIL) or light (NAT) P2GPN reagents in 1 ml of 75:25 MeOH:Acetic Acid (Derivatization solution), for a final concentration of 0.25 mg/ml. Reagents will take up to 10 min to fully solubilize. Extensively vortex to ensure complete solubilization.
Note: In the event this derivatization protocol is used with standard N-glycans, versus purified glycans, the molar ratio of P2GPN: glycan should be approximately (and no less) than 17: 1. - Tag dried N-glycans with 200 μl (50 μg) of SIL or NAT P2GPN reagent. Pipette up and down to resuspend dried glycans. Vortex samples and then spin down samples for ~5 sec on a bench-top centrifuge.
- React the glycans with the reagent for 3 hr at 56 °C.
- Immediately move glycans from the incubator to the vacuum concentrator. Dry to completion at 55 °C (3-5 hr).
NOTE: This step quenches the derivatization reaction; the sample must be completely dry to prevent cross-reactivity in the subsequent steps.
NOTE: Dried, tagged samples may be stored at -20 °C for up to six months. - Resuspend tagged N-glycans in 25-50 μl of H2O just prior to LC-MS analysis. Pipette up and down to ensure N-glycans are fully solubilized.
NOTE: The volume for resuspension is dependent on the starting concentration of glycoprotein, which may be estimated from the starting protein concentration. However, the range will vary per sample type and should be individually optimized. - Centrifuge samples at 14,000 x g for 5 min. Remove the supernatant, being careful not to let the tip of the pipette touch the bottom of the centrifuge tube.
Note: Excess tag may not be visible to the eye, but will be reduced by centrifugation. - Combine a pair of NAT and SIL samples, if desired for relative quantification, in a 1:1 ratio for tandem analysis.
6. Ultra-high Pressure Liquid Chromatography and Mass Spectrometry Analysis
NOTE: The LC and MS conditions described for an Easy nLC-1000 and a Q Exactive High Field, respectively, were optimized in-house for proteomics analysis and for glycan analysis21. These conditions may be adapted to other ultra-high pressure- or nano- LC systems and other high-resolving power mass spectrometers but may require slight modifications. The use of high resolving power mass spectrometry is necessary for glycan identification and deamidation analysis22,23.
NOTE: Steps 6.1-6.3 can be skipped if an appropriate reverse-phase chromatography or hydrophilic interaction commercial trap and column are used.
- Synthesize a frit in 100 μM ID capillary according to Meiring et al.24 for use as a trap.
- Pack the trap under pressure with 2.6 μM, 100 Å, C18 packing material and cut to a length of 5 cm.
- Pack a 75 μM ID emitter column under pressure with 2.6 μM, 100 Å, C18 packing material and cut to a length of 30 cm.
- Prepare two different LC-MS methods for the proteomics (6.4.1) and glycomics (6.4.2) workflows.
Note: Protein and glycan samples may be run on the same trap/column setup in any order.- For protein analysis, inject ~400 ng of protein onto the column in mobile phase A (MPA). Run the sample at 300 nl/min, according to Table 1, with a 1 μl pre-column equilibration (500 bar) and a 5 μl analytical column equilibration (500 bar). Ionize proteins under the MS conditions provided in Table 2.
- For glycan analysis, inject 5 μl of resuspended, P2GPN tagged NAT/SIL equimolar samples onto the column. Run the sample at 300 nl/min, according to Table 3, with a 2 μl pre-column equilibration (500 bar) and a 5 μl analytical column equilibration (500 bar). Ionize glycans under the MS conditions provided in Table 4.
| Time | %MPA | %MPB |
| 0 | 100 | 0 |
| 5 | 98 | 2 |
| 105 | 80 | 20 |
| 135 | 68 | 32 |
| 136 | 5 | 95 |
| 151 | 5 | 95 |
| 152 | 100 | 0 |
| 167 | 100 | 0 |
Table 1. LC conditions for proteomic analysis. A gradient elution with mobile phase B (MPB, 98% acetonitrile, 2% H2O, 0.1% formic acid) was performed to elute peptides for shot-gun proteomics, data-dependent-acquisition, MS experiments.
| MS1 Parameters | |
| Mass Range (Th) | 375-1500 |
| Resolution | 120,000 |
| AGC | 1 × 10⁶ |
| Max Ionization Time | 30 |
| S-Lens FR Level | 55 |
| Capillary Temp (°C) | 300 |
| Spray Voltage | 1.75 |
| MS2 Parameters | |
| Acquisition Type | Top20 |
| Resolution | 15,000 |
| AGC | 1 × 10⁵ |
| Max Ionization Time | 30 |
| Underfill Ratio | 2% |
| Isolation Window (Th) | 1.4 |
| Charge State Exclusion | +1 |
| Normalized Collision Energy | 27 |
| Exclusion Time (s) | 20 |
Table 2: MS conditions for proteomic analysis. The parameters for electrospray ionization, MS1 acquisition, and MS2 acquisition in an orbitrap instrument using higher-energy dissociation (HCD) are given.
| Time | %MPA | %MPB |
| 0 | 95 | 5 |
| 1 | 70 | 30 |
| 41 | 60 | 40 |
| 46 | 37 | 63 |
| 47 | 10 | 90 |
| 55 | 10 | 90 |
| 56 | 95 | 5 |
| 66 | 95 | 5 |
Table 3: LC conditions for glycan analysis. A gradient elution was performed to elute hydrazide tagged N-glycans for MS analysis.
| MS1 Parameters | |
| Mass Range (Th) | 600-1900 |
| Resolution | 60,000 |
| AGC | 5 × 10⁵ |
| Max Ionization Time | 64 |
| S-Lens FR Level | 65 |
| Capillary Temp (°C) | 325 |
| Spray Voltage | 1.75 |
| MS2 Parameters | |
| Acquisition Type | Top12 |
| Resolution | 15,000 |
| AGC | 5 × 10⁴ |
| Max Ionization Time | 100 |
| Underfill Ratio | 1% |
| Isolation Window (Th) | 1.4 |
| Fixed First Mass | 125 |
| Stepped Normalized Collision Energy | 10/20/30 |
| Exclusion Time (sec) | 15 |
Table 4: MS conditions for hydrazide tagged N-glycan analysis. The parameters for electrospray ionization, MS1 acquisition, and MS2 acquisition in an orbitrap instrument using higher-energy dissociation (HCD) are given.
7. Proteomics and Deamidation Analysis
- Identify proteins/peptides using standard bioinformatics search tools.
Note: The following analysis protocol was designed using the Swiss-Prot/TrEMBL databases in UniprotKB and searching via SEQUEST in the Proteome Discoverer 1.4 software, however, the protocol may be directly translated to any protein search and scoring engine using a GUI software. All commands given below may be accessed in software interfaces through drop-down menus.- Create or download an organism appropriate protein sequence database from genomic data or available proteome databases as described by Apweiler et al.25
Note: Common proteome databases include Swiss-Prot, TrEMBL, and NCBI, but may be built from in-house data as well. - Within the software, choose a database search engine and select parameters according to the quality of the data acquired and the rigorousness of the search desired, as described by Perkins et al. for MASCOT26 or Eng et al. for SEQUEST27.
- For high-mass accuracy data, set parameters for the search in the software as follows: max 2 missed cleavages, 5 ppm precursor mass tolerance, and 0.02 Da fragment mass tolerance (for optimized accurate deamidation detection22) and include the following tryptic peptide modifications: "carbamidomethyl (C)" static modification and "deamidation (N/Q)" and "oxidation (M)" dynamic modifications. If using 18O digestion labeling, include "deamidation 18O(1)" as an additional dynamic modification.
- Search, using the selected engine, the raw peptide data against the protein database (7.1.1).
Note: Mass tolerances should be appropriate for the instrument used and not arbitrarily low.
Note: The search function is completed automatically by the software using various search engine specific algorithms. The percolator algorithm (MASCOT), SEQUEST, or other combinations of algorithms are employed to identify proteins from peptides and to score the validity of the hits; more information on the tools available are covered in a review from Gonzalez-Galarza et al.28,29. Depending on the software, additional search parameters may need to be selected according to the discretion of the user.
- Export the identified peptides for manual curation and further analysis.
- Create or download an organism appropriate protein sequence database from genomic data or available proteome databases as described by Apweiler et al.25
- Manually curate a list of peptides containing an identified deamidation on the asparagine of the N-linked glycosylation motif (N-X-(S/T), where X ≠ P). Cross-validate these sites with known glycosylation motifs from the literature and create two pools of results (validated and theoretical).
- Use spectral counting30 to compare the percent occupancy of a given glycosylation site by comparing the abundance of deamidated and non-deamidated forms.
8. Glycan Relative Quantitation
Note: The following identification and quantification was completed using the XCalibur software. However, any software that analyzes raw data and automatically integrates chromatographic peaks may be substituted.
- Generate a theoretical list of glycan compositions from the biologically possible combinations of hexoses, deoxy-hexoses, hexosamines, sialic acids, and other saccharides. For this purpose, a human glycan database has been published by Walker et al.15 and may be used as-is. For theoretical databases, species-specific biological constraints must be imposed on the combinatorial space, and these rules are described by Kronewitter et al.31.
- Calculate the glycan monoisotopic masses (M) from the atomic masses for each composition for proton charge states +1-3. Modify the monoisotopic masses to include the addition of the NAT (254.14191 g/mol) or SIL (260.162042 g/mol) P2GPN tag.
- Open the "Processing Setup" program from the roadmap view in XCalibur. Set up a processing method as exactly described in the Supplemental Material from Walker et al.15 using the list generated in step 8.2 containing the theoretical monoisotopic masses for the [M+H]1+, [M+2H]2+, and [M+3H]3+ species.
Note: To confirm glycan identity beyond accurate mass, for NAT/SIL duplexed runs, check that NAT and SIL N-glycan pairs co-elute with the same retention time. Qualitatively, cross-validate identifications with the MS2 spectra, which must contain peaks belonging to the oxonium ion series32. - Export the integrated, extracted ion chromatogram (XIC) areas to Excel to obtain the SIL and NAT abundances as exactly described in the Supplemental Material from Walker et al.15
- In Excel, program the cells in a new column to calculate the correction for the molecular weight overlap by adjusting the SIL abundance according to the equation published by Walker et al.15:
 ,
,
where A is the monoisotopic peak and the theoretical isotope overlap, , may be independently calculated per composition.
 - In a second column, program the cells to normalize the NAT and SIL channels using the equation for the total normalized glycan factor (TGNF), per spectrum, as described by Walker et al.15:
 ,
,
where N is the number of N-glycans above the limit of quantification. - In a new column, program the cells to take the ratio of SIL: NAT glycans (or vice versa) to calculate the fold-change in concentration between the two samples.
Results
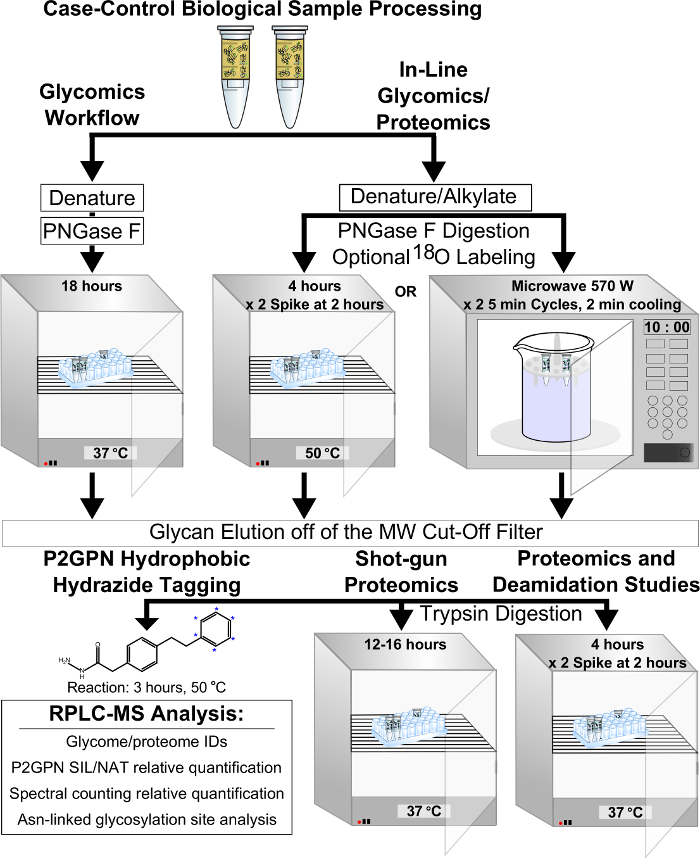
Figure 1: The scheme of the FANGS-P2GPN hydrophobic tagging coupled method (Method A) for combined proteomics and glycomics analysis is given. Steps that differ between glycomics-only processing and tandem glycomics and proteomics analysis, with glycosylation site identification, are highlighted. Please click here to view a larger version of this figure.
The in-line proteomics and glycomics, filter-based P2GPN hydrophobic tagging method (Method A) was validated for identification, quantitation, and molecular weight bias using pooled hen plasma samples (Figure 1). For solely glycomics experiments, inter-comparisons in the abundances of N-glycans extracted by Method A to carbograph SPE (gold-standard, Method B) were made (Figure 2). There were no significant differences in the abundances of glycans between the two methods. The intra-variability was also assessed by quantifying the SIL: NAT ratio of glycans extracted by the same method. The log2-distributions of both methods were Gaussian, centered on zero, and not significantly different (Figure 3A-B). The molecular weight ranges between the two protocols completely overlapped, suggesting that the filter did not discriminate N-glycans based on molecular weight range and hydrophilicity (Figure 4).
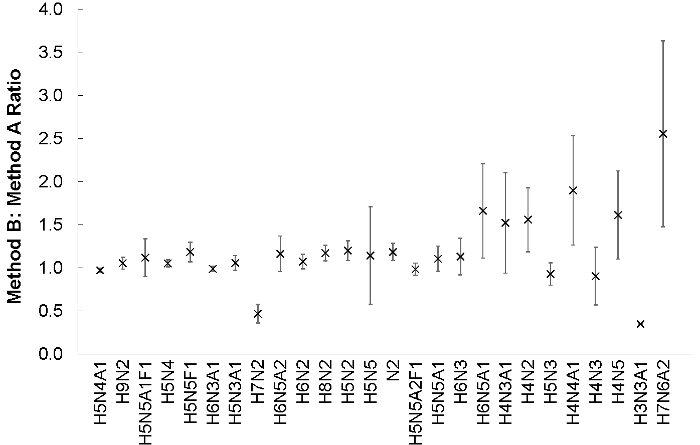
Figure 2: An equimolar mixture of NAT and SIL N-glycans extracted by Method A or Method B was prepared from 2.5 μl of hen plasma (N = 4). Samples were analyzed by UPLC-MS according to the recommended parameters suggested in section 6. The abundances for each glycan, in each NAT/SIL channel, were calculated by integrating the area under the extracted ion chromatogram (MMA = 3 ppm), correcting for the molecular weight overlap, and adjusting by the TGNF. These ratios are shown with their standard errors. The abundances of Method B: Method A N-glycans were not significantly different (p >0.05). Please click here to view a larger version of this figure.
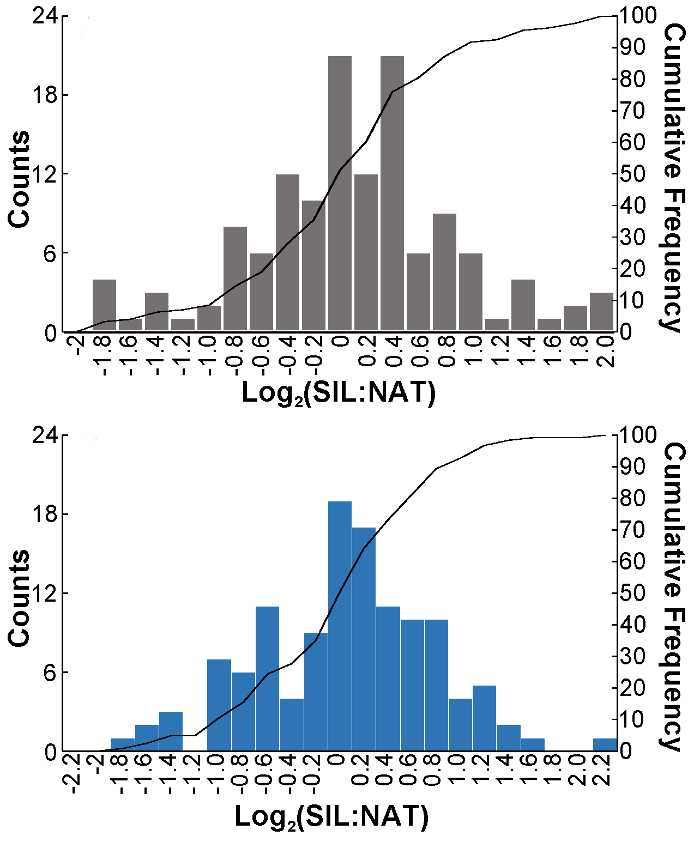
Figure 3: The intra-variability in the (A) Method A (N = 133) or (B) Method B (N = 123) strategies was compared. NAT and SIL equimolar mixtures of N-glycans, from the same extraction scheme, were analyzed over three technical replicates. The log2-distributions were centered on zero and were not significantly different between the two workflows. Please click here to view a larger version of this figure.
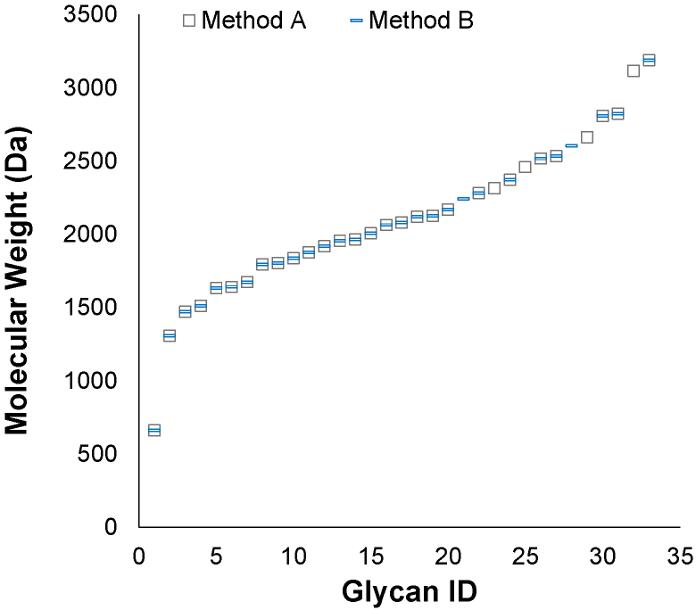
Figure 4: The molecular weight ranges of glycans from each strategy were compared. The two workflows yielded glycans spanning the same molecular weight range. N-glycans detected in one protocol versus the other fell just above the limit of detection (1 × 10⁵ abundance) and do not reflect systematic bias. Please click here to view a larger version of this figure.
Retention of the deglycosylated proteins by the molecular weight filter enabled in-line proteome wide analysis and glycosylation site identification. Multiple protocols for the combined purification of glycans and proteins were compared to a traditional FASP preparation without deglycosylation (Table 5). Our typical 18 hr filter based PNGase F digestion, followed by FASP trypsin digest (Std protocol) resulted in significant levels of non-specific deamidation, which can interfere with the identification of glycosites. Therefore, a method utilizing a shorter incubation time at elevated temperature (50 °C) and a PNGase F spike-in step (SPI protocol) was explored as an alternative, along with a microwave digestion protocol (MD protocol), to minimize non-specific deamidation. The glycans observed in the new digestion methods were not significantly different in compositions or abundances from the standard 18 hr, 37 °C filter PNGase F digest (Figure 5). Combined with a short trypsin incubation, non-specific deamidation was significantly reduced, with a false positive rate for glycosites <5% (Table 5).
| Proteins | Peptides | Deamidated Peptides | Glycosites | Glycoproteins | |||||||||||||||||||||
| + | - | + | - | + | - | + | - | + | - | ||||||||||||||||
| FASP | 249 | 3083 | 795 | 5 | 5 | ||||||||||||||||||||
| 18hr | 217 | 304 | 6013 | 5086 | 1029 | 733 | 257 | 24 | 112 | 18 | |||||||||||||||
| MD | 270 | 266 | 5190 | 5125 | 465 | 455 | 254 | 8 | 102 | 7 | |||||||||||||||
| SPI | 281 | 288 | 4729 | 4482 | 602 | 573 | 232 | 10 | 145 | 8 | |||||||||||||||
Table 5: Comparisons of proteomic data from a standard trypsin digest versus the in-line FANGS-P2GPN tagging method were made. Preparations were performed with (+) and without (-) PNGase F to determine background rates of non-specific deamidation and estimate glycosite false positive rates. Proteins were identified with 1% false discovery rate (FDR); peptides were filtered based on "high" peptide confidence in Proteome Discoverer 1.4 (q <0.01); glycosites were identified based on unique sequences containing deamidation of the conserved glycosylation motif (N-X-S/T); and glycoproteins were defined as identified proteins containing at least one identified glycosite.
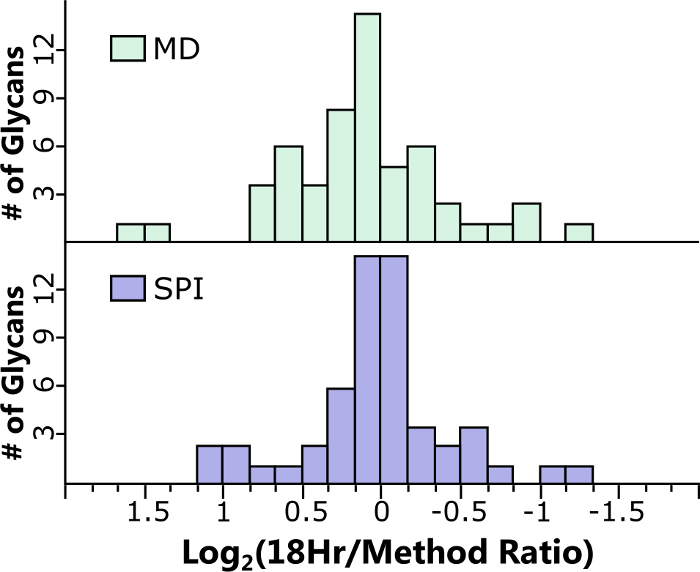
Figure 5: Shortened protocols for glycans were developed to minimize deamination in the samples and compared to the 18hr FANGS PNGase F digest. The average differences in abundances were 10% and 5% for the MD (2.2.3) and SPI (2.2.2) protocols, respectively. Of the 48 glycans identified, 90% displayed less than 1.5-fold variation. Please click here to view a larger version of this figure.
Discussion
High-throughput quantitative methods are needed to facilitate routine glycan analysis. For the last thirty years, glycomics analysis has been limited to a subset of research groups, despite its importance in disease, clinical applications, and pharmaceuticals. The FANGS-P2GPN purification and tagging method for glycomics and proteomics performs the same analysis on a single aliquot of sample, reducing the cost of supplies and the amount of material needed (particularly important in human and mouse studies). Furthermore, efforts to minimize variability in preparations are critically important, as every additional step contributes to error, potentially masking important but low-abundant changes in case-control studies. Coupling of FANGS to hydrophobic hydrazide tagging allows protein and glycan samples to be run on the same RPLC column, enhances glycan ionization, provides for relative quantification, and can be quantitatively applied to plasma.
For N-glycan analysis, it is critical to use the suggested level of PNGase F to achieve full de-glycosylation. Though glycans are solvent exposed, denaturation of proteins and excess enzyme help ensure efficient and complete cleavage. For accurate quantitation of the glycans, it is necessary to ensure that they are completely dried after derivatization to quench the reaction and prevent cross-reactions when mixing the NAT and SIL species. Finally, when extending the workflow to glycosite analysis, timing of the steps is critical to minimize non-specific deamidation. The modified protocols provided for combined glycomics and proteomics analysis work consistently when performed accordingly.
The workflow achieves accurate relative quantitation of N-glycans from plasma compared to the gold-standard, SPE method. There is no apparent bias in the types of glycans extracted in terms of molecular weight, hydrophilicity, and compositional structure. Though we have not explored the qualitative analysis of O-linked glycans, we expect that FANGS could accommodate the addition of a β-elimination step post-PNGase F digestion of N-linked glycans. However, procedures would require significant modification for reagent cleanup prior to mass spectrometry, and peptide analysis will be significantly impacted. For proteomics, the same depth of proteome coverage is achieved compared to traditional FASP methods. Importantly, methods achieve a minimal false discovery rate for N-glycan deamidation. While the method is compatible with 18O labeling of Asn during the PNGase digestion step22,23, the low glycosylation site false discovery rate suggests that it may not be necessary, further reducing costs and complexity.
The proteome is not enriched for glycoproteins in this method, which has both advantages and disadvantages. Certain low abundant glycoproteins may not be detected in the analysis. However, the occupancy of glycosylated sites per protein, can be compared between biological samples. Additionally, the error and bias introduced from lectin affinity purification or chemical enrichment is eliminated. In conclusion, coupling of FANGS to the individuality normalization when labeling with glycan hydrazide tags strategy results in a simplified, quantitative, high-throughput method for the tandem analysis of the glycome and proteome with great potential for application in clinical case-control studies.
Disclosures
We have a collaborative relationship with Cambridge Isotope Laboratories (CIL) to disseminate the P2GPN reagent and technology to the broader scientific community in the form of a product (GTK-1000). However, we do not receive any revenue based on the sale of this product.
Acknowledgements
This research was generously funded by the NIH NCI IMAT Program Grant R33 (CA147988-02), the NIH NIGMS Graduate Training in Molecular Biotechnology at NC State Grant (T32GM008776), the US Dept. of Education GAANN Fellowship Program in Molecular Biotechnology at NC State Grant (P200A140020), the W.M. Keck Foundation, and North Carolina State University. Hen plasma was obtained with the assistance of Dr. James N. Petitte and Rebecca Wysocky in the NC State University Dept. of Poultry Science.
Materials
| Name | Company | Catalog Number | Comments |
|---|---|---|---|
| Acetic Acid (50%) | Sigma Aldrich | 45754 | |
| Acetonitrile, HPLC grade | Burdick & Jackson | AH015-4 | |
| Ammonium Bicarbonate | Sigma Aldrich | A6141 | |
| Bradford Reagent | Sigma Aldrich | B6916 | Alternative: Bicinchoninic acid kit (Sigma Aldrich BCA1) |
| Calcium chloride | Sigma Aldrich | C1016 | |
| Centrifuge | Eppendorf | 5804 R | Alternate centrifuges that reach 14,000 x g are suitable |
| DL-Dithiothreitol, 1 M in solution | Sigma Aldrich | 646563 | |
| Easy-nLC 1000 | Thermo Scientific | LC120 | Alternate nano or ultra high pressure LCs will produce similar data, such as: 1. Dionex UltiMateÒ 3000 LC (Thermo Scientific); 2. Acquity UPLC (Waters). |
| Floating Tube Rack | TedPella | 20831-20 | |
| Fetuin | New England Biolabs | P6042S | |
| Fisher Scientific Isotemp Standard Lab Ovens | Fisher Scientific | 11-690-625F | Alternate incubators that reach 56 °C are suitable |
| Formic Acid | Sigma Aldrich | 56302 | |
| GE Microwave Oven | General Electric | 57B5 E82904 | Any microwave with adjustable power settings is suitable |
| INLIGHT Glycan Tagging Kit | Cambridge Isotope Laboratories | GTK-1000 | The INLIGHT kit provides NAT and SIL versions of the P2GPN reagent. |
| Iodoacetamide | Sigma Aldrich | A3221 | |
| Kinetix 2.6 mM, 100 Å, C18 bulk stationary phase | Phenomenex | Bulk Media | Alternative: Any C18 stationary phase 5 mM |
| Mascot Daemon Software and Server | Matrix Science | Alternative: Proteome Discoverer Software (Thermo Scientific) | |
| Methanol, HPLC grade | Burdick & Jackson | AH230-4 | |
| PicoFrit Self-Pack Column: 360 μm, OD 75 μm ID, 15 μm tip, non-coated, 5 per box, 50 cm | New Objective | 1 5 PF360-75-15-N-5 | |
| PNGase F (glycerol-free), 75,000 units/ml | New England BioLabs | P0705L | |
| Q Exactive HF Hybrid Quadrupole-Orbitrap Mass Spectrometer | Thermo Scientific | Alternate high mass accuracy (5 ppm) mass spectrometers will provide similar data | |
| RNase B | New England Biolabs | P7817S | |
| Trypsin from Porcine Pancreas | Sigma Aldrich | T6567-5X | |
| Urea | Sigma Aldrich | 51456 | |
| Vacuum ConcentratorSavant SPD131DDA SpeedVac Concentrator | Thermo Scientific | SPD131DDA | Alternate vacuum concentrators are suitable |
| Vivacon 500 30 kDa Filters | Sartorius Stedim Biotech | VN01H22 | Alternative: Amicon Ultra 0.5 Centrifugal Filter Units with Ultracel-10 kDa Membrane (Millipore UFC501096) |
| Water, HPLC grade | Burdick & Jackson | AH365-4 | |
| Water, 18O | Cambridge Isotope Laboratories | OLM-240-97-1 | The addition of 18O in the PNGase F digest step is optional and may not be necessary for deamidation studies completed with 95% confidence |
| Xcalibur 2.0 | Thermo Scientific | XCALIBUR20 | |
| Zwittergent Test Kit | Merck Millipore | 693030 |
References
- Wisniewski, J. R., Zougman, A., Nagaraj, N., Mann, M. Universal sample preparation method for proteome analysis. Nat. Meth. 6, 359-362 (2009).
- Preston, R. J. S., Rawley, O., Gleeson, E. M., O'Donnell, J. S. Elucidating the role of carbohydrate determinants in regulating hemostasis: insights and opportunities. Blood. 121, 3801-3810 (2013).
- Hasnain, S. Z., Gallagher, A. L., Grencis, R. K., Thornton, D. J. A new role for mucins in immunity: Insights from gastrointestinal nematode infection. Int. J. Biochem. Cell Biol. 45, 364-374 (2013).
- Roseman, S. Reflections on glycobiology. J. Biol. Chem. 276, 41527-41542 (2001).
- Laine, R. A. A calculation of all possible oligosaccharide isomers both branched and linear yields 1.05 x 10(12) structures for a reducing hexasaccharide: The isomer barrier to development of single-method saccharide sequencing or synthesis systems. Glycobiology. 4, 759-767 (1994).
- Zaia, J. Mass spectrometry and glycomics. Omics. 14, 401-418 (2010).
- Hirabayashi, J. Lectin-based structural glycomics: Glycoproteomics and glycan profiling. Glycoconjugate J. 21, 35-40 (2004).
- Nilsson, J., et al. Enrichment of glycopeptides for glycan structure and attachment site identification. Nat. Methods. 6, 809-811 (2009).
- Redmond, J. W., Packer, N. H. The use of solid-phase extraction with graphitised carbon for the fractionation and purification of sugars. Carbohyd. Res. 319, 74-79 (1999).
- Ruhaak, L. R., et al. Hydrophilic interaction chromatography-based high-throughput sample preparation method for N-glycan analysis from total human plasma glycoproteins. Anal. Chem. 80, 6119-6126 (2008).
- Kim, Y. -G., et al. Rapid and high-throughput analysis of N-glycans from ovarian cancer serum using a 96-well plate platform. Anal. Biochem. 391, 151-153 (2009).
- Zielinska, D. F., Gnad, F., Wiśniewski, J. R., Mann, M. Precision mapping of an in vivo N-glycoproteome reveals rigid topological and sequence constraints. Cell. 141, 897-907 (2010).
- Abdul Rahman, S., et al. Filter-aided N-glycan separation (FANGS): a convenient sample preparation method for mass spectrometric N-glycan profiling. J. Proteome Res. 13, 1167-1176 (2014).
- Walker, S. H., Carlisle, B. C., Muddiman, D. C. Systematic comparison of reverse phase and hydrophilic interaction liquid chromatography platforms for the analysis of N-linked glycans. Anal. Chem. 84, 8198-8206 (2012).
- Walker, S. H., Taylor, A. D., Muddiman, D. C. Individuality normalization when labeling with isotopic glycan hydrazide tags (INLIGHT): A novel glycan-relative quantification strategy. J. Am. Soc. Mass Spectr. 24, 1376-1384 (2013).
- Walker, S. H., Lilley, L. M., Enamorado, M. F., Comins, D. L., Muddiman, D. C. Hydrophobic derivatization of N-linked glycans for increased ion abundance in electrospray ionization mass spectrometry. J. Am. Soc. Mass. Spectr. 22, 1309-1317 (2011).
- Baldwin, M. A., et al. Permethylation and tandem mass spectrometry of oligosaccharides having free hexosamine: Analysis of the glycoinositol phospholipid anchor glycan from the scrapie prion protein. Anal. Biochem. 191, 174-182 (1990).
- Harvey, D. J. Derivatization of carbohydrates for analysis by chromatography; electrophoresis and mass spectrometry. J. Chromatogr. B. 879, 1196-1225 (2011).
- Bradford, M. M. A rapid and sensitive method for the quantitation of microgram quantities of protein utilizing the principle of protein-dye binding. Anal. Biochem. 72, 248-254 (1976).
- Smith, P. K., et al. Measurement of protein using bicinchoninic acid. Anal. Biochem. 150, 76-85 (1985).
- Hecht, E. S., McCord, J. P., Muddiman, D. C. Definitive screening design optimization of mass spectrometry parameters for sensitive comparison of filter and solid phase extraction purified, inlight plasma N-glycans. Anal. Chem. 87, 7305-7312 (2015).
- Nepomuceno, A. I., Gibson, R. J., Randall, S. M., Muddiman, D. C. Accurate identification of deamidated peptides in global proteomics using a quadrupole orbitrap mass spectrometer. J. Proteome Res. 13, 777-785 (2013).
- Yen, T. -Y., et al. Overcoming challenges and opening new opportunities in glycoproteomics. Biomolecules. 3, 270-286 (2013).
- Meiring, H. D., van der Heeft, E., ten Hove, G. J., de Jong, A. P. J. M. Nanoscale LC-MS(n): technical design and applications to peptide and protein. J. Sep. Sci. 25, 557-568 (2002).
- Apweiler, R., et al. UniProt: the Universal Protein knowledgebase. Nucleic Acids Res. 32, 115-119 (2004).
- Perkins, D. N., Pappin, D. J. C., Creasy, D. M., Cottrell, J. S. Probability-based protein identification by searching sequence databases using mass spectrometry data. Electrophoresis. 20, 3551-3567 (1999).
- Eng, J. K., McCormack, A. L., Yates, J. R. An approach to correlate tandem mass spectral data of peptides with amino acid sequences in a protein database. J. Am. Soc. Mass. Spectrom. 5, 976-989 (1994).
- Gonzalez-Galarza, F. F., et al. A critical appraisal of techniques, software packages, and standards for quantitative proteomic analysis. Omics. 16, 431-442 (2012).
- Spivak, M., Weston, J., Bottou, L., Käll, L., Noble, W. S. Improvements to the Percolator Algorithm for Peptide Identification from Shotgun Proteomics Data Sets. J Proteome Res. 8, 3737-3745 (2009).
- Collier, T. S., et al. Comparison of stable-isotope labeling with amino acids in cell culture and spectral counting for relative quantification of protein expression. Rapid Commun Mass Sp. 25, 2524-2532 (2011).
- Kronewitter, S. R., et al. The development of retrosynthetic glycan libraries to profile and classify the human serum N-linked glycome. Proteomics. 9, 2986-2994 (2009).
- Sheeley, D. M., Reinhold, V. N. Structural characterization of carbohydrate sequence, linkage, and branching in a quadrupole ion trap mass spectrometer: Neutral oligosaccharides and N-linked glycans. Anal. Chem. 70, 3053-3059 (1998).
Reprints and Permissions
