This protocol outlines the workflow of a CRISPR/Cas9-based gene editing system for the repair of point mutations in mammalian cells. Here, we use a combinatorial approach to gene editing with a detailed follow-on experimental strategy for measuring indel formation at the target site—in essence, analyzing onsite mutagenesis.
Method Article
A Standard Methodology to Examine On-site Mutagenicity As a Function of Point Mutation Repair Catalyzed by CRISPR/Cas9 and SsODN in Human Cells
In This Article
Summary
Abstract
Combinatorial gene editing using CRISPR/Cas9 and single-stranded oligonucleotides is an effective strategy for the correction of single-base point mutations, which often are responsible for a variety of human inherited disorders. Using a well-established cell-based model system, the point mutation of a single-copy mutant eGFP gene integrated into HCT116 cells has been repaired using this combinatorial approach. The analysis of corrected and uncorrected cells reveals both the precision of gene editing and the development of genetic lesions, when indels are created in uncorrected cells in the DNA sequence surrounding the target site. Here, the specific methodology used to analyze this combinatorial approach to the gene editing of a point mutation, coupled with a detailed experimental strategy to measuring indel formation at the target site, is outlined. This protocol outlines a foundational approach and workflow for investigations aimed at developing CRISPR/Cas9-based gene editing for human therapy. The conclusion of this work is that on-site mutagenesis takes place as a result of CRISPR/Cas9 activity during the process of point mutation repair. This work puts in place a standardized methodology to identify the degree of mutagenesis, which should be an important and critical aspect of any approach destined for clinical implementation.
Introduction
Pioneering studies by Mandecki (1986) demonstrated permanent changes in plasmid DNA using oligonucleotides transformed into bacteria1, while Walder and Walder (1986) carried out similar studies in yeast2. Shortly thereafter, Sherman and colleagues published a series of papers in which single-stranded oligonucleotides were introduced into yeast cells to make heritable changes in genes3. Building on the seminal work in microbial cells, Kmiec and colleagues began to develop unique single-agent oligonucleotides that directed single base repair in mammalian cells4. This concept was based on biochemical data that showed that molecules bearing RNA bind more tightly to the target site than those composed entirely of DNA bases. Although there were numerous reports of gene-editing success using chimeric oligonucleotides5,6,7, the editing levels remained highly variable between experiments and across different target/cell combinations.
Single-stranded donor DNA is preferred to double-stranded donor DNA because it is less likely to integrate at random sites within the genome8. However, exogenously introduced single-stranded oligonucleotides are prone to rapid degradation by cellular nucleases. Several strategies to protect the termini of oligonucleotides from degradation have been employed. An exonuclease-protected, single-stranded DNA containing the desired sequence was sufficient to obtain an editing efficiency in the 0.1-1% range6. Improved and more consistent transfection techniques, coupled with phenotypic readouts, allowed for more consistent editing by multiple research groups8,9,10,11,12,13.
Over the past 10 years, there has been a significant effort to make target cells more amenable to gene editing. One strategy employs the modulation of the cell cycle14,15,16. While editing frequencies under normal reaction conditions with single-stranded oligonucleotides (ssODNs) introduced into cultured mammalian cells hovered between 0.1% and 1%, the frequencies of gene editing increased 3- to 5-fold when the oligonucleotides were introduced into cells during their transition through the S phase. In a separate series of experiments, Brachman and Kmiec (2005) demonstrated that relatively high levels of precise gene editing (3-5%) were obtained when 2'3'dideoxycytosine (ddC) was incubated in cells for 24 h prior to the addition of the oligonucleotide17. ddC reduces the rate of DNA replication fork movement, suggesting that gene editing by ssODNs in replicating cells likely involves the incorporation of ODNs into regions of active replication11,18. Taken together, these studies led to the concept that donor DNA becomes incorporated into a growing replication fork as part of the true mechanism of action of gene editing, independent of whether a double-stranded break is present or not19. Thus, the correction of a point mutation or the replacement of a segment of DNA within the chromosome occurs via a DNA pairing and single-strand assimilation pathway.
Inducing random double-stranded DNA breaks in growing cells with small-molecule agents creates an environment in which DNA replication events are stalled as the cell attempts to repair the damage20,21. This transitory slowdown of the replication forks enables a more efficient penetration of the chromatin structure by single-stranded editing oligonucleotides, improving target accessibility15. The creation of double-stranded DNA breaks by drugs such as VP16, bleomycin, or camptothecin22,23, has been shown to stimulate gene editing levels by nearly 10-fold, up to 6-8%. However, random double-stranded DNA breaks are undesirable in a therapeutic setting.
Gene editing with programmable nucleases and oligonucleotides is also stimulated during cell division24,25. When nucleic acid-based delivery was used to carry out homology-directed repair in synchronized HCT 116 cells, Rivera-Torres and colleagues demonstrated the same increase in targeting activity when transcription activator-like effector nucleases (TALENs) were employed with single-stranded oligonucleotides, both introduced into a replicating cell population26,27 . More recently, Bialk and colleagues showed that the repair of single base mutations with single-stranded oligonucleotides and an array of clustered regularly interspaced short palindromic repeats Cas9 (CRISPR/Cas9) molecules takes place with higher efficacy when the cell population is traversing S phase28. The CRISPR molecule is comprised of RNA and functions to identify the region within the target DNA sequence that is designated for cleavage. Cas9 is a bacterial enzyme whose function is to cleave double-stranded DNA in a nucleolytic exchange reaction. Thus, CRISPR positions the complex on the genomic target, and Cas9 nuclease executes the double-stranded break. Lin et al. (2014) also demonstrated the importance of the cell cycle for achieving high frequencies of gene editing, using a modified CRISPR/Cas9 ribonulceoprotien (RNP) complex-mediated delivery system in primary neonatal fibroblasts, human embryonic stem cells, and other cell lines24. Thus, the relationship established between gene editing and cell cycle progression for single-agent gene editing is applicable to combinatorial gene editing using programmable nucleases and donor DNA templates. While the combinatorial approach to gene editing has brought together a variety of partners with the donor DNA template, most workers in the field use CRISPR/Cas9 to provide the double-stranded break function. This choice is predicated upon the ease-of-use of this particular genetic tool and the flexibility with which it can be employed to disable gene function or to introduce a foreign piece of DNA into a specific site. The generation of a knockout is technically easier compared to a gene replacement, where the incorporation of "correct" or normal copies of a gene into the disease site must be carried out with precision. A number of researchers are identifying and studying the use of specific drugs and reagents that enable the correction of mutant bases and the insertion of normal genetic sequences in the proper position at elevated frequencies29.
Recently, Rivera-Torres et al.30 used combinatorial gene editing, taking advantage of the double-stranded break activity of a specifically designed CRISPR/Cas9 system and the genetic information provided by a single-stranded oligonucleotide donor DNA template, to repair a point mutation in a single copy of the enhanced green florescent protein (eGFP) gene integrated into HCT116 cells. The authors took advantage of this well-characterized model cell line to evaluate the specificity of cleavage surrounding the target site. The data reveal that heterogeneity at the target site exists, especially in cells that do not contain a corrected point mutation. In this manuscript, we detail and focus upon the methodology used by these workers to examine on-site mutational heterogeneity created by CRISPR/Cas9 gene editing.
Protocol
The following protocol involves working with mammalian cells; familiarity with sterile technique/cell culture is expected.
1. Cell Line and Culture Conditions
- Make 500 mL of medium for the culture of HCT 116 cells: McCoy's 5A modified medium supplemented with 10% fetal bovine serum (FBS), 2 mM L-glutamine, and 1% penicillin (this is complete medium).
NOTE: Grow HCT 116-19 cells in a T-75 or T-175 flask prior to plating. When 90% confluent, each T-75 flask will yield 8.4 x 10⁶ cells, roughly five 10-cm plates, and each T-175 will yield 18.4 x 10⁶ cells, roughly fifteen 10-cm plates.
2. Harvesting Cells from the Flask
- Aspirate away the medium, wash with Dulbecco's Phosphate-Buffered Saline without calcium and magniesium (PBS) (10 mL for T-75 or 25 mL for T-175), and aspirate.
- Add trypsin dropwise to the flask using a 2-mL pipette (2 mL for T-175 or 1 mL for T-75). Place the flask in an incubator at 37 °C and 5% CO2 for 5 min to allow the cells to detach.
- Tap the flask to make sure that all cells are dislodged and then quench with complete medium by dispersing it over the entire surface of the flask (8 mL for T-175 or 4 mL T-75).
- Pipette up and down multiple times to break up cell clumps and transfer the cells to a 15-mL conical tube
- Before spinning the cells down, take 10 µL from the 15-mL conical and combine it with 10 µL of trypan blue to count the cells. Pellet the cells by spinning for 5 min at 125 x g and 16 °C.
3. Counting the Cells
- Transfer 10 µL of the cells mixed with trypan blue to the hemocytometer. Count the 4 grids around the outside (each grid contains 16 squares).
- Take the average cell count from each set of sixteen corner squares.
- Multiply by 10,000 (104).
- Multiply by the total volume of medium used to harvest the cells to correct for the dilution from the trypan blue addition.
NOTE: The equation format to calculate the volume to resuspend the cells follows:


4. Plating the Cells
- For each 10-cm plate of cells to be synchronized, add 5 mL of complete medium and 6 µM of aphidicholin (12 µL of a 2.5 mM stock in 200-proof ethanol).
- Transfer 100 µL of re-suspended cell pellet, 2.5 x 10⁶ cells, to each 10-cm plate and swirl gently to mix.
- Incubate the plates at 37 °C and 5% CO2 for 16-24 h to synchronize cells at the G1/S border.
5. Releasing the Cells from Aphidicolin Synchronization
- 4 h prior to targeting, aspirate the medium, wash with PBS, aspirate the PBS, and add 5 mL of complete medium
- Place it back in the incubator at 37 °C and 5% CO2 for 4 h
6. RNA Complexing
- Enter the mutant eGFP gene sequence into the Zhang Lab's online generator25 (http:// crispr.mit.edu/) and choose the CRISPR guide sequences that bind with close proximity to the target site. Obtain the CRISPR guide sequences from a commercial source.
- Store the CRISPR RNA (crRNA), trans-activating crRNA (tracrRNA), and Cas9 protein at 20 °C and use according to manufacturer suggestions.
- Mix the RNA in equimolar concentrations to 45 µM. Add 6.75 µL of a 200 µM stock of crRNA and 6.75 µL of a 200 µM stock of tracrRNA to a 1.5-mL centrifuge tube. Add 16.50 µL of TE Buffer to make a final volume of 30 µL.
- Heat at 95 °C for 5 min in a heat block or PCR machine.
Caution: Hot! - Allow to cool to room temperature.
NOTE: If using a PCR machine, set the cooling to 0.2 °C/s. - Perform the following steps for each sample.
- Dilute 2.22 µL of crRNA:tracrRNA complex in 2.78 µL of TE Buffer (10 mM Tris, pH 8.0 and 0.1 mM EDTA; pH 8.0) to a final volume of 5 µL.
- Dilute 1.67 µL of Cas9 Protein from a 60 µM stock in 3.33 µL of low-serum medium to final volume of 5 µL.
- Mix 5 µL of Cas9 protein with 5 µL of complexed RNA
7. Harvesting the Cells for Targeting
- Aspirate the medium, wash with 5 mL of PBS, aspirate the PBS, and add 1 mL of pre-warmed trypsin to each 10-cm plate. Put the plates in the incubator at 37 °C and 5% CO2 for 5 min.
- Tap on the 10-cm plate to make sure all cells are dislodged and then quench with 4 mL of complete medium by dispersing it over the entire surface of the plate.
- Pipette up and down multiple times to break up cell clumps and transfer the cells to a 15-mL conical tube.
- Before spinning the cells down, take 10 µL from the 15-mL conical tube and combine it with 10 µL of trypan blue to count the cells. Pellet the cells by spinning for 5 min at 125 x g and room temperature.
- Aspirate the medium and wash with 5 mL of PBS. Pellet the cells by spinning at 125 x g for 5 min at room temperature.
8. Counting the Cells
- Transfer 10 µL of the cells mixed with trypan blue to the hemocytometer. Count the 4 grids around the outside (each grid contains sixteen squares).
- Take the average cell count from each set of sixteen corner squares.
- Multiply by 10,000 (104).
- Multiply by the total volume of medium used to harvest the cells to correct for the dilution from the trypan blue addition.
NOTE: Following is the equation format to calculate the volume to resuspend the cells. Re-suspend the required number of cells in serum-free McCoy's 5A modified medium.


9. Targeting Samples
- Transfer 100 µL of cell suspension (5 x 10⁵ cells) from step 8.1 to each electroporation 4-mm gap cuvette. Add 10 µL of RNP complex from step 6.7 to 100 µL of cells at a 5 x 10⁵ cell density. Add ODN (2 µM) to each sample.
NOTE: For a positive control, add 1 µL of eGFP at 1 µg/µL expressing plasmid- Take the rack to an electroporation machine, lightly flick each sample, and place them in the chamber. Electroporate at 250 V, LV; 2 pulses, 1 s; 13 ms; unipolar pulse.
- Transfer the rack back to the hood. Transfer each sample to a well containing 2 mL of complete medium in a 6-well plate. Incubate at 37 °C and 5% CO2 for 72 h before checking for correction levels.
10. Analysis of Gene Edited Cells and Transfection Efficiency
- Aspirate the medium and wash the cells with 2 mL of PBS. Aspirate the PBS and add 500 µL of pre-warmed trypsin to each well of the 6-well plate. Put the plates in the incubator at 37 °C and 5% CO2 for 5 min.
- Tap the plate to make sure all cells are dislodged and then quench with 1 mL of complete medium by dispersing it over the entire surface of the well.
- Pass the cells into a 1.5-mL centrifuge tube and pellet at 5,000 x g for 5 min at room temperature.
- Aspirate the medium. Re-suspend the cell pellet in 500 µL of FACS buffer (0.5% BSA, 2 mM EDTA, and 2 µg/mL propidium iodide in PBS).
- Measure the cell fluorescence (eGFP+) by flow cytometry.
- Calculate the correction efficiency as the percentage of the total live eGFP-positive cells over the total number of live cells in each sample, as described in Rivera Torres et al30.
11. DNA Sequence Analysis
- Electroporate the synchronized and released HCT 116-19 cells at a concentration of 5 x 10⁵ cells/100 µL, with RNP complex at 100 pmols and 72NT ODN at 2.0 µM.
- Transfer the cells to 6-well plates and allow them to recover for 72 h.
- Sort the cells individually into 96-well plates using a FACS sorter with a 488-nm (100 mw) laser for eGFP+/-, as described in Rivera-Torres et al30.
NOTE: Not all wells will successfully grow. - Expand the cells over 6 weeks and harvest as described in step 7.
- From the wells that have growth, isolate cellular gDNA using a commercially available DNA isolation kit (see the Table of Materials) and amplify the region surrounding the target base via PCR (718 bp; forward primer 5'-ATGGTGAGCAAGGGCGAGGA-3' and reverse primer 5'-ACTTGTACAGCTCGTCCATGC-3').
- Perform DNA sequencing analysis on the samples.
Results
We used a model system to study gene editing in mammalian cells, which relies upon the correction of a point mutation embedded within the eGFP gene integrated as a single copy in HCT116 cells. It is important to note that this is a single-copy gene; thus, a less complicated view of DNA alterations or mutagenesis can be made. Figure 1A displays the mutant eGFP gene sequence with the targeted base, the third base of the stop codon TAG, highlighted in red. The 72-base oligonucleotide, which is partially complementary to the non-transcribed strand of the eGFP gene (72NT) and is designed to induce the base exchange from a G to a C, is also illustrated. In addition, a CRISPR, designated as 2C, with the indicated protospacer sequence in a 5' to 3' orientation, is also depicted in Figure 1A. To carry out this gene-editing reaction, we used a ribonucleoprotein (RNP) consisting of the CRISPR (cr) RNA and the tracr (tr) RNA coupled to purified Cas9 protein (Figure 1B), instead of using a mammalian expression vector consisting of the Cas9 gene and the appropriate specific guide RNA sequence.
When the specifically designed RNP particle is delivered with the single-stranded oligonucleotide into HCT116 cells by electroporation, gene editing, evidenced by the repair of the single base mutation in eGFP, is observed after 72 h of incubation using a flow cytometer. Functional repair is observable by the emergence of green fluorescence in targeted cells, cells that can also be separated from the entire population by sorting because of this fluorescence. As shown in Figure 2, a gradual dose response can be seen as the coordinated levels of RNP and 72NT increase. The molecular ratio, picomoles of RNP, and micromolar concentration of the 72NT as displayed in the figure, are based on optimal dosages used in gene-editing reactions that are dependent on the introduction of Cas9 and specific guide RNA from transfected expression vectors. The inset in Figure 2 displays a gene-editing reaction carried out in the absence of the RNP particle. Here, approximately 1% of the targeted cells are corrected when a 10-fold higher concentration of the 72NT oligonucleotide is used in the single-agent gene-editing reaction.
In order to determine if genetic heterogeneity exists at the target site-the so-called on-site mutagenesis effect-we decided to examine the outcome of gene editing activity in individual cells. While much more laborious than examining the overall population, a true measure of genetic footprints or lesions can be ascertained when the genome of clonally expanded cells is examined. We repeated the experiment described in Figure 2, this time only using 100 pmol of RNP complex and 2.0 µmol of the 72NT oligonucleotide. As above, HCT 116 cells were synchronized for 24 h with aphidicholine and arrested at the G1/S border. 4 h afterwards, the cells were released and the gene-editing tools were introduced by electroporation. 72 h later, the cells were analyzed using FACS and sorted individually into 96-well plates (the experimental process is illustrated in Figure 3). Cells displaying green fluorescence were sorted by flow cytometry into individual wells of a 96-well plate for clonal expansion. Importantly, cells lacking eGFP expression were also isolated and sorted in a similar fashion for expansion under the same conditions.
After 14 days of growth, most of the individual clones had expanded sufficiently to enable DNA isolation. As such, 16 clones of the eGFP-positive samples were selected, and the genetic integrity surrounding the target site was analyzed by DNA sequencing. Information surrounding the DNA sequence of alleles within the population was generated using Sanger sequencing, assembled using sequence visualization software to compare the sequence of a wildtype allele (Figure 4A). The cut site of the RNP complex is indicated by a black arrow, located on the green bar (2C crRNA). As also shown in Figure 4A, all 16 eGFP-positive cells contain the predicted nucleotide exchange at the target site. The converted C residue is highlighted in red, and the peak profile reflecting that precise change is provided underneath the eGFP-positive sequence. In a similar fashion, 15 non-green clonal isolates, sufficiently expanded to enable DNA extraction and sequencing, were analyzed for heterogeneity at the target site. As predicted, in approximately half the samples, no DNA base exchange was observed. This is reflected in the maintenance of the G residue at the target site, as shown in Figure 4B. The remainder of the clonal expansions examined in these experiments displayed a heterogeneous population of deletion mutations, therefore accounting for the lack of green fluorescence. The deletion size ranged from one base to 19 bases. It is important to note that we have only examined 15 samples of the eGFP-positive cells, and while we believe that this is quite representative of the type of genetic lesions left behind by CRISPR/Cas9 activity, there is a possibility that other types or forms of indels could be present in the targeted population.
Taken together, the results displayed in Figure 4 confirm the phenotypic readout in the eGFP targeting system. Conversion of the G to C nucleotide enables the emergence of green fluorescence in corrected HCT116 cells. No base substitution surrounding the target site has been observed in the clones isolated for this experiment or in previous experiments27,28. The data also demonstrate that cells failing to undergo gene editing via point-mutation repair remain uncorrected but, in some cases, not unaltered, with a range of genetic heterogeneity surrounding the target site.
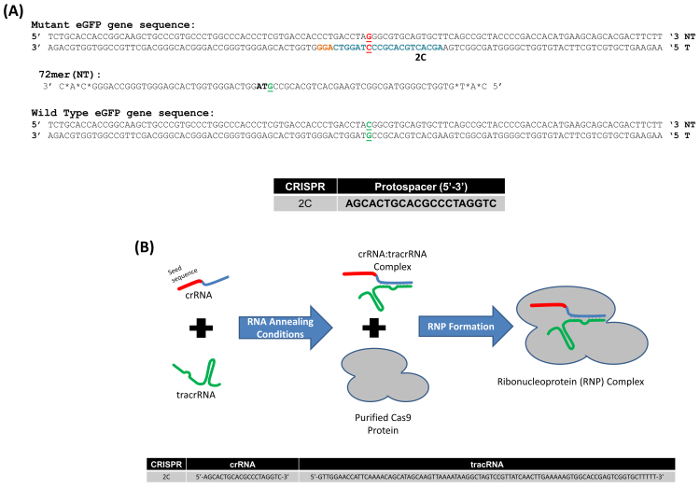
Figure 1. (A) Model system for the gene editing of the mutant eGFP gene. The appropriate segments of the wildtype and mutated eGFP gene with the targeted codon, located in the center of the sequence, are displayed in green and red, respectively. The nucleotide targeted for exchange is bolded and underlined. The highlighted bases in blue represent the 2C CRISPR protospacer sequence, and the orange bases highlight the PAM site. The oligonucleotide used in these experiments is 72 bases in length, bearing phosphorothioate modified linkages at the three terminal bases; the 72-mer targets the non-transcribed (NT) strand (72NT). (B) CRISPR/Cas9 ribonucleoprotein assembly reaction. crRNA provides target specificity (20 bases, red section) corresponding to the 2C protospacer sequence and an interaction domain (blue) with the tracrRNA (green). crRNA and tracrRNA are annealed in equimolar concentrations. Cas9 protein (gray) is added to complete the RNP assembly. Guide RNAs (gRNAs) direct and activate the Cas9 endonuclease, which then cleave the target DNA. The lower section of the figure shows the 2C seed sequence and the tracrRNA sequence. This figure was modified from Rivera-Torres, N. et al. (2017). Please click here to view a larger version of this figure.
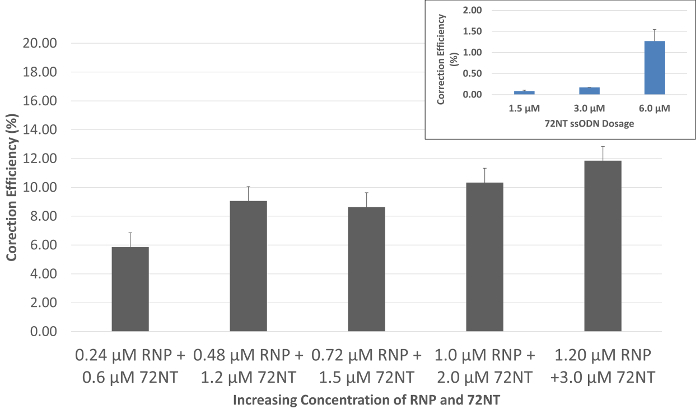
Figure 2. Gene editing is dose-dependent when directed by the RNP and the ssODN. Synchronized and released HCT 116-19 cells were electroporated with 24-120 pmol of CRISPR/Cas9 RNP and 0.6-3.0 µM of 72mer. After a 72-h recovery period, gene-editing activity was measured using a flow cytometer. Gene editing is displayed as the correction efficiency (%), determined by the number of viable eGFP-positive cells divided by the total number of viable cells in the population. Error bars are produced from three sets of data points generated over three separate experiments using basic calculations of standard error. Inset: Single-agent gene editing. Gene-editing activity directed by the single-stranded oligonucleotide (72NT) in the absence of the RNP complex under identical conditions is presented as a function of increasing concentration. This figure was modified from Rivera-Torres, N. et al. (2017). Please click here to view a larger version of this figure.

Figure 3. Experimental strategy for the isolation of single-cell clones. Cells exhibiting eGFP expression were scored as positive and sorted using a flow cytometer as single cells into individual wells for clonal expansion. Cells lacking eGFP expression were isolated and sorted in a similar fashion and expanded under the same conditions. The DNA was then isolated and the eGFP gene was amplified and subjected to Sanger sequencing to analyze the gene-editing activity surrounding the target site. This figure was modified from Rivera-Torres, N. et al. (2017). Please click here to view a larger version of this figure.
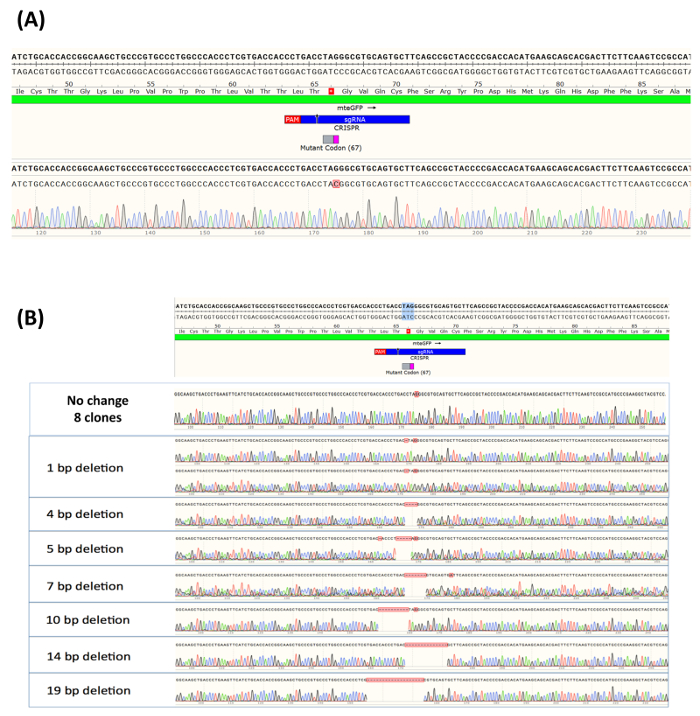
Figure 4. (A) Allelic analysis of eGFP-positive cells expanded as a clonal population. Clonally isolated and expanded eGFP-positive samples (sixteen clones) were analyzed at the site surrounding the targeted base and DNA from each, harvested, purified, amplified, and sequenced. Allelic analysis was carried out using Sanger sequencing, assembled using sequence visualization software and compared to the sequence of a wildtype allele, which is illustrated at the top of the figure. The cut site of the RNP complex is indicated as a small black arrow located on the green bar (2C crRNA). (B) Allelic analysis of eGFP-negative cells expanded as a clonal population. Fifteen individual samples, expanded from clones originating from the uncorrected population, were randomly selected and analyzed for indel formation at the site surrounding the target nucleotide. As above, allelic analysis was carried out using Sanger sequencing and assembled using a sequence visualization software. Once again, the sequence of a wildtype allele at the top of the figure, along with the cut site of the RNP, are presented. This figure was modified from Rivera-Torres, N. et al. (2017). Please click here to view a larger version of this figure.
Discussion
Gene editing has emerged as a mainstream scientific discipline primarily because of the emergence of the CRISPR/Cas9 system. This remarkable pathway, which facilitates adoptive immunity in bacterial cells, has been repurposed as a molecular tool to enable genomic alteration in human chromosomes. The natural function of CRISPR/Cas9 is to disable viral DNA by introducing double-stranded DNA breaks leading to fragmentation30,31. This activity results in the destruction of invading exogenous DNA and leads to prokaryotic immunity that suppresses subsequent infection by the same viral particle. Amazingly, this system exhibits pneumonic behavior, in that it can reactivate specific CRISPR gRNA created by previous infection events.
The efficiency and accuracy of gene disruption catalyzed by CRISPR/Cas9 has been used in numerous eukaryotic genetic systems where the objective was to disable a functioning gene32,33. When reduced to its basal level, the process consists of two fundamental steps. The first is a double-stranded break, while the second relies on the inherent process of non-homologous end joining (NHEJ) to complete the knockout. In most cases, the double-stranded break results in the creation of blunt-ended, disengaged chromosomal segments, and enzymes involved in NHEJ react to the chromosomal break and act to conjoin the broken ends. This process can sometimes involve the loss of individual nucleotides at the severed site. The loss of even a few bases can cause a frameshift, and functional expression ceases. The use of CRISPR/Cas9 to create genetic knockout by engaging the natural process of NHEJ has revolutionized eukaryotic genetics; the loss of DNA at the target site is both predictable and expected.
In contrast to gene knockout, a number of researchers have been engaged in attempting to redirect and repurpose CRISPR/Cas9 activity toward the process of homology-directed repair. The aim of the studies is gene correction. In this strategy, CRISPR/Cas9 is combined with a donor DNA template that provides the genetic information to repair an inborn error or to insert mutations into healthy genes. Early reports highlighting the remarkable capacity of CRISPR/Cas9 to catalyze homology-directed repair indicated (directly or indirectly) that the process occurred in a highly precise fashion24,34. Our laboratory has been studying homology-directed repair or gene correction using single-stranded oligonucleotides in an attempt to define the mechanism and regulatory circuitry surrounding it15,17,18,23. We have focused primarily on the gene editing single point mutations, since this is the most basic genetic mutation known to be responsible for many inherited disorders. Our fundamental knowledge of gene editing led us to question the precision of CRISPR/Cas9 activity in these reactions, since the CRISPR/Cas9 function in gene knockout results in the formation of indels. We used a well-defined model system, rather than a non-selectable yet clinically relevant gene, to study on-site mutagenesis in a decidedly reductionist fashion. By using a simple target gene, upon which gene correction can be measured at both the genotypic and phenotypic levels, we reasoned that heterogeneity occurring at the target site could be identified in a reliable and robust fashion.
Our data confirm that the well-established gene editing system, consisting of a mutant eGFP gene integrated into HCT116 cells, can provide foundational information with regard to the generation of genetic lesions and the process of on-site mutagenesis. CRISPR/Cas9 and single-stranded oligonucleotide donor DNA molecules working in tandem can lead to the precise repair of the point mutation in the eGFP gene. We propose a new model for the repair of point mutations, a molecular pathway in which the donor DNA acts as a replication template for the repair of the mutant base, a process we have termed ExACT30. The targeted population, not exhibiting the corrected phenotype, displays a variety of cells containing heterogeneous and widely ranging DNA indels surrounding the target site. In approximately half the clones isolated from the uncorrected population, deletion mutagenesis was observed at the target site. Since no previous report has indicated that single-stranded oligonucleotides acting as single-agent gene-editing tools can induce indels at the target site, we conclude that CRISPR/Cas9 activity is responsible for these mutations.
In this manuscript, we provide a detailed methodology so that genetic heterogeneity at the target site can be measured in a reliable and robust fashion. While an enormous amount of attention has been paid to the analysis and mapping of off-site mutagenesis, it is likely that a heterogeneous mutation created at the target site will have a greater effect on the success or failure of gene editing in the clinical arena. Additional technologies or modified Cas9 proteins may be required to improve the precision of the homology-directed repair of inborn errors in mammalian cells35. Some of these technologies include the use of auxiliary oligonucleotides to act as a bridge, holding the chromosomal ends together and avoiding the destructive action of NHEJ. Defining the degree of heterogeneity at the target site as a result of gene-editing activity is and must be an important part of any protocol designed for therapeutic intervention.
Disclosures
The authors having nothing to disclose.
Acknowledgements
The authors have no acknowledgments.
Materials
| Name | Company | Catalog Number | Comments |
|---|---|---|---|
| McCoy’s 5A Modified medium | ATCC | 30-2007 | |
| Fetal Bovine Serum (FBS) | ATCC | 30-2020 | |
| L-glutamine | ATCC | 30-2214 | |
| Penicillin-Streptomycin Solution | ATCC | 30-2300 | |
| Dulbecco's Phosphate Buffered Saline | ATCC | 30-2200 | No Calcium or magnesium |
| Trypsin EDTA Solution | ATCC | 30-2101 | |
| Aphidicolin 1mg | Thermo Fisher | AC611970010 | |
| Alt-R CRISPR crRNA, 10 nmol | IDT | No catalog number since its made to your specific gene target. | |
| CRISPR-Cas9 tracrRNA, 20 nmol | IDT | 1072533 | |
| S.p. Cas9 Nuclease 3NLS, 500 µg | IDT | 1074182 | |
| IDTE Buffer | IDT | 11-01-03-01 | |
| Zeus Electroporation Cuvettes 0.4 Cm | VWR | 10497-474 | |
| Gene Pulser Xcell Electroporation Systems | BioRad | 1652660 | |
| Bovine serum albumin lyophilized powder, crystallized, ≥98.0% (GE) | Sigma | 05470-1G | |
| EDTA (0.5 M), pH 8.0 | ThermoFisher Scientific | AM9260G | |
| Propidium Iodide - 1.0 mg/mL Solution in Water | ThermoFisher Scientific | P3566 | |
| DNeasy Blood & Tissue Kit (250) | Qiagen | 69581 | |
| 6-well Standard Line Multiwell Cell Culture Plates | VWR | 10062-892 | |
| Petri Dishes | Fisher | 12-565-90 | |
| Conical Tubes (15 mL) (racked) | Thermo Fisher | AM12500 | |
| Trypan Blue Solution, 0.4% | Thermo Fisher | 15250061 | |
| Reduced Serum Medium | Thermo Fisher | 31985062 |
References
- Mandecki, W. Oligonucleotide-directed double-strand break repair in plasmids of Escherichia coli: a method for site-specific mutagenesis. Proc Natl Acad Sci. 83 (19), 7177-7181 (1986).
- Walder, R. Y., Walder, J. A. Oligodeoxynucleotide-directed mutagenesis using the yeast transformation system. Gene. 42 (2), 133-139 (1986).
- Moerschell, R. P., Tsunasawa, S., Sherman, F. Transformation of yeast with synthetic oligonucleotides. Proc Natl Acad Sci. 85 (2), 524-528 (1988).
- Yoon, K., Cole-Strauss, A., Kmiec, E. B. Targeted gene correction of episomal DNA in mammalian cells mediated by a chimeric RNADNA oligonucleotide. Genetics. 93, 2071-2076 (1996).
- Beetham, P. R., Kipp, P. B., Sawycky, X. L., Arntzen, C. J., May, G. D. A tool for functional plant genomics: chimeric RNA/DNA oligonucleotides cause in vivo gene-specific mutations. Proc Natl Acad Sci U S A. 96 (15), 8774-8778 (1999).
- Bertoni, C., Morris, G. E., Rando, T. A. Strand bias in oligonucleotide-mediated dystrophin gene editing. Hum Mol Gen. 14 (2), 221-233 (2004).
- Alexeev, V., Yoon, K. Stable and inheritable changes in genotype and phenotype of albino melanocytes induced by an RNA-DNA oligonucleotide. Nat Biotechnol. 16 (13), 1343-1346 (1998).
- Zorin, B., Hegemann, P., Sizova, I. Nuclear-gene targeting by using single-stranded DNA avoids illegitimate DNA integration in Chlamydomonas reinhardtii. Eukaryot Cell. 4 (7), 1264-1272 (2005).
- Brachman, E. E., Kmiec, E. B. DNA replication and transcription direct a DNA strand bias in the process of targeted gene repair in mammalian cells. J Cell Sci. 117 (Pt 17), 3867-3874 (2004).
- Pierce, E. A., et al. Oligonucleotide-directed single-base DNA alterations in mouse embryonic stem cells. Gene Ther. 10 (1), 24-33 (2003).
- Radecke, S., Radecke, F., Peter, I., Schwarz, K. Physical incorporation of a single-stranded oligodeoxynucleotide during targeted repair of a human chromosomal locus. J Gene Med. 8 (2), 217-228 (2006).
- Bertoni, C., Rustagi, A., Rando, T. A. Enhanced gene repair mediated by methyl-CpG-modified single-stranded oligonucleotides. Nucleic Acids Res. 37 (22), 7468-7482 (2009).
- Andrieu-Soler, C., et al. Stable transmission of targeted gene modification using single-stranded oligonucleotides with flanking LNAs. Nucleic Acids Res. 33 (12), 3733-3742 (2005).
- Olsen, P. A., Randol, M., Krauss, S. Implications of cell cycle progression on functional sequence correction by short single-stranded DNA oligonucleotides. Gene Ther. 12 (6), 546-551 (2005).
- Engstrom, J. U., Kmiec, E. B. DNA replication, cell cycle progression and the targeted gene repair reaction. Cell Cycle. 7 (10), 1402-1414 (2008).
- Aarts, M., te Riele, H. Parameters of oligonucleotide-mediated gene modification in mouse ES cells. J Cell Mol Med. 14 (6b), 1657-1667 (2010).
- Brachman, E. E., Kmiec, E. B. Gene repair in mammalian cells is stimulated by the elongation of S phase and transient stalling of replication forks. DNA Repair. 4 (4), 445-457 (2005).
- Engstrom, J. U., Suzuki, T., Kmiec, E. B. Regulation of targeted gene repair by intrinsic cellular processes. BioEssays. 31 (2), 159-168 (2009).
- Parekh-Olmedo, H., Ferrara, L., Brachman, E., Kmiec, E. B. Gene therapy progress and prospects: targeted gene repair. Gene Ther. 12 (8), 639-646 (2005).
- Olsen, P. A., Randol, M., Luna, L., Brown, T., Krauss, S. Genomic sequence correction by single-stranded DNA oligonucleotides: role of DNA synthesis and chemical modifications of the oligonucleotide ends. J Gene Med. 7 (12), 1534-1544 (2005).
- Wang, Z., Zhou, Z. -J., Liu, D. -P., Huang, J. -D. Double-stranded break can be repaired by single-stranded oligonucleotides via the ATM/ATR pathway in mammalian cells. Oligonucleotides. 18 (1), 21-32 (2008).
- Ferrara, L., Kmiec, E. B. Camptothecin enhances the frequency of oligonucleotide-directed gene repair in mammalian cells by inducing DNA damage and activating homologous recombination. Nucleic Acids Res. 32 (17), 5239-5248 (2004).
- Ferrara, L., Parekh-Olmedo, H., Kmiec, E. B. Enhanced oligonucleotide-directed gene targeting in mammalian cells following treatment with DNA damaging agents. Exp Cell Res. 300 (1), 170-179 (2004).
- Lin, S., Staahl, B., Alla, R. K., Doudna, J. A. Enhanced homology-directed human genome engineering by controlled timing of CRISPR/Cas9 delivery. eLife. 3, 04766(2014).
- Hsu, P. D., et al. DNA targeting specificity of RNA-guided Cas9 nucleases. Nature Biotechnol. 31 (9), 827-832 (2013).
- Rivera-Torres, N., et al. The position of DNA cleavage by TALENs and cell synchronization influences the frequency of gene editing directed by single-stranded oligonucleotides. PLoS One. 9 (5), (2014).
- Strouse, B., Bialk, P., Niamat, R. a, Rivera-Torres, N., Kmiec, E. B. Combinatorial gene editing in mammalian cells using ssODNs and TALENs. Sci Rep. 4 (ii), 3791(2014).
- Bialk, P., Rivera-Torres, N., Strouse, B., Kmiec, E. B. Regulation of Gene Editing Activity Directed by Single-Stranded Oligonucleotides and CRISPR/Cas9 Systems. PloS One. 10 (6), e0129308(2015).
- Yu, C., et al. Small Molecules Enhance CRISPR Genome Editing in Pluripotent Stem Cells. Cell Stem Cell. 16 (2), 142-147 (2015).
- Rivera-Torres, N., Banas, K., Bialk, P., Bloh, K. M., Kmiec, E. B. Insertional Mutagenesis by CRISPR/Cas9 Ribonucleoprotein Gene Editing in Cells Targeted for Point Mutation Repair Directed by Short Single-Stranded DNA Oligonucleotides. PLoS One. 12 (1), e0169350(2017).
- Mali, P., et al. CAS9 transcriptional activators for target specificity screening and paired nickases for cooperative genome engineering. Nat Biotechnol. 31 (9), 833-838 (2013).
- Cong, L., et al. Multiplex genome engineering using CRISPR/Cas systems. Science. 339 (6121), 819-823 (2013).
- Ran, F. A., et al. In vivo genome editing using Staphylococcus aureus Cas9. Nature. 520 (7546), 186-191 (2015).
- Richardson, C. D., Ray, G. J., DeWitt, M. A., Curie, G. L., Corn, J. E. Enhancing homology-directed genome editing by catalytically active and inactive CRISPR-Cas9 using asymmetric donor DNA. Nature Biotechnol. 34 (3), 339-344 (2016).
- Slaymaker, I. M., Gao, L., Zetsche, B., Scott, D. A., Yan, W. X., Zhang, F. Rationally engineered Cas9 nucleases with improved specificity. Science. 351 (6268), 84-88 (2016).
Reprints and Permissions
