

Summary
To test the effect of a chemokine on macrophage recruitment in vivo, the whole mount in situ hybridization was used to detect the ectopic expression of the chemokine, and immunostaining was used to label macrophages. Live imaging was used for real-time observation of macrophage migration.
Abstract
Zebrafish are widely used in basic and biomedical research. Many zebrafish transgenic lines are currently available to label various types of cells. Owing to the transparent embryonic body of zebrafish, it is convenient for us to study the effect of one chemokine on the behavior of a certain type of cells in vivo. Here we provided a workflow to investigate the function of a chemokine on macrophage migration in vivo. We constructed a tissue-specific overexpression plasmid to overexpress IL-34 and injected the plasmid into one-cell stage transgenic fish embryos whose macrophages were specifically labeled by a fluorescent protein. We then used whole mount fluorescent in situ hybridization and immunostaining to detect the pattern of the chemokine expression and the number or location of macrophages. The injected WT embryos were raised to generate a stable transgenic line. Finally, we used confocal live imaging to directly observe macrophage behavior in the stable transgenic fish to study the function of IL-34 on macrophages in vivo.
Introduction
Zebrafish is a small tropical hard-bones freshwater fish originated in India. Regarding the gene conservation, zebrafish have a similarity of 87% to the human1. It can provide us insights on related subjects of human by studying the gene regulation, protein function and cell behavior such as migration, proliferation et.al in zebrafish. Zebrafish embryo can be used to observe the development of early embryos at different stages after inhibiting pigment. Meanwhile, it takes only three months for zebrafish to develop into sexual maturity, then the zebrafish can produce hundreds of eggs every 4 days. Mini-size, simple breeding, strong reproductive capacity, these advantages make zebrafish culture very space-saving, conducive to large-scale culture. The traditional mammalian model mouse has a higher maintenance costs than zebrafish, therefore limiting the scale of mouse raising. In the aspect of early embryo development, mouse embryo is difficult to observe in live condition due to the characteristics of mouse embryo development in the mother womb. On the contrary, zebrafish embryos develop externally and are transparent, therefore they are easy to observe under a microscope. Furthermore, zebrafish is very easy to construct a variety of transgenic lines for related gene function research. Currently, various zebrafish transgenic lines are available to label different types of cells. It is very convenient now to construct transgenic lines to overexpress chemokines in specific locations and study the chemokines function on cell behavior in zebrafish.
Here, we provided a workflow to use zebrafish transgenic line to investigate the function of IL-34 on macrophage behavior in vivo2,3,4,5,6,7. Firstly, we constructed a liver-specific overexpression plasmid of the gene il34 and injected the plasmid into one-cell stage Tg (mpeg1: GFP) fish embryos which specifically labeled the macrophages by fluorescent protein GFP. Then, we used whole mount fluorescent in situ hybridization and immunostaining to detect the pattern of the il34 expression and the number or location of macrophages. The injected WT embryos were raised to generate a stable transgenic line. In these steps, we established and validated the cytokine-producing line and visually assessed the effects that can be seen on macrophage distribution. Finally, to investigate macrophage behavior in response to the cytokine, we used confocal live imaging to directly observe the macrophage migration to confirm the function of il34 on the macrophage migration in vivo.
Subscription Required. Please recommend JoVE to your librarian.
Protocol
NOTE: All the samples were treated by phenylthiourea(PTU) egg water to inhibit pigment.
1. Generation of Tg (fabp10a:il34) Transgenic Constructs and Fish Injection
- Clone the 2.8 kb fabp10a promoter8 and the IL-34 coding regions (ENSDART00000126460.3) of zebrafish into the pTol2 vector to generate the fabp10a-il34 construct. Inject the constructs into one-cell stage Tg (mpeg1: GFP) and WT fish embryos together with the transposase mRNA. Raise the fabp10a-il34 injected WT embryos to adult9 and identify the transgenic founder by in situ hybridization.
NOTE: The injection of the Tol2 construct directly into another transgenic could be problematic if the other transgenic line is made with the same transposon system. A general practice would be to make an independent transgenic line and subsequently cross the new line with another reporter line. This ensures that there will be no effects of the new transgenesis on a previously inserted transgene.
2. Fluorescent Whole Mount In Situ Hybridization (WISH) Combine with Immunostaining
- Sample fixation
- Collect embryos of transient injection or stable IL-34 transgenic line which crossed with Tg (mpeg1: GFP) at desired stages.
NOTE: For this case, the embryos were collected at 4 d post fertilization (dpf). (If needed) remove the chorion by syringe. - Fix the embryos with 4% paraformaldehyde (PFA) overnight at 4 °C or 2 h at room temperature (RT) (about 25 °C).
- Wash the embryos with phosphate buffered saline plus Tween 20 (PBST) 3x 5 min.
- Dehydrate the embryos separately with 50% methanol in PBST (50% Methanol/PBST) and 100% methanol, 1x 5 min each. Then, change to fresh 100% methanol and store at -20 °C (at least 2 h).
NOTE: The protocol can be paused here.
- Collect embryos of transient injection or stable IL-34 transgenic line which crossed with Tg (mpeg1: GFP) at desired stages.
- Probe hybridization (Day I)
- Rehydrate the embryos in the previous steps with 50% methanol in PBST (50% Methanol/PBST), then wash with PBST 3x 5 min.
- Digest the embryos with proteinase K in PBST at RT (final concentration: 10 µg/mL; 1:2000 in PBST).
NOTE: Digestion time depends on the embryos stage: Less than 36 h post fertilization (hpf), no need; 36 hpf-2 dpf embryo, 3-5 min; 2-3 dpf embryo, 10 min; 3-4 dpf embryo, 15 min; 4-5 dpf embryo, 15-20 min; 5-6 dpf embryo, 20-27 min; >6 dpf embryo, 25-30 min at RT (about 25 °C). - Discard the digestion solution and perform fixation again with 4% PFA, for 20 min at RT.
- Wash the embryos with PBST 2x 10 min.
- Discard the PBST, perform pre-hybridization with heated hybridization buffer (HB buffer) at 65 °C for 5 min, recycle the HB buffer into the original tube.
- Perform pre-hybridization with new heated HB buffer at 65 °C at least 1 h.
- Pre-heat the probe9 (for this case was an il34 probe, 1 ng/mL) at 65 °C at least 10 min. Then recycle the HB buffer into the original tube. Perform hybridization with the pre-heated probe at 65 °C overnight.
- Antibody treatment (Day II)
- Pre-heat the 50% formamide/2x saline sodium citrate plus Tween 20 (SSCT), 2x SSCT, 0.2x SSCT at 65 °C.
- Recycle the probe into the original tube and store the probe at -20 °C.
- Wash the embryos separately with 50% formamide/2x SSCT; 2x SSCT; 0.2x SSCT, 3x 20 min or 2x 30 min each at 65 °C.
- Wash the embryos with PBST 3x 5 min.
- Block the samples with 600 µL of blocking buffer (5% filtered fetal bovine serum (FBS) in PBST) for 1 h at RT.
- Add 400 µL of Anti-digoxigenin-HRP antibody solution (1:1,000-1:2,000 in blocking buffer) and incubate the embryos at 4 °C overnight. If signals are weak, use 1:500 dilution of antibody.
- Coloring and primary antibody incubating (Day III)
- Remove the antibody; wash the embryos with PBST, 6x 20 min at RT.
- Rinse the sample with 30 µL of 1x Plus Amplification Diluent for 5 min at RT.
- Discard the diluent by pipetting out; dilute Fluorophore Tyramide Stock Solution (Cyanine 3 Plus Amplification Reagent (Cy3) or Cyanine 5 Plus Amplification Reagent (Cy5), for this case Cy3 was used) 1:50 in 1x Plus Amplification Diluent to make the Fluorophore Tyramide Working Solution. Prepare 50-100 µL of working solution for each sample.
- Incubate the sample in the Fluorophore Tyramide Working Solution for 5-15 min in dark at RT. If signals are weak, extend the incubation time to 30 min.
- Stop the reaction by changing the working solution with PBST and examine the signals.
- Wash the embryos with PBST 3x 10 min at RT.
- Incubate the sample with primary antibody at 4 °C overnight. For this case, use the Goat-Anti-GFP antibody as the primary antibody.
- Secondary antibody staining (Day IV)
- Wash the embryos with PBST for 4x 30 min.
- Incubate the embryos with secondary antibody at 4 °C overnight. For this case, use Alexa 488-Anti-Goat antibody as the secondary antibody.
- Take pictures (Day V)
- Wash the embryos with PBST 3x 10 min at RT.
- Store the embryos in 70% glycerol in dark at 4 °C overnight or -20 °C for longer.
3. Live Imaging
- Sample selecting
NOTE: Use the live image to directly observe whether macrophages of Tg (fabp10a: il34; fabp10a: DsRed; mpeg1: GFP) fish would migrate into the liver under IL-34 induction during 3-3.5 dpf. Here the Tg (fabp10a-DsRed) transgenic line is used to label the liver region and make it visible, to facilitate the localization of the liver and to determine whether macrophages migrate into the liver. Before imaging, use a fluorescence microscope to select the DsRed and GFP double positive embryos. - Fish mounting
- Use a metal bath to heat 1 mL of 1% low melting agarose to above 90 °C to completely melt it.
- After the low melting agarose is cooled to body temperature, add 50 µL of 0.2% tricaine, and uniformly mix tricaine with the agarose.
- Move the anesthetized embryos to a small dish mounted with a cover slide on the bottom, remove the surrounding water, slowly drop the low melting agarose on the embryos, carefully set the position of the fish before the agarose is solidified, keep the liver area close to the cover slide on the bottom of the dish.
- After the low melting agarose is solidified, carefully cover it with another layer of agarose to reinforce it.
- Place the dish on the confocal microscope carrier table, cover the fish with the E2 solution10 with tricaine and start imaging.
- Software operation of the confocal microscope
- Open the ZEN black 2.3 software, install the living cell workbench onto the microscope carrier table.
- Click Locate | Incubation | Temperature to set the temperature to 29 °C.
- Place the dish in the center of the living cell workbench, cover the fish with the E2 solution10 with tricaine.
- Click the Acquisition menu, select the required scan mode and lasers in the Smart Setup menu, then select Z-Stack and Position.
- Click the Experiment Designer menu, select Enable Multi Block Experiment, in the first block, to find the sample under the low magnification, then switch to the high magnification, let the observed area in the center of the visual field.
- Set the position and Z-Stack information, select the appropriate laser intensity, scanning layers and imaging speed.
- Create a new block and repeat the above steps. After setting up all blocks, set the appropriate number of loops and start recording (Figure 1).
Subscription Required. Please recommend JoVE to your librarian.
Representative Results
The steps involved in the protocol of zebrafish are illustrated in Figure 2. First, we generated the pBLK-fabp10a-il34-sv40 construct in which il34 was driven by the fabp10a promoter (Figure 2). The construct was microinjected into one-cell stage Tg (mpeg1: GFP) zebrafish embryos which can label macrophages with GFP and WT embryos which were raised to adults to generate transgenic stable line (Figure 2). The expression of il34 was analyzed by whole mount fluorescence in situ hybridization (Figure 2 and Figure 3). Macrophages labeled by GFP were analyzed by immunostaining (Figure 2 and Figure 3). We used live imaging to directly observe whether macrophages would migrate into the liver under the il34 induction during 3-3.5 dpf (Figure 2, Figure 4, Supplementary Movie 1 and Supplementary Movie 2).
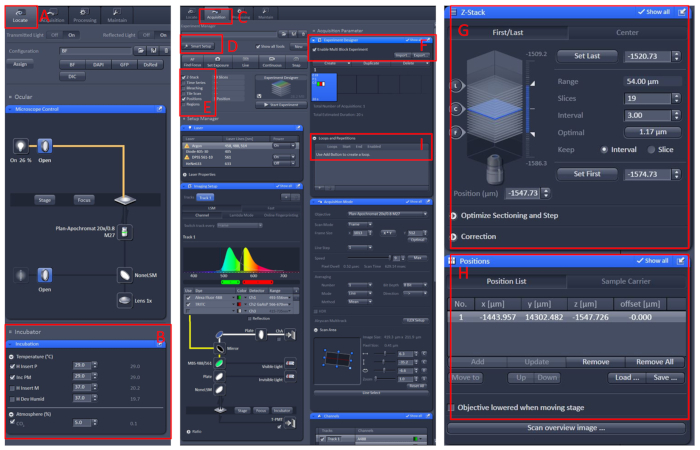
Figure 1: Software operation of the confocal microscope live imaging. Open the ZEN black 2.3 software, install the living cell workbench onto the microscope carrier table, then click Locate (A) | Incubation | Temperature (B) to set the temperature to 29 °C. Place the dish in the center of the living cell workbench, cover the fish with the E2 solution10 with tricaine. After all of these, click the Acquisition (C) menu, select the required scan mode and lasers in the Smart Setup (D) menu, then select Z-Stack and Position (E). Finally, click the Experiment Designer (F) menu, select the Enable Multi Block Experiment, in the first block, to find the sample under the low magnification, then switch to the high magnification, let the observed area in the center of the visual field, set the position and Z-Stack (G and H) information, select the appropriate laser intensity, scanning layers and imaging speed. Create a new block, and repeat the above steps. After setting up all blocks, set the appropriate number of loops (I) and start recording. Please click here to view a larger version of this figure.

Figure 2: A workflow to investigate the function of a chemokine on macrophage migration in vivo. We constructed a tissue-specific (liver) overexpression plasmid to overexpress IL-34 and injected the plasmid into one-cell stage transgenic fish embryos whose macrophages were specifically labeled by a fluorescent protein (Tg: (mpeg1: GFP)). The injected WT embryos were raised to generate a stable transgenic line. We then used whole mount fluorescent in situ hybridization and immunostaining to detect the pattern of the gene expression and the number or location of macrophages of the transient injected embryos or stable line embryos (4 dpf). Finally, we used confocal live imaging to directly observe macrophage behavior in the stable transgenic fish (3-3.5 dpf) to study the function of IL-34 on macrophages in vivo. Please click here to view a larger version of this figure.

Figure 3: Fluorescent WISH combine with immunostaining. This figure has been modified from Jiang et al.11. A total of 1.8 nL (30 ng/µL) of the pBLK-fabp10a-il34-sv40 construct was microinjected into one-cell stage Tg (mpeg1: GFP) zebrafish embryos. (A) WISH of il34 expression (red) and whole-mount antibody staining of GFP expression (green) in 4 dpf embryo (6x). The whole body picture of the fish is made up of two separate images taken by confocal and stitched together in Photoshop. Insets are high magnification (20x) of the corresponding boxed regions (orange dotted areas). (B) Quantitative analysis of macrophage cell numbers in un-injected and construct injected embryos' liver (shown in the white dotted area) and tail region (approximately between the 13th and 17th somite, shown between two white dotted lines). Data were analyzed by Mann Whitney U test, ** p < 0.01 compared to control. n = 5, 5 for the 4 dpf injected and control fish. Bars: 200 µm (white line); 50 µm (yellow line). (C) WISH of il34 expression and whole-mount antibody staining of GFP expression in 4 dpf stable line embryo (6x). The whole body picture of the fish is made up of two separate images taken by confocal and stitched together in Photoshop. Insets are high magnification (20x) of the corresponding boxed regions (orange dotted areas). (D) Quantitative analysis of macrophage cell numbers in Tg (mpeg1: GFP) and Tg (fabp10a: il34; mpeg1: GFP) embryos' liver (shown in the white dotted area) and tail region (approximately between the 13th and 17th somite, shown between two white dotted lines). Please click here to view a larger version of this figure.

Figure 4: Confocal live imaging to directly observe macrophage behavior in the stable transgenic fish. This figure has been modified from Jiang et al.11. Micrographs of live imaging show the process of a macrophage (green, labeled by white arrows) passing by the liver (red) within 28 min in control fish (A) and the process of a macrophage (green, labeled by white arrows) migrating into the liver (red) within 28 min in IL-34 overexpressing fish (B). Scale bars = 40 µm (white line). Please click here to view a larger version of this figure.

Supplementary Movie 1: Live imaging showing the process of macrophages (green, labeled by white arrows) migrating into the liver (red) within 2 h in IL-34 overexpressing fish. Scale bars = 20 µm (white line). This movie has been republished from Jiang et al.11. Please click here to view this video. (Right-click to download.)

Supplementary Movie 2: Live imaging showing the process of macrophages (green, labeled by white arrows) wandering around the liver (red) within 2 h in control fish. Scale bars = 20 µm (white line). This movie has been republished from Jiang et al.11. Please click here to view this video. (Right-click to download.)
Subscription Required. Please recommend JoVE to your librarian.
Discussion
The protocol described here allows us to investigate the function of a chemokine on the behavior of macrophagein vivo and the procedure requires some technical expertise. In summary, there are several critical steps to avoid complications in the protocol: 1) select a suitable transgenic line which shows specific and strong transgenic signal to label the cell of interest; 2) select an appropriate tissue which is accessible for imaging and transgenic gene overexpression; 3) make a sensitive and specific RNA probe; 4) select an appropriate observation time window to accurately capture the cell behavior.
In the procedure of whole mount fluorescence in situ hybridization combined with immunostaining, the RNA probe used to detect gene expression should be sensitive and the signal need to be strong enough. In order to capture the gene function on cell behavior, a series of time points should be tested. For example, in observing the effect of il34 on macrophage migration, although the fabp10a promoter began to express at 2-3 dpf, macrophages accumulation in the liver was not obvious at that time. It is only by 4 dpf that the enrichment of macrophage in the liver becomes apparent. In addition, after in situ hybridization, the signal intensity of subsequent immunostaining will be affected. For example, comparing with GFP, DsRed is difficult to color in immunofluorescence staining after in situ hybridization, probably because of the different protein structures. Generally speaking, the signal intensity of immunostaining after whole mount fluorescence in situ hybridization would be less than that of single immunostaining.
In the live imaging step with the confocal microscope, it is necessary to keep the sample close to the bottom of the dish. When the embryos float in agarose, the working distance of the objective may be insufficient, also, the agarose between the objective and the sample would affect the quality of imaging. Besides, the number of samples for imaging at each time should be set properly. One must make sure that the time span between two scans of each fish would not be too long to lose the details of cell behavior. So this method is not suitable for tracking cells that move fast in thick tissues.
In conclusion, this protocol can be used to observe the function of chemokines on the behavior of a variety of cells such as macrophages, neutrophils, and T-cells. Here, we used IL-34, a recently identified ligand of CSF-1R function in chemotaxis6,7, as an ectopic expressed chemokine to induce macrophages migration. Most of the existing experimental models of cell chemotaxis are based on in vitro cell experiments, but the in vitro experiments sometimes are too simple to model the complex environment in vivo. Also, it is difficult to image the chemo-attraction abilityin vivo when simply look at the in vitro situation. This method utilized the specific advantages of zebrafish for direct cell behavior observation which is difficult for mice. The current method allowed us to quickly test the chemokine functions on cell behaviors within several days and make zebrafish a powerful model to study the molecular and cell biology.
Subscription Required. Please recommend JoVE to your librarian.
Disclosures
The authors have nothing to disclose.
Acknowledgments
We thank Dr. Jingrong Peng for sharing the Tg (fabp10a: DsRed) transgenic line; Dr. Zilong Wen for sharing the Tg (mpeg1: GFP) transgenic lines; Dr. Koichi Kawakami for providing the pTol2 vector. This work was supported by the National Natural Science Foundation of China (31771594), Guangdong Science and Technology Plan projects (2019A030317001) and the Fundamental Research Funds for the Central Universities (D2191450).
Materials
| Name | Company | Catalog Number | Comments |
| Antibody | |||
| Alexa 488-Anti-Goat antibody | Invitrogen | A11055 | |
| Anti-Digoxigenin-HRP | perkinelmer | NEF832001EA | |
| Goat-Anti-GFP antibody | Abcam | ab6658 | |
| Reagent | |||
| CaCl2· 2H2O | Sigma | 21097 | |
| Cyanine 3 Plus Amplification Reagent | perkinelmer | NEL745001KT | |
| E2 solution | 15 mM NaCl +0.5 mM KCl +1.0 mM MgSO4+150 µM KH2PO4 + 50 µM Na2HPO4 +1.0 mM CaCl2 + 0.7 mM NaHCO3 | ||
| Fetal Bovine Serum (FBS) | Life | 10099-133 | |
| Formamide | Diamond | A100314 | |
| Glycerol | Sigma | V900860 | |
| Heparin sodium | Sigma | H3149 | |
| Hybridization buffer(HB) | 50% formamide+ 5×SSC+9 mM sodium citrate+50 μg/ml heparin sodium+ 500 μg/mL tRNA+ 0.1% Tween20 | ||
| KCl | Sigma | P5405 | |
| KH2PO4 | Sigma | P5655 | |
| Low melting agarose | Sigma | A9414 | |
| Methanol | GHTECH | 1.17112.023 | |
| Methylene blue | Sigma | M9140 | |
| MgSO4 | Sigma | M2643 | |
| Na2HPO4 | Sigma | S5136 | |
| NaCl | Sigma | S5886 | |
| NaHCO3 | Sigma | S5761 | |
| Paraformaldehyde (PFA) | Sigma | 158127 | Suspend 16 g of PFA in 400 ml of 1x PBS, heat at 60 °C to dissolve about 30 min. This solution can be prepared in advance and stored at -4 °C. Caution. Manipulate with mask. |
| 10×PBS | 14.2 g Na2HPO4+80 g NaCl+2 g KCl+ 2.4 g KH2PO4 in 1L ddH2O | ||
| Phenylthiourea (PTU) | Sigma | P7629 | |
| 1×Plus Amplification Diluent | perkinelmer | NEL745001KT | |
| Proteinase K | Fermentas | E00492 | |
| 20×Saline sodium citrate(SSC) | 175.3 g NaCl+ 88.2 g sodium citrate in 1 L ddH2O, PH 7.0 | ||
| Sodium citrate | Sigma | A5040 | |
| Tricaine | Sigma | E10521 | |
| tRNA | Sigma | R6625 | |
| Tween20 | Sigma | P2287 | |
| Plasmid | |||
| pBLK-fabp10a-il34-sv40 | For Tg (fab10a:il34) transgenic line generation | ||
| pBSK-il34 | For il34 probe preparation | ||
| Fish | |||
| Tg (mpeg1: GFP) | Label macrophages with GFP | ||
| Tg (fabp10a: DsRed) | Label liver cells with DsRed | ||
| Tg (fab10a:il34) | Over-expression IL-34 in liver cells |
References
- Howe, K., et al. The zebrafish reference genome sequence and its relationship to the human genome. Nature. 496 (7446), 498-503 (2013).
- Wang, Y., et al. IL-34 is a tissue-restricted ligand of CSF1R required for the development of Langerhans cells and microglia. Nature Immunology. 13 (8), 753-760 (2012).
- Lin, H., et al. Discovery of a cytokine and its receptor by functional screening of the extracellular proteome. Science. 320 (5877), 807-811 (2008).
- Wei, S., et al. Functional overlap but differential expression of CSF-1 and IL-34 in their CSF-1 receptor-mediated regulation of myeloid cells. Journal of leukocyte biology. 88 (3), 495-505 (2010).
- Etienne, D., Foucher, S. B. L. P., Norbert Ifrah, P. G. Y. D. IL-34 Induces the Differentiation of Human Monocytes into Immunosuppressive Macrophages. Antagonistic Effects of GM-CSF and IFNc. PLoS One. 8 (2), e56045 (2013).
- Segaliny, A. I., et al. Syndecan-1 regulates the biological activities of interleukin-34. Biochimica et Biophysica Acta. 1853 (5), 1010-1021 (2015).
- Zhou, S. L., et al. miR-28-5p-IL-34-macrophage feedback loop modulates hepatocellular carcinoma metastasis. Hepatology. 63 (5), 1560-1575 (2016).
- Gordon, J. I., et al. Tissue specific expression and developmental regulation of two genes coding for rat fatty acid binding proteins. Journal of Biological Chemistry. 260 (4), 1995-1998 (1985).
- Westerfield, M. The Zebrafish Book: A Guide for the Laboratory Use of Zebrafish (Danio rerio). , University of Oregon. Eugene, OR. (2000).
- Nüsslein-Volhard, C., Dahm, R. Zebrafish: a practical approach. , Oxford University Press. New York. (2002).
- Jiang, Y., Chen, J., Yen, K., Xu, J. Ectopically Expressed IL-34 Can Efficiently Induce Macrophage Migration to the Liver in Zebrafish. Zebrafish. 16 (2), 165-170 (2019).
