Waiting
Login processing...

Trial ends in Request Full Access Tell Your Colleague About Jove

Biology

Visualization of ATP Synthase Dimers in Mitochondria by Electron Cryo-tomography

Published: September 14, 2014 doi: 10.3791/51228

Summary

We present a protocol of how to collect and process electron cryo-tomograms of whole mitochondria. The technique provides detailed insights into the structure, function, and organization of large membrane protein complexes in native biological membranes.

Abstract

Electron cryo-tomography is a powerful tool in structural biology, capable of visualizing the three-dimensional structure of biological samples, such as cells, organelles, membrane vesicles, or viruses at molecular detail. To achieve this, the aqueous sample is rapidly vitrified in liquid ethane, which preserves it in a close-to-native, frozen-hydrated state. In the electron microscope, tilt series are recorded at liquid nitrogen temperature, from which 3D tomograms are reconstructed. The signal-to-noise ratio of the tomographic volume is inherently low. Recognizable, recurring features are enhanced by subtomogram averaging, by which individual subvolumes are cut out, aligned and averaged to reduce noise. In this way, 3D maps with a resolution of 2 nm or better can be obtained. A fit of available high-resolution structures to the 3D volume then produces atomic models of protein complexes in their native environment. Here we show how we use electron cryo-tomography to study the in situ organization of large membrane protein complexes in mitochondria. We find that ATP synthases are organized in rows of dimers along highly curved apices of the inner membrane cristae, whereas complex I is randomly distributed in the membrane regions on either side of the rows. By subtomogram averaging we obtained a structure of the mitochondrial ATP synthase dimer within the cristae membrane.

Introduction

Mitochondria are the power-houses of the cell. By converting an electrochemical proton gradient across the inner mitochondrial membrane into chemical bond energy, the mitochondrial ATP synthase produces most of the ATP that drives cellular processes. In order to understand the mechanisms behind mitochondrial energy conversion, we need to determine the structure of the ATP synthase in situ, and to find out how it is arranged and distributed in the inner mitochondrial membrane. Although high-resolution structures of most of the mitochondrial ATP synthase components1-3 and low-resolution maps of the whole complex4 are available, it is important to establish the structure and conformation of the working enzyme in the membrane. The distribution of the ATP synthase in the inner mitochondrial membrane has been widely assumed to be random, but an early finding5 and our own initial results6 indicated that this is not the case. Subsequent studies from our group and others7 have confirmed that the ATP synthase is arranged in long rows of dimers along the tightly curved ridges of the inner mitochondrial membrane cristae8, while the proton pumps of the electron transport chain appear to be located at either side of the rows9. This arrangement has important implications for the mechanisms of mitochondrial energy conversion.

The technique we have used to determine this arrangement is electron cryo-tomography (cryo-ET). Cryo-ET is currently the only method that delivers accurate three-dimensional (3D) volumes of cells, cellular compartments or organelles at molecular resolution. Cryo-ET is particularly suitable for studying large complexes in biological membranes, because the membranes appear with good contrast and are easy to trace in 3D tomographic volumes.

Other methods to study the 3D structure of cells or organelles do not provide molecular detail. Super-resolution light microscopy10,11 is superb at revealing the position or distances between light-emitting labels attached to proteins of interest with a precision of tens of nm, but it does not reveal the structure of the protein itself, even at low resolution. Transmission electron microscopy of serial sections12 or block-face imaging by scanning electron microscopy13 of plastic-embedded biological samples provide low-resolution views of cellular volumes but likewise do not reveal molecular detail. Atomic force microscopy14 can in principle deliver molecular or even atomic resolution, but only at the surface of objects on an atomically flat, solid support. Finally, X-ray tomography15 or scattering of intense X-ray pulses from free-electron lasers16 is unlikely to reveal the structure of large, complex, aperiodic objects such as whole cells or organelles at molecular resolution in the foreseeable future. Thus at present, there is no alternative to cryo-ET for studies of the 3D structure of cells or organelles at nanometer resolution.

Cryo-ET is the method of choice for examining the structure and conformation of membrane-associated protein assemblies including the nuclear pore complex17, the influenza spike complexes18, and the flagella motor proteins22,23 but also the organization of whole bacterial cells19 and entry of pathogenic viruses such as HIV in to cells20-23. Cryo-ET is invaluable for visualizing filamentous proteins and their interactions in the cell, including actin filaments24 or axonemes25. The resolution can be enhanced to 2 nm or better by subtomogram averaging26, whereby subvolumes of repeated, regular features are cut out of a tomographic volume and averaged by single-particle image processing techniques.

Cryo-ET involves the acquisition of a series of projection images of a thin specimen (<250nm) taken at different tilt angles in a transmission electron microscope (TEM). The specimen must be thin so that electrons, which interact strongly with matter, are scattered no more than once. Multiple scattering makes the resulting images difficult to interpret and reduces contrast. Images of the selected specimen area are aligned relative to each another and projected into a 3D space by a suitable computer program, generating a 3D volume of the specimen. The alignment of the images is aided by gold fiducial markers, which are mixed with the sample prior to freezing. Ideally 10 or more evenly distributed fiducial markers should be present in each image to achieve a good alignment.

To observe molecular detail, samples are plunge-frozen in liquid ethane, which preserves their native hydrated state. Freezing in liquid ethane is so fast (~105 °C/sec)27 that water does not crystallize but remains in a vitrified, glass-like state. Ice crystal formation damages sensitive biological structures. As biological samples suffer from radiation damage, there is a limit to the total number of scattering events the specimen can tolerate. Images are thus acquired in low-dose mode: An area of interest is identified at low magnification (1,500X) with an electron dose below 1 e-/nm2 (search mode). The image is then focused at a higher magnification, off the area of interest (focus mode). Only when an image is acquired, the area of interest is irradiated with a higher electron dose (exposure mode).

Here, we present an overview of how to collect and process electron cryo-tomograms, using ATP synthase dimers in the inner mitochondrial membrane as an example. The following protocol describes how to prepare mitochondria for cryo-ET, how to set up and collect a tilt series with a specific total electron dose, and how to process the tilt series to obtain a 3D volume of the area of interest. An overview of the procedure is illustrated in Figure 1.

Protocol

1. Preparation of Mitochondria from Cells or Tissues by Differential Centrifugation

This section describes a general procedure for the isolation of intact mitochondria from various eukaryotic organisms. The precise buffer components and centrifugation speeds need to be optimized for each tissue/species studied.

  1. Break cells in isotonic buffer (e.g., 250 mM sucrose, 10 mM HEPES pH 7.4), using a glass-bead mill (fungal mycelium)28, enzymatic digestion of the cell wall (Saccharomyces cerevisiae)29, a ball-bearing homogenizer (single-cell eukaryotes/culture cells/nematodes)30, or a blender (animal or plant tissues)31.
  2. Remove cell debris by filtration through muslin followed by low-speed centrifugation (2,000 x g, 4 °C, 10 min).
  3. Collect supernatant and pellet mitochondria by high-speed centrifugation (9,000 x g, 4 °C, 10 min).
  4. Where necessary, use an isotonic density step gradient for additional purification of the mitochondrial fraction32.

2. Preparation of Mitochondria for Electron Cryo-tomography

The following section describes how to obtain frozen-hydrated samples for cryo-ET. NOTE: The method involves the use of extremely cold liquid nitrogen and ethane, which can cause severe skin burns. Safety goggles and cryo-protection gloves must be worn. Liquid ethane, which is also flammable, must be handled in a fume hood.

  1. Resuspend pelleted mitochondria in 250 mM trehalose, 10 mM HEPES buffer at pH 7.4 to a concentration of approximately 5 mg/ml total protein.
  2. Glow-discharge holey carbon EM grids, carbon side up, in a vacuum device according to manufacturer’s instructions.
  3. Liquefy a few milliliters of ethane by directing a stream of ethane gas onto the inner side of a liquid nitrogen cooled aluminum container.
  4. Mix protein A-conjugated gold fiducial suspension 1:1 with mitochondrial suspension and immediately apply 3 µl to a glow-discharge EM grid held in tweezers.
  5. Place the tweezers in a vitrification device, e.g., a home-made guillotine. Blot off excess liquid with a wedge of filter paper (~5 sec or until liquid stops spreading) and immediately plunge the grid into liquid ethane by releasing the trigger.
  6. Transfer the grid from liquid ethane into liquid nitrogen. During transfer, remove excess ethane from the grid with filter paper. Place the tip of a wedge-shaped piece of filter paper into the liquid ethane. As the liquid ethane rises, gently drag the grid up the filter paper but keep it below the liquid front. Liquid ethane is removed from the grid by capillary action and once all liquid ethane has been removed, immediately transfer the grid into liquid nitrogen.
  7. Place the vitrified grid into a grid storage box, and store under liquid nitrogen for later use as appropriate.

3. Recording of Tomographic Tilt Series

The following section describes how to set up and collect a tomographic tilt series of a mitochondrion with a Polara electron microscope equipped with a post-column energy filter and CCD camera. Similar protocols are used with all electron cryo-microscopes equipped with CCD or direct electron detector cameras.

  1. Align the Microscope
    1. Insert test specimen e.g., graphite and gold islands on holey carbon film.
    2. Select search mode in the microscope’s low-dose system.
    3. Bring sample to eucentric height. This is the point of minimal xy movement when tilting the specimen holder. Center a point of interest at 0° tilt, tilt the stage to 20° and re-center the point by altering the z-height. Return to 0° and repeat until lateral offset is minimized.
    4. Select exposure mode. Choose desired magnification for collecting a tomogram (e.g., 25,000X on detector ≈ 0.6 nm specimen pixel size).
    5. Choose a small condenser aperture (50-70 mm) and select a spot size and beam intensity so that the beam is just wider than the imaging device and gives a pixel reading of 60 e-/pixel (CCD) or 14 e-/pixel/sec (direct electron detector, counting mode).
    6. Center condenser aperture.
    7. Find Gaussian focus e.g., point of minimal contrast. Reset microscope defocus reading and correct pivot points and rotation center according to manufacturer’s instructions.
    8. Dial in desired defocus for recording tomogram. NOTE: High defocus (8 µm) increases contrast but reduces resolution, whereas low defocus (2-4 µm) increases resolution at the expense of contrast.
    9. Over an empty hole, generate a new gain reference and align energy filter according to manufacturer’s instructions.
    10. Align search and exposure modes. In exposure mode, center a point of interest and switch to search mode. Select magnification of 1,500X (0.033 µm/pixel of specimen on detector) and defocus of 100 µm (for increased contrast). Bring point of interest back to center using image shift coils.
    11. In search mode, adjust spot size and beam intensity so that the beam is just wider than the imaging device and gives a pixel reading of ~20 e-/pixel (CCD) or ~8 e-/pixel/sec (direct electron detector, counting mode).
  2. Finding a Good Specimen Area
    1. Insert the grid with frozen-hydrated mitochondria into the electron microscope at liquid nitrogen temperature (refer to EM manufacturer’s instructions).
    2. In search mode, search the grid for areas of appropriate ice thickness and specimen quality. Take a 6 sec search image of promising areas to determine suitability for tomogram collection. Both the inner and outer mitochondrial membrane should be visible at this magnification.
  3. Recording of a Tomographic Tilt Series
    1. Once a good specimen area is found, tilt the stage ±60° to determine the maximum tilt range that is available without any obstruction of the exposure or focus area by grid bars or ice lumps.
    2. On a nearby ice-filled hole of similar appearance, change to exposure mode and adjust the beam intensity or image acquisition time so each recorded image has an electron dose of 30-50 e-/pixel for CCDs or 6-8 e-/pixel/s direct electron detectors, counting mode.
    3. Calculate the dose distribution ratio (I0/I60) by dividing the average electron count for a 1 sec image acquired at 0° with that of a 60° image. This ratio describes the increase in exposure time required to maintain a constant electron count per image with increasing tilt angle (exposure time = 1/cos(α)n where (I0/I60)=2n). The ratio also serves as a good indication of ice thickness. Good tomograms of mitochondria are usually recorded with an I0/I60 = 2.3-2.6.
    4. Over an empty hole, acquire a 1 sec image in exposure mode and note the electron count per Å2. Taking into account the dose distribution ratio, calculate the total number of images that can be recorded for a specific total electron dose (e.g., <40 e-2 for structure determination & ~160 e-2 for morphology).
    5. Determine the appropriate tilt interval for tomogram collection by dividing the total tilt range (e.g., 120° for ±60°) by the total number of images calculated in 3.3.4.
  4. Set up and record a tomogram with the parameters determined above using appropriate automatic data collection software33,34. Tilt series are usually started at ±20° and go through 0° before reaching high tilts in order to maximize the information contents of low-tilt images which is destroyed by increasing electron dose.

4. Creation and Segmentation of Tomographic Volumes

This section describes how tomographic volumes of mitochondria are generated from tilt series and how the volumes are present for general viewing.

  1. Save the tomographic tilt series to an appropriate directory. Generate an image stack and convert to an appropriate file format with open-source software, such as dm2mrc or tif2mrc (IMOD package), which convert .dm3, .dm4 or .tif files to mrc stacks. mrc stacks are required for tomographic reconstruction with IMOD35. Other packages require different formats.
  2. Align the images and generate a tomogram by following the steps detailed in the IMOD tutorial (http://bio3d.colorado.edu/imod/doc/etomoTutorial.html).
  3. Enhance the contrast of the tomogram using the non-linear anisotropic diffusion filter distributed with IMOD. This filter works well for membranes and membrane-associated particles such as ATP synthase.
  4. For visualization, manually segment the tomogram using commercially available programs e.g., Amira. Assign voxels corresponding to the inner or outer membrane and generate a surface. Using the clicker option in the EM-package plugin for AMIRA36 mark the location of ATP synthase particles.

5. Subtomogram Averaging of ATP Synthase Dimers and Fitting of X-Ray Structures

The following section describes how subtomogram averages of ATP synthase dimers can be obtained.

  1. Using the marked particles as input and an appropriate software package such as the 'Particle Estimation for Electron Tomography' program, calculate a subtomogram average.
  2. For a resolution estimate, compare two independently determined subtomogram averages by Fourier shell correlation37.
  3. If available, dock known X-ray structures into the subtomogram average by rigid body fitting, either manually or using automatic sequential docking routines such as those in the program Chimera38.

Representative Results

Electron cryo-tomograms of mitochondria clearly reveal the 3D morphology of the organelle (Figure 2). Manual segmentation of the membranes in a tomographic volume illustrates the structure of the cristae in a mitochondrion. By imaging mitochondria from different yeast knockout strains that lack certain protein components, the effect of these proteins on cristae morphology can by assessed. Figure 3 shows a mitochondrion from a yeast strain lacking ATP synthase subunit e. This component of the ATP synthase complex is required for the dimerization of the mitochondrial ATP synthase. Mitochondria from this strain lack the normal lamellar cristae of the wildtype mitochondria (Figure 2) and instead contain a number of inner membrane compartments. These compartments are either devoid of cristae or contain small balloon-shaped membrane invaginations (Figure 3).

In tomograms with good contrast, large mitochondrial protein complexes, in this case ATP synthase dimers, are easily visible (Figure 4; Movie 1). The structures of the complexes can be determined at 2-3 nm resolution by subtomogram averaging (Figure 5; Movie 2). The average volumes may be placed back into the tomogram in order to assess the organization of individual complexes relative to each other and to other protein complexes in the membrane (Figure 6; Movie 3).

Figure 1
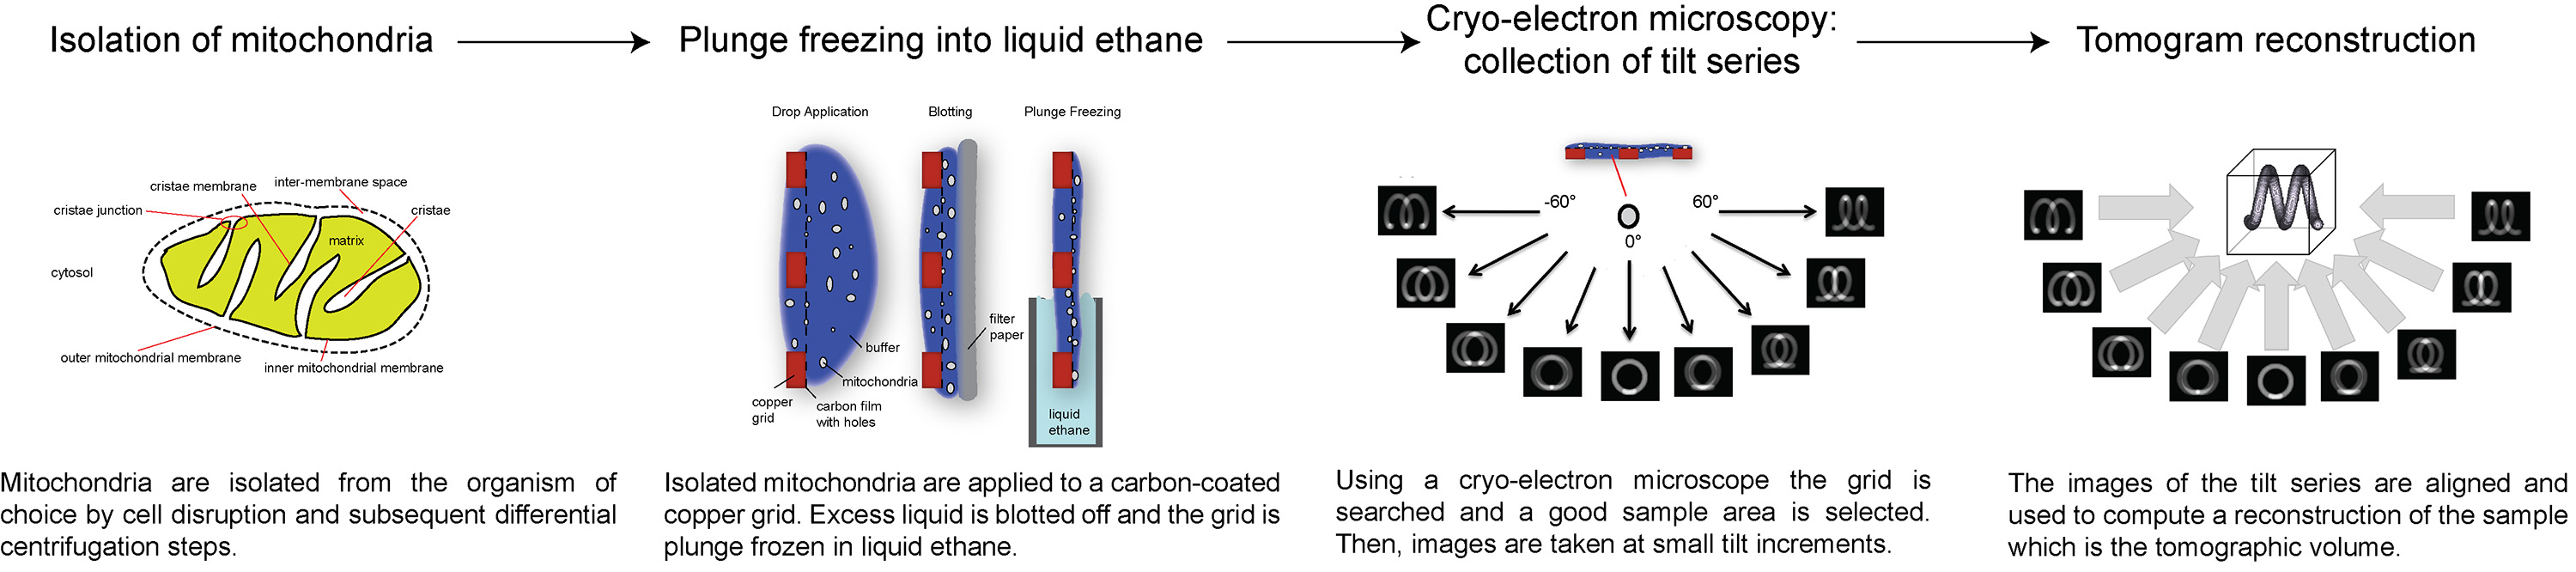
Figure 1. Flow-chart showing the stages of electron cryo-tomography . Click here to view larger image.

Figure 2
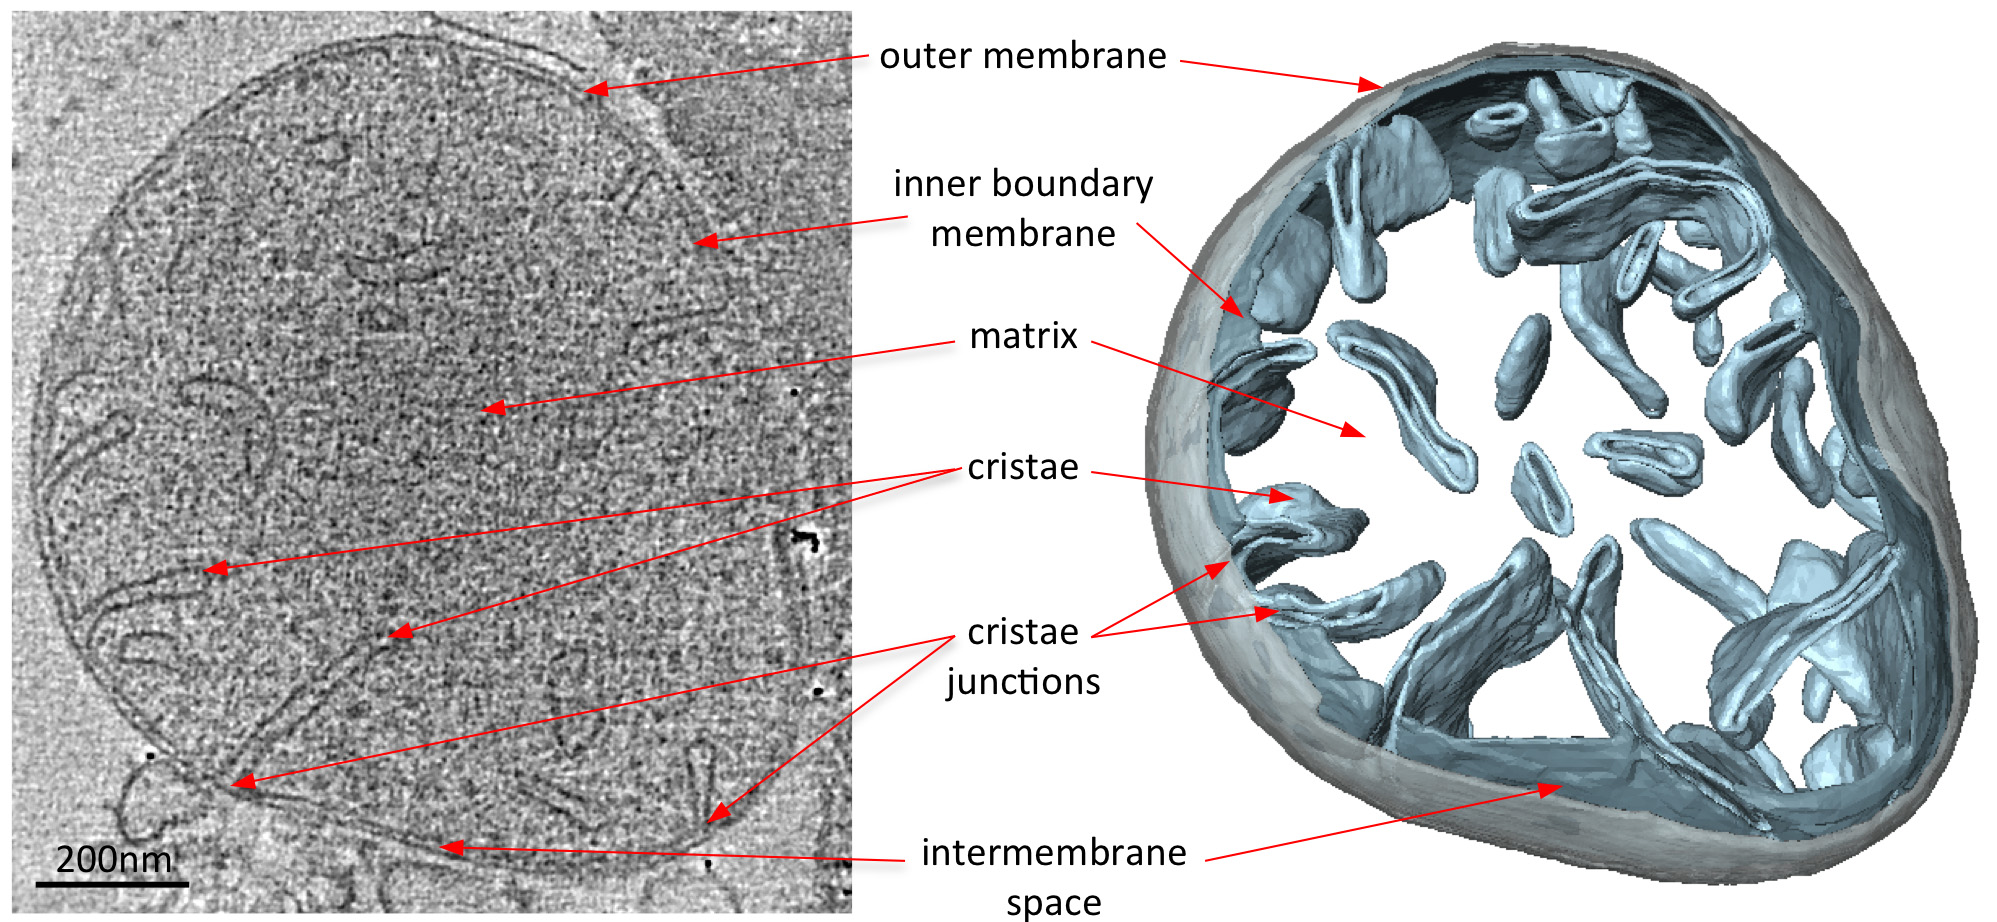
Figure 2. Morphology of a mitochondrion from wildtype S. cerevisiae. Central slice through a tomographic volume of a wildtype S. cerevisiae mitochondrion (left) and corresponding surface-rendered volume (right). The segmented volume of the outer membrane is shown in grey and the volumes of the inner boundary and cristae membranes in light blue. Adapted from Davies et al8. Click here to view larger image.

Figure 3
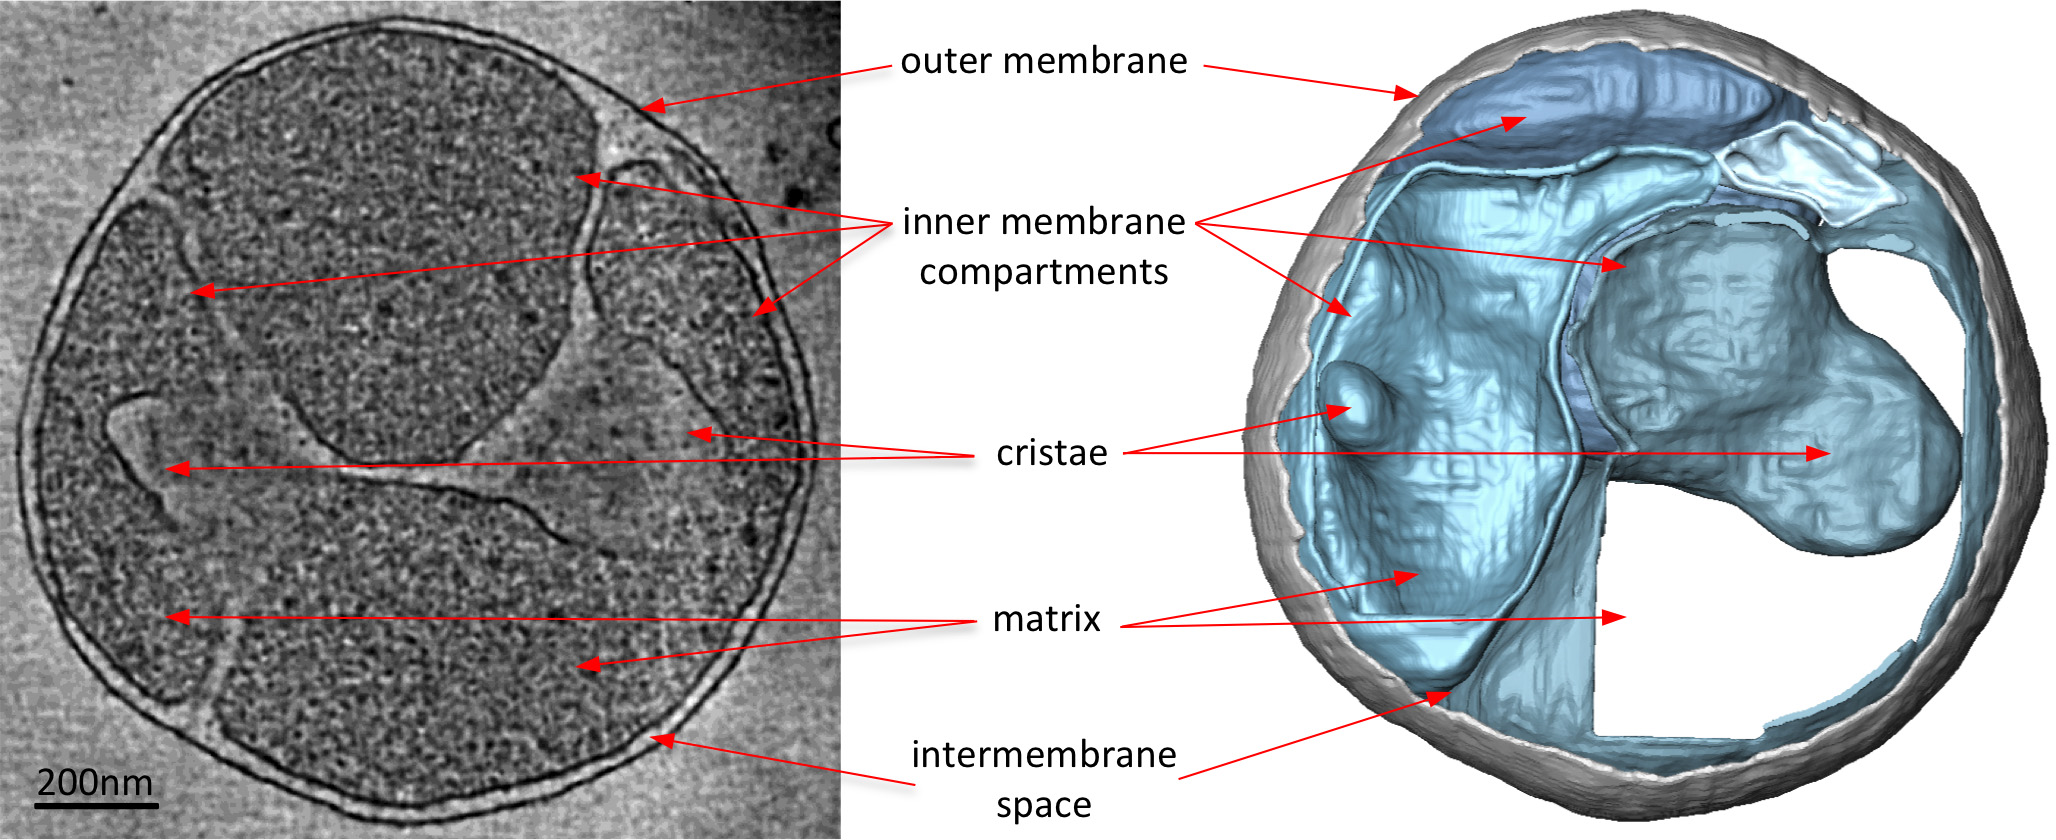
Figure 3. Mitochondrion from a S. cerevisiae strain lacking a subunit required for ATP synthase dimerization. Slice through tomographic volume (left) and accompanying surface-rendered volume (right) of a mitochondrion from a S. cerevisiae strain lacking the protein subunit e required for ATP synthase dimerization. When compared with Figure 2, the mitochondrion from the mutant strain lacks the normal lamellar cristae of wildtype mitochondria. Instead, the mitochondrion has many inner membrane compartments with either no cristae or balloon-shaped cristae. Thus electron cryo-tomography highlights alterations in membrane morphology due to gene deletions. Adapted from Davies et al8. Click here to view larger image.

Figure 4
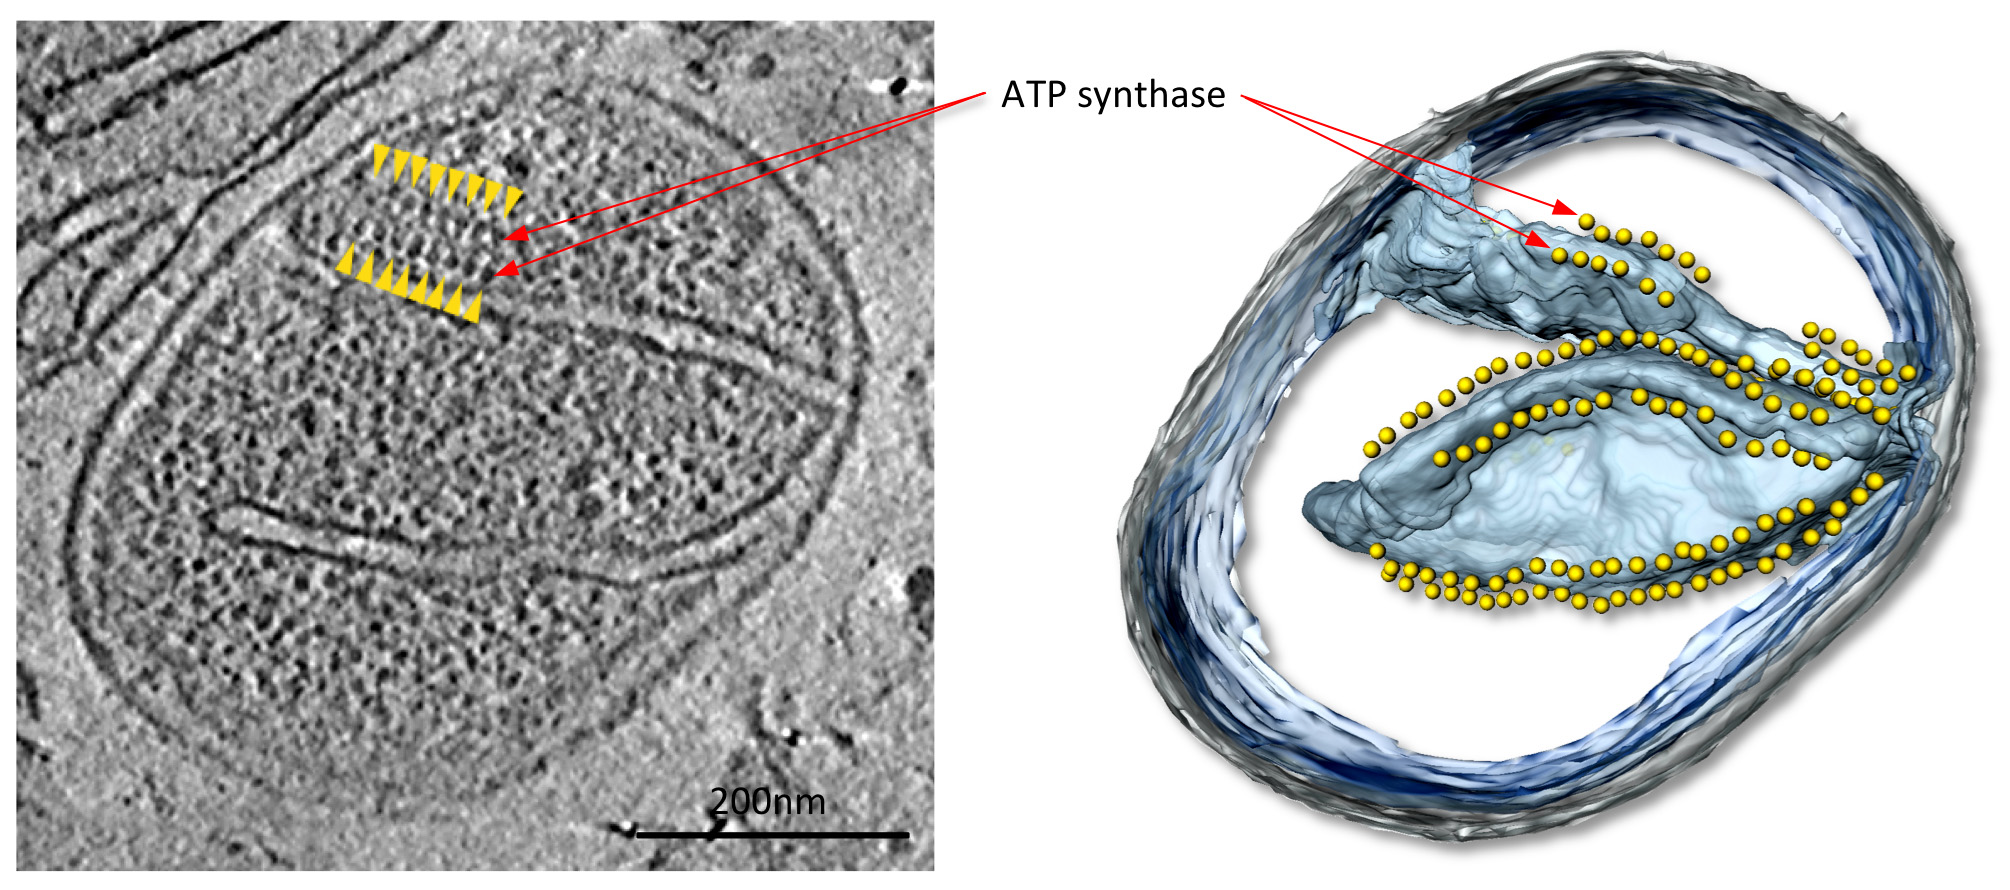
Figure 4. Mitochondrion from the fungus P. anserina. Slice through tomographic volume (left) and accompanying surface-rendered volume (right) of a mitochondrion from the filamentous fungus P. anserina. In this tomogram, rows of 10 nm particles (yellow arrowheads) are located above highly curved membrane ridges in the inner membrane cristae (see Movie 1). These particles were identified as ATP synthase dimers by subtomogram averaging. From Davies et al9. Click here to view larger image.

Figure 5
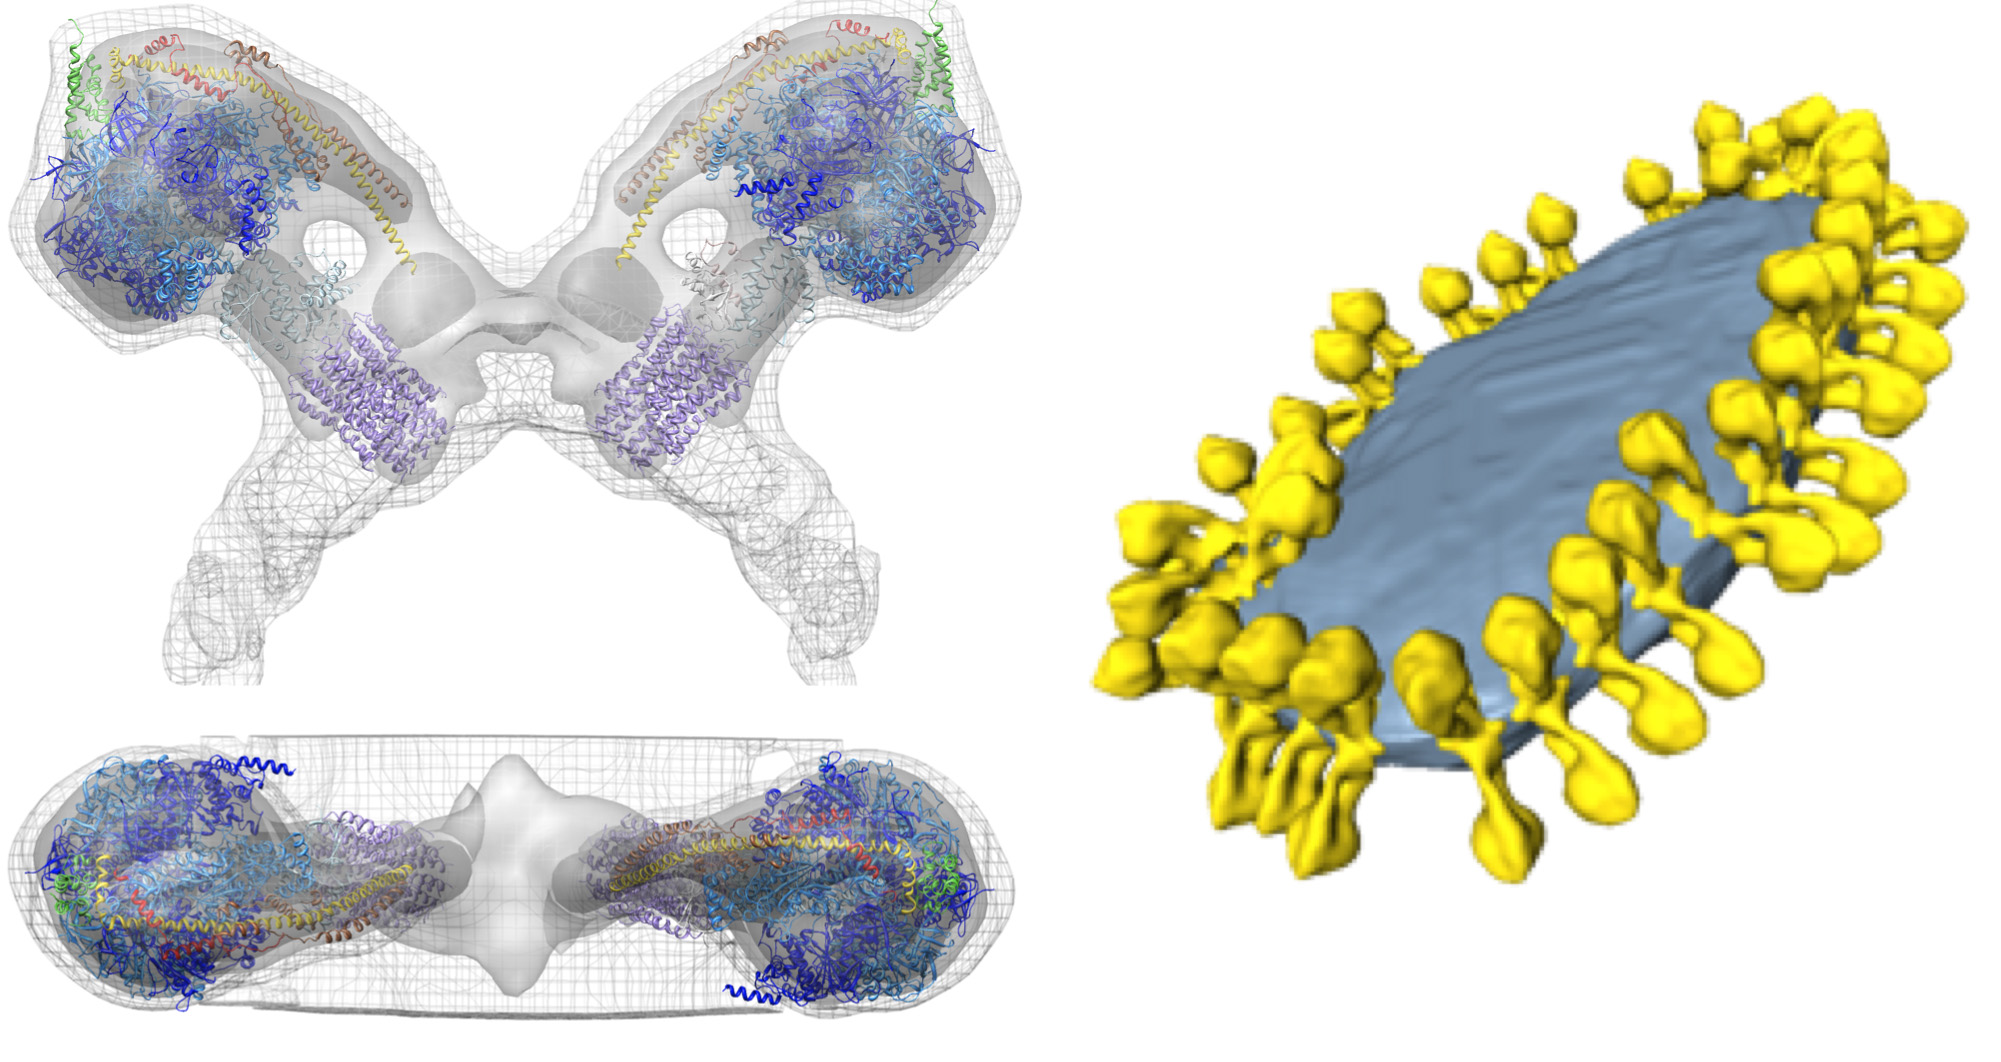
Figure 5. Structure and organization of the mitochondrial ATP synthase. Side and top view showing the electron density of an ATP synthase dimer from S. cerevisiae as determined by subtomogram averaging with fitted atomic models (left). Mitochondrial inner membrane vesicle showing the organization of ATP synthase dimers in rows (right). The figure was generated by positioning the subtomogram average of the ATP synthase dimer into the segmented volume of the membrane vesicle, using the coordinates calculated during averaging.  Adapted from Davies et al8. Atomic models: F1/rotor-ring [PDB:2WPD]39 (blue and purple); oligomycin sensitive conferring protein-OSCP [PDB:2BO5]40 (green); peripheral stalk fragment [PDB:2CLY]1 with N-terminal residues from [PDB:2WSS]2 (yellow and red) (see Movie 2). Click here to view larger image.

Figure 6
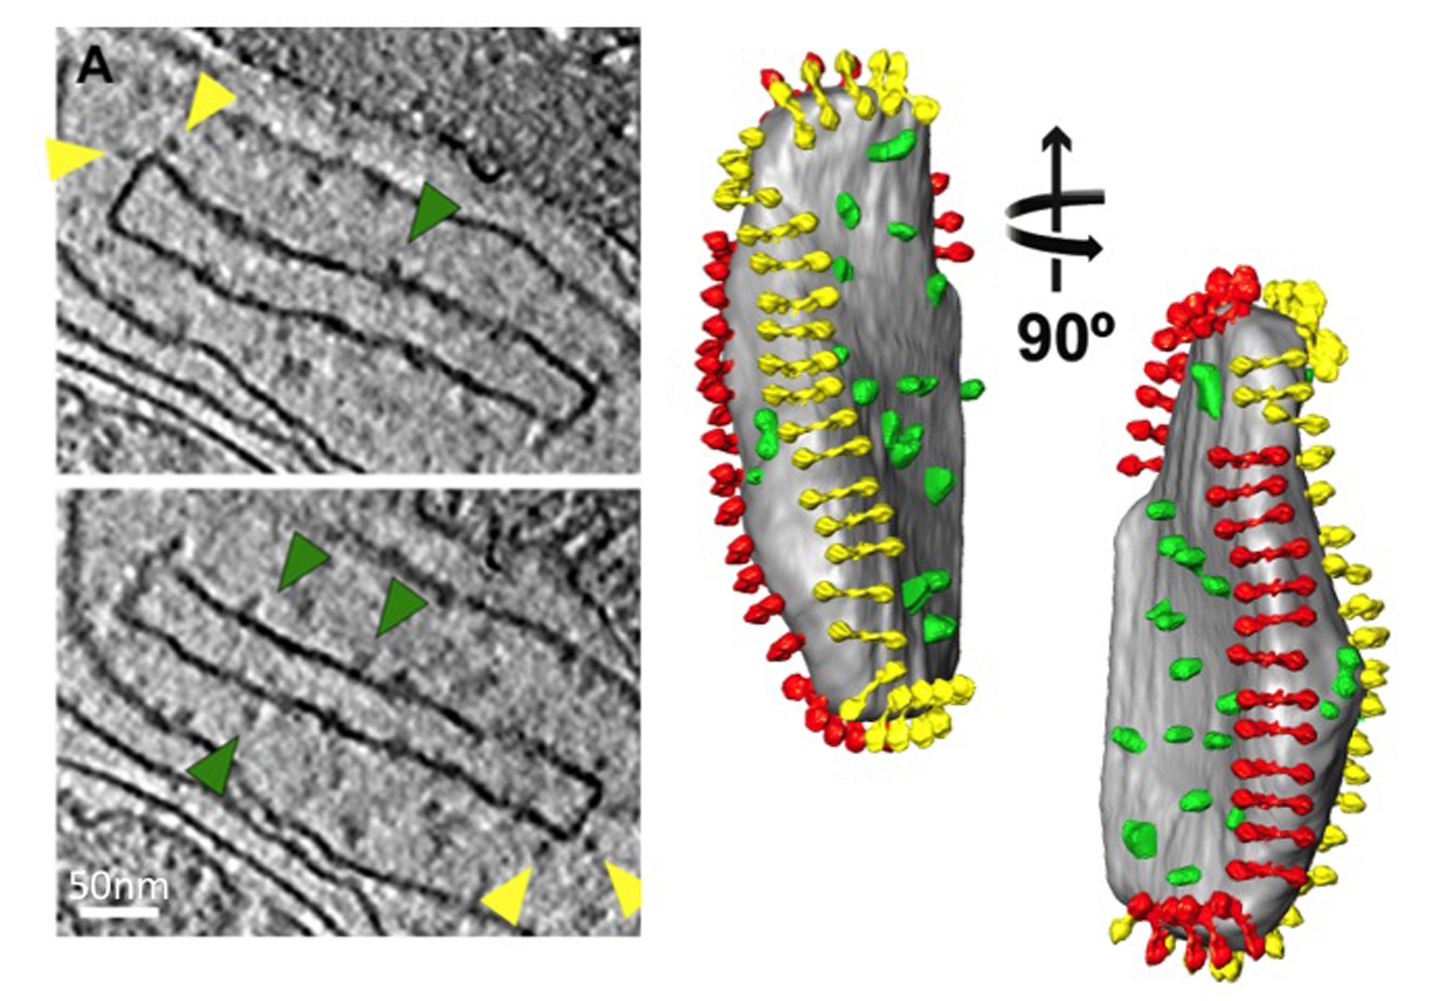
Figure 6. Isolated crista vesicle from a P. anserina mitochondrion. Slices from a tomographic volume (left) and accompanying surface-rendered volume (right) of a crista vesicle from P. anserina. Protein densities protruding from the membrane are clearly visible. The densities indicated by yellow arrowheads are ATP synthase dimers, as identified by subtomogram averaging. Green arrowheads point to densities identified by antibody labeling as NADH dehydrogenase (complex 1; for details see9). Segmentation of the protein densities reveals their organization in the cristae, with the ATP synthase dimers (red and yellow) forming rows along the highly curved cristae ridges and the NADH dehydrogenase complexes (green) in the membrane regions on either side of the rows (see Movie 3).  From Davies et al9. Click here to view larger image.

Movie 1. Electron cryo-tomogram of a P. anserina mitochondrion. The movie shows successive slices through a tomographic volume taken of a mitochondrion from the filamentous fungus P. anserina. Rows of ATP synthase are indicated by yellow arrowheads. The surface-rendered, segmented volume shows the location of ATP synthase (yellow spheres) in relation to the 3D cristae structure. Outer membrane, grey; inner boundary membrane, transparent blue; cristae membranes, opaque blue. From Davies et al9. See also Figure 4. Click here to view video.

Movie 2. Subtomogram average of the mitochondrial ATP synthase dimer from S. cerevisiae with fitted atomic models. The average was calculated from 121 subvolumes. The density is displayed at three contour levels: 1s - mesh, 2s - light grey and 3s - dark grey. Atomic models were fitted into the density using the sequential fit routine in Chimera. Atomic models: F1/rotor-ring [PDB:2WPD]39 (blue and purple); oligomycin sensitive conferring protein-OSCP [PDB:2BO5]40 (green); peripheral stalk fragment [PDB:2CLY]1 with N-terminal residues from [PDB:2WSS]2 (yellow and red). Click here to view video.

Adapted from Davies et al8. See also Figure 5.

Movie 3. Isolated cristae vesicle from a P. anserina mitochondrion. Successive slices through the tomographic volume are shown, followed by the segmented surface-rendered volume. Protein densities protruding from the membrane are clearly visible. Red and yellow densities are ATP synthase dimers. Green densities are NADH dehydrogenase (complex I) as determined by antibody labeling. From Davies et al9. See also Figure 6. Click here to view video.

Discussion

The protocol presented here provides an introduction to cryo-ET and subtomogram averaging of mitochondria, but essentially the same procedure can be applied to any other cell compartment or membrane. To obtain the best possible data, critical steps during the procedure are sample preparation, the plunge freezing process and data acquisition strategy. Sample quality, which is critical for success, depends on an optimized freezing protocol to ensure suitable ice thickness, which is of paramount importance for good image contrast. The optimal data acquisition strategy depends on the instrument and sample. Parameters to be optimized include electron dose per image, tilt scheme and defocus. Acquiring a good tomogram of a good sample makes all further processing steps easier and ensures a satisfactory end result.

Cryo-ET combined with subtomogram averaging and atomic model fitting provides details of how protein complexes are arranged in their native cellular environment. The technique is equally suited for investigating the structure of large membrane protein complexes, such as respiratory chain supercomplexes (1.7 MDa), ATP synthase dimers (2x500 kDa), or the nuclear pore complex (~120 MDa)8,9,17. The organization of ATP synthase dimers into rows cannot be observed by high-resolution techniques such as X-ray crystallography, NMR or single-particle cryo-EM, because the dimer rows are disrupted by detergent extraction, which is a necessary step in the isolation and purification of membrane protein complexes.

The arrangement of the ATP synthase in rows of dimers along cristae ridges is a universal organizing principle of mitochondria in all species. The proton-pumping complexes of the electron transport chain, in particular complex I (NADH dehydrogenase), are located in the membrane areas either side of the rows8,9. This organization of the respiratory chain has profound impact on mitochondrial bioenergetics. If the dimer rows cannot form due to the absence of dimer-specific protein subunits, the cells exhibit longer generation times and reduced cellular fitness, as observed in the yeast mutant shown in Figure 341. With the growing interest in mitochondrial diseases, a detailed understanding of the molecular basis governing mitochondrial ultrastructure and function is of paramount importance. Electron cryo-tomography provides a link between protein structure determined by high-resolution methods, and the distribution and arrangement of these proteins in the membrane on the scale of nanometers. This makes cryo-ET an essential tool for understanding mitochondrial structure and function in health and disease.

Further technical developments and improvements in cryo-ET include protein-labeling strategies to identify the position of protein subunits in macromolecular complexes or the location of smaller or less distinct proteins (<0.5 MDa) in cells. In addition, hybrid EM processing methods, which combine subtomogram averaging with single particle analysis or helical reconstruction have recently determined protein structures to ~8 Å42,43. These processing methods are currently restricted to purified proteins, which are well separated in ice or form helical assemblies and are currently not applicable to crowded cellular environments like mitochondria and cristae membranes. For data collection, new computing and hardware tools are being developed to enable automated tomogram acquisition, increase image contrast and reduce total required electron dose. The only fundamental limitation in cryo-ET is radiation damage to the sample by the electron beam. This means that only very low electron doses can be used to record each image of a tomographic tilt series, resulting in poor signal-to-noise ratio that ultimately limits the achievable resolution. The new direct electron detectors, released less than a year ago, are currently revolutionizing the field of single-particle cryo-EM44,45. These new detectors provide higher contrast and better resolution at lower electron doses. For electron cryo-tomography, this means that tilt series with smaller step sizes or even dual axis tomograms can be collected without concerns about excessive radiation damage (one CCD image is equivalent in electron dose to 5 direct electron detector images). The vast amounts of data produced by these detectors create their own challenges in data handling, processing and storage, which will have to be overcome.

In addition, phase plates, which work on similar principles as those used routinely in light microscopy to enhance phase contrast, are currently being developed for transmission electron microscopy46,47. This should allow tomograms to be collected closer to focus and therefore at higher resolution, while at the same time preserving low-resolution features necessary for alignment and interpretation of tomographic volumes. Taken together, these technological advances will greatly expand the range of biological questions that can be addressed by cryo-ET.

Disclosures

The authors declare that they have no competing financial interests.

Acknowledgments

This work was supported by the Max Planck Society (K.M.D., B.D., A.W.M., T.B., T.B.B., D.J.M., and W.K.), the Cluster of Excellence Frankfurt “Macromolecular Complexes” funded by the Deutsche Forschungsgemeinschaft (W.K.) and a postdoctoral EMBO Long-Term Fellowship (V.A.M.G.).

Materials

Name Company Catalog Number Comments
Sucrose Roth 4621.2
Trehalose Sigma-Aldrich T9449
HEPES Sigma-Aldrich H3375
Zymolase biomol Z1000.1
Density gradient medium Sigma-Aldrich D1556 or P1644
Protein A gold Aurion 810.111 10 nm
Ethane Air Liquide P0502S02R0A001
Nitrogen Air Liquide I4150RG
Consumables
Filter paper Whatman, GE Healthcare 1004 090 Nr 4
Tweezers Dumont T506 Non-magnetic, pattern #5
EM combined test grid Plano GmbH S142 grapite and gold islands on holey carbon film
Holey carbon grids Quantifoil Micro Tools GmbH or C-flat R2/2 300 Cu mesh
Cryo grid boxes Plano GmbH 160-42 Alternative home-made metal boxes
Potter Sigma-Aldrich P7984
Blender Waring 8011S
Glass bead mill - bead beater BioSpec Products 1107900-105 Including 0.5 mm beads
Ball-bearing (Balch) homogeniser isobiotec H8
Centrifuge Thermo Scientific 46915 Sorvall RC6+
Glow-discharge apparatus Bal-Tec A.G. CTA 010
Grid vitrification device FEI, Gatan or Leica Alternative home-made plunger
Transmission electron microscope FEI or Jeol 300 keV
Direct electron detector Gatan K2 summit 4k x 4k pixels, counted mode
Charge coupled device (CCD) Gatan US4000 4k x 4k pixels (alternative to Direct electron detector)
Energy filter Gatan or Jeol
Software
Image acquisition software Gatan
Tomogram acquisition software Gatan, FEI, USCF, or UC-Boulder 4 alternatives
Tomogram processing software FEI, UCSF or UC-Boulder 3 alternatives
Subtomogram averaging software UC-Boulder, or University of Basel 2 alternatives
Tomogram visualization software UC-Boulder, FEI, or University of Utah 3 alternatives
Visualization software plugin Goethe university http://www.biophys.uni-frankfurt.de/frangakis/
Structure visualization software UCSF http://www.cgl.ucsf.edu/chimera/
Numerical calculation software MathWorks http://www.mathworks.de/academia/

DOWNLOAD MATERIALS LIST

References

  1. Dickson, V. K., Silvester, J. A., Fearnley, I. M., Leslie, A. G., Walker, J. E. On the structure of the stator of the mitochondrial ATP synthase. The EMBO journal. 25, 2911-2918 (2006).
  2. Rees, D. M., Leslie, A. G., Walker, J. E. The structure of the membrane extrinsic region of bovine ATP synthase. Proceedings of the National Academy of Sciences of the United States of America. 106, 21597-21601 (2009).
  3. Watt, I. N., Montgomery, M. G., Runswick, M. J., Leslie, A. G., Walker, J. E. Bioenergetic cost of making an adenosine triphosphate molecule in animal mitochondria. Proceedings of the National Academy of Sciences of the United States of America. 107, 16823-16827 (2010).
  4. Baker, L. A., Watt, I. N., Runswick, M. J., Walker, J. E., Rubinstein, J. L. Arrangement of subunits in intact mammalian mitochondrial ATP synthase determined by cryo-EM. Proceedings of the National Academy of Sciences of the United States of America. 109, 11675-11680 (2012).
  5. Allen, R. D., Schroeder, C. C., Fok, A. K. An investigation of mitochondrial inner membranes by rapid-freeze deep-etch techniques. The Journal of cell biology. 108, 2233-2240 (1989).
  6. Strauss, M., Hofhaus, G., Schroder, R. R., Kühlbrandt, W. Dimer ribbons of ATP synthase shape the inner mitochondrial membrane. The EMBO journal. 27, 1154-1160 (2008).
  7. Dudkina, N. V., Oostergetel, G. T., Lewejohann, D., Braun, H. P., Boekema, E. J. Row-like organization of ATP synthase in intact mitochondria determined by cryo-electron tomography. Biochimica et biophysica acta. 1797, 272-277 (2010).
  8. Davies, K. M., Anselmi, C., Wittig, I., Faraldo-Gomez, J. D., Kühlbrandt, W. Structure of the yeast F1Fo-ATP synthase dimer and its role in shaping the mitochondrial cristae. Proceedings of the National Academy of Sciences of the United States of America. 109, 13602-13607 (2012).
  9. Davies, K. M., et al. Macromolecular organization of ATP synthase and complex I in whole mitochondria. Proceedings of the National Academy of Sciences of the United States of America. 108, 14121-14126 (2011).
  10. Wurm, C. A., et al. Nanoscale distribution of mitochondrial import receptor Tom20 is adjusted to cellular conditions and exhibits an inner-cellular gradient. Proceedings of the National Academy of Sciences of the United States of America. 108, 13546-13551 (2011).
  11. Schermelleh, L., Heintzmann, R., Leonhardt, H. A guide to super-resolution fluorescence microscopy. The Journal of cell biology. 190, 165-175 (2010).
  12. Austin, J. R. 2nd, Staehelin, L. A. Three-dimensional architecture of grana and stroma thylakoids of higher plants as determined by electron tomography. Plant physiology. 155, 1601-1611 (2011).
  13. Ohta, K., et al. Beam deceleration for block-face scanning electron microscopy of embedded biological tissue. Micron. 43, 612-620 (2012).
  14. Buzhynskyy, N., Sens, P., Prima, V., Sturgis, J. N., Scheuring, S. Rows of ATP synthase dimers in native mitochondrial inner membranes. Biophysical journal. 93, 2870-2876 (2007).
  15. Larabell, C. A., Nugent, K. A. Imaging cellular architecture with X-rays. Current opinion in structural biology. 20, 623-631 (2010).
  16. Miao, J., Hodgson, K. O., Sayre, D. An approach to three-dimensional structures of biomolecules by using single-molecule diffraction images. Proceedings of the National Academy of Sciences of the United States of America. 98, 6641-6645 (2001).
  17. Maimon, T., Elad, N., Dahan, I., Medalia, O. The human nuclear pore complex as revealed by cryo-electron tomography. Structure. 20, 998-1006 (2012).
  18. Meyerson, J. R., et al. Determination of molecular structures of HIV envelope glycoproteins using cryo-electron tomography and automated sub-tomogram averaging. Journal of visualized experiments : JoVE. (58), (2011).
  19. Chen, S., et al. Electron cryotomography of bacterial cells. Journal of visualized experiments : JoVE. (39), (2010).
  20. Bharat, T. A., et al. Structural dissection of Ebola virus and its assembly determinants using cryo-electron tomography. Proceedings of the National Academy of Sciences of the United States of America. 109, 4275-4280 (2012).
  21. Bennett, A. E., et al. Ion-abrasion scanning electron microscopy reveals surface-connected tubular conduits in HIV-infected macrophages. PLoS pathogens. 5, e1000591 (2009).
  22. Liu, J., et al. Cellular architecture of Treponema pallidum: novel flagellum, periplasmic cone, and cell envelope as revealed by cryo electron tomography. Journal of molecular biology. 403, 546-561 (2010).
  23. Liu, J., et al. Intact flagellar motor of Borrelia burgdorferi revealed by cryo-electron tomography: evidence for stator ring curvature and rotor/C-ring assembly flexion. Journal of bacteriology. 191, 5026-5036 (2009).
  24. Patla, I., et al. Dissecting the molecular architecture of integrin adhesion sites by cryo-electron tomography. Nature cell biology. 12, 909-915 (2010).
  25. Heuser, T., et al. Cryoelectron tomography reveals doublet-specific structures and unique interactions in the I1 dynein. Proceedings of the National Academy of Sciences of the United States of America. 109, E2067-E2076 (2012).
  26. Briggs, J. A. Structural biology in situ-the potential of subtomogram averaging. Current opinion in structural biology. 23, (2013).
  27. Cheng, D., Mitchell, D. R. G., Shieh, D. B., Braet, F. Current Microscopy Contributions to Advances in Science and Technology. Méndez-Vilas, A. 2, Formatex. (2012).
  28. Brust, D., et al. Cyclophilin D links programmed cell death and organismal aging in Podospora anserina. Aging cell. 9, 761-775 (2010).
  29. Gregg, C., Kyryakov, P., Titorenko, V. I. Purification of mitochondria from yeast cells. Journal of visualized experiments : JoVE. (30), (2009).
  30. Bhaskaran, S., et al. Breaking Caenorhabditis elegans the easy way using the Balch homogenizer: an old tool for a new application. Analytical biochemistry. 413, 123-132 (2011).
  31. Pavlov, P. F., Rudhe, C., Bhushan, S., Glaser, E. In vitro and in vivo protein import into plant mitochondria. Methods in molecular biology. 372, 297-314 (2007).
  32. Graham, J. M., et al. Ch. 3, Current protocols in cell biology. Bonifacino, J. S. , John Wiley and Sons. (2001).
  33. Zheng, S. Q., et al. UCSF tomography: an integrated software suite for real-time electron microscopic tomographic data collection, alignment, and reconstruction. Journal of structural biology. 157, 138-147 (2007).
  34. Mastronarde, D. N. Automated electron microscope tomography using robust prediction of specimen movements. Journal of structural biology. 152, 36-51 (2005).
  35. Kremer, J. R., Mastronarde, D. N., McIntosh, J. R. Computer visualization of three-dimensional image data using IMOD. Journal of structural biology. 116, 71-76 (1996).
  36. Pruggnaller, S., Mayr, M., Frangakis, A. S. A visualization and segmentation toolbox for electron microscopy. Journal of structural biology. 164, 161-165 (2008).
  37. Scheres, S. H., Chen, S. Prevention of overfitting in cryo-EM structure determination. Nature methods. 9, 853-854 (2012).
  38. Pettersen, E. F., et al. UCSF Chimera--a visualization system for exploratory research and analysis. Journal of computational chemistry. 25, 1605-1612 (2004).
  39. Dautant, A., Velours, J., Giraud, M. F. Crystal structure of the Mg.ADP-inhibited state of the yeast F1c10-ATP synthase. The Journal of biological chemistry. 285, 29502-29510 (2010).
  40. Carbajo, R. J., et al. Structure of the F1-binding domain of the stator of bovine F1Fo-ATPase and how it binds an alpha-subunit. Journal of molecular biology. 351, 824-838 (2005).
  41. Paumard, P., et al. The ATP synthase is involved in generating mitochondrial cristae morphology. The EMBO journal. 21, 221-230 (2002).
  42. Bharat, T. A., et al. Structure of the immature retroviral capsid at 8 A resolution by cryo-electron microscopy. Nature. 487, 385-389 (2012).
  43. Bartesaghi, A., Lecumberry, F., Sapiro, G., Subramaniam, S. Protein secondary structure determination by constrained single-particle cryo-electron tomography. Structure. 20, 2003-2013 (2012).
  44. Bai, X. C., Fernandez, I. S., McMullan, G., Scheres, S. H. Ribosome structures to near-atomic resolution from thirty thousand cryo-EM particles. eLife. 2, e00461 (2013).
  45. Li, X., et al. Electron counting and beam-induced motion correction enable near-atomic-resolution single-particle cryo-EM. Nature methods. , (2013).
  46. Danev, R., Nagayama, K. Optimizing the phase shift and the cut-on periodicity of phase plates for TEM. Ultramicroscopy. 111, 1305-1315 (2011).
  47. Walter, A., et al. Practical aspects of Boersch phase contrast electron microscopy of biological specimens. Ultramicroscopy. 116, 62-72 (2012).

Tags

Electron Cryo-tomography ATP Synthase Dimers Mitochondria Structural Biology Three-dimensional Structure Biological Samples Liquid Ethane Frozen-hydrated State Electron Microscope Tilt Series 3D Tomograms Subtomogram Averaging Noise Reduction 3D Maps Resolution Atomic Models Protein Complexes Native Environment Membrane Protein Complexes Inner Membrane Cristae
Visualization of ATP Synthase Dimers in Mitochondria by Electron Cryo-tomography
Play Video
PDF DOI DOWNLOAD MATERIALS LIST

Cite this Article

Davies, K. M., Daum, B., Gold, V. A. More

Davies, K. M., Daum, B., Gold, V. A. M., Mühleip, A. W., Brandt, T., Blum, T. B., Mills, D. J., Kühlbrandt, W. Visualization of ATP Synthase Dimers in Mitochondria by Electron Cryo-tomography. J. Vis. Exp. (91), e51228, doi:10.3791/51228 (2014).

Less
Copy Citation Download Citation Reprints and Permissions
View Video

Get cutting-edge science videos from JoVE sent straight to your inbox every month.

Waiting X
Simple Hit Counter