Several methods are available for measuring intracellular pH but very few of these allow simultaneous measurement of cytoplasmic and organellar pH. Here, we describe in detail a rapid and accurate methodology to simultaneously measure cytoplasmic and vesicular pH by ratiometric imaging of living cells.
Intracellular pH is tightly regulated and differences in pH between the cytoplasm and organelles have been reported1. Regulation of cellular pH is crucial for homeostatic control of physiological processes that include: protein, DNA and RNA synthesis, vesicular trafficking, cell growth and cell division. Alterations in cellular pH homeostasis can lead to detrimental functional changes and promote progression of various diseases2. Various methods are available for measuring intracellular pH but very few of these allow simultaneous measurement of pH in the cytoplasm and in organelles. Here, we describe in detail a rapid and accurate method for the simultaneous measurement of cytoplasmic and organellar pH by using confocal microscopy on living cells3. This goal is achieved with the use of two pH-sensing ratiometric dyes that possess selective cellular compartment partitioning. For instance, SNARF-1 is compartmentalized inside the cytoplasm whereas HPTS is compartmentalized inside endosomal/lysosomal organelles. Although HPTS is commonly used as a cytoplasmic pH indicator, this dye can specifically label vesicles along the endosomal-lysosomal pathway after being taken up by pinocytosis3,4. Using these pH-sensing probes, it is possible to simultaneously measure pH within the endocytic and cytoplasmic compartments. The optimal excitation wavelength of HPTS varies depending on the pH while for SNARF-1, it is the optimal emission wavelength that varies. Following loading with SNARF-1 and HPTS, cells are cultured in different pH-calibrated solutions to construct a pH standard curve for each probe. Cell imaging by confocal microscopy allows elimination of artifacts and background noise. Because of the spectral properties of HPTS, this probe is better suited for measurement of the mildly acidic endosomal compartment or to demonstrate alkalinization of the endosomal/lysosomal organelles. This method simplifies data analysis, improves accuracy of pH measurements and can be used to address fundamental questions related to pH modulation during cell responses to external challenges.
1. Preparation of Solutions for Cellular pH Calibration
2. Cell Preparation
3. Preparation of pH-sensing Probes
4. Cell Labeling
5. Addition of pH Modulators
6. Specifications of the Live-cell Imaging Microscope and Acquisition Settings
NOTE: A 40X objective is useful to observe several cells simultaneously and works well for organelle viewing. However, spatial resolution and signal intensity are better achieved using a 60X oil objective. In addition, there is no excitation or emission cross-talk between the two dyes.
7. Calibration of pH-sensing Probes
8. Data Acquisition
9. Data Analysis
For the simultaneous measurement of pH in both intracellular and endosomal/lysosomal cell compartments, the ratiometric fluorescent pH-sensing probes SNARF-1 and HPTS were used. SNARF-1 is restricted to the cytosolic compartment whereas HPTS allows ratiometric pH measurement of the endosomal/lysosomal compartment. Cell loading with HPTS for 16 hr allows its selective localization in endosomes/lysosomes4. A typical example of fluorescence recorded from HT-1080 cells loaded with the pH-sensing probes is shown in Figure 2A. Evidence that HPTS labels both endosomal and lysosomal compartments was obtained by co-staining with Alexa 546-conjugated transferrin (endosomes) or a fluorescent lysotrophic probe (Lysotracker Deep Reddye). Data clearly showed that HPTS stained both compartments Figure 2A.
Using the methodology described above, intracellular pH values in living cells were determined using a calibration curve for each probe Figures 2B and 2C, based on the ratiometric properties of each pH-sensitive dye. The five calibration solutions were used to convert fluorescence intensities to pH units. Data from three independent calibrations are reported for each pH-sensing probe Figure 2C. Each data point represents a ratio of fluorescence intensity at excitation wavelengths of 458/405 nm for HPTS or emission wavelengths of 644/584 nm for SNARF-1 at a given pH. The calibration curves for both probes showed a non-linear relationship that was best fitted with an exponential equation Figure 2C. The efficiency of the method for detecting cellular compartment-associated pH changes was evaluated in live HT-1080 cells using NH4Cl, a weak base that increases intracellular pH, bafilomycin A1, a pharmacological inhibitor of V-ATPases and EIPA, a NHE-1 inhibitor. NH4Cl triggered intravesicular and cytosolic pH increases from 6.35 to 7.10 and from 7.00 to 7.40, respectively Figures 3A and 3B. Bafilomycin A1 induced alkalinization of the endosomal and lysosomal compartments without altering cytosolic pH. In contrast, EIPA induced acidification of the cytosol reaching a pH value of 6.62 as compared to 7.00 in untreated cells Figures 3A and 3B.
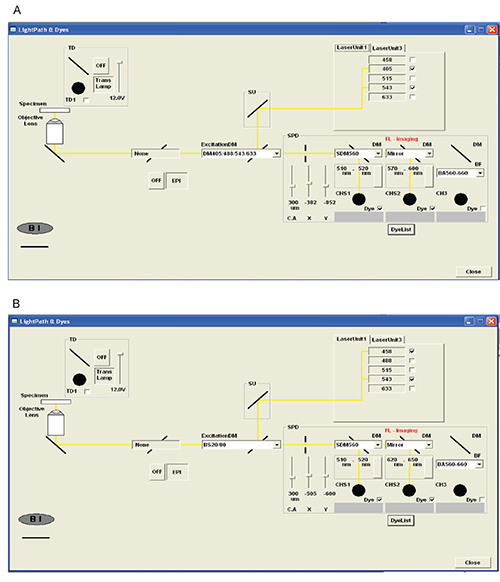
Figure 1. Diagrams of acquisition settings for the confocal laser scanning microscope. (A) The first phase is set to excite HPTS at 405 nm and SNARF-1 at 543 nm simultaneously through a dichroic (DM405/488/543/633) mirror. Fluorescence emission is first recorded for HPTS at 505-525 nm using a dichroic mirror (SDM560). Fluorescence emission of SNARF-1 is then monitored through a bandpass interference filter in the range of 570-600 nm. (B) The second phase is set to simultaneously collect fluorescence emission of HPTS (exc, 458 nm) and SNARF-1 (exc, 543 nm). Probe excitation generated by the laser beam passes through a beam splitter (BS20/80) and fluorescence emission for each probe is collected through the dichroic mirrors used in the first phase. Please click here to view a larger version of this figure.
Figure 2. In situ calibration of pH-sensing probes. (A) Representative images of HPTS and SNARF-1 sub-cellular localization in HT-1080 fibrosarcoma cells. Upper images show that SNARF-1 labels the cytoplasm whereas HPTS-associated fluorescence shows intravesicular localization. HT-1080 cells were incubated for 30 min with Alexa 546-conjugated transferrin (5 μg/ml) or a lysotrophic dye (Lysotracker Deep Reddye) (100 nM), respectively. Lower images show that HPTS colocalizes with transferrin and the lysotrophic dye (60X). (B) Representative images of both pH-sensing probes in cells incubated for 15 min with calibration solutions at pH 6.0 and pH 7.5. (C) Relationship of fluorescence intensity ratios for HPTS and SNARF-1 determined using the calibration solutions as a function of pH. Please click here to view a larger version of this figure.
Figure 3. Modulation of intracellular pH by bafilomycin A1, EIPA and NH4Cl. Pharmacological inhibitors (bafilomycin A1, EIPA) and the intracellular pH modulator NH4Cl were used to validate the methodology. Graphs show pH values recorded in the endosomal/lysosomal compartment (A) or the cytoplasm (B) of HT-1080 cells loaded with HPTS and SNARF-1 and incubated for 30 min in the presence or absence (control) of NH4Cl (20 mM), EIPA (25 μM) or bafilomycin A1 (100 nM). Data are represented as the mean + SEM (** p 0.005, *** p 0.0001).
Quantitative pH measurement in live-cell imaging of different cellular compartments is needed to accurately measure pH variations in cell responses to external challenges. However, one of the major hurdles that remains is to easily and specifically target cellular compartments. In this respect, a few studies have highlighted the use of HPTS as an intracellular pH indicator introduced into cells by electroporation or microinjection8-10. These techniques suffer from serious drawbacks, namely electroporation causes extensive damages to cells, and microinjection requires special equipment and technical skills. Of interest, Hinton et al., have previously reported that HPTS can be taken up by cells by a process of pinocytosis and that the combination of SNARF-1 and HPTS can be used to monitor the pH of the cytosol and endosomal/lysosomal compartments3. We have used this property to record pH variations in the lysosomal/endosomal compartment of live HT-1080 cells. Evidence that HPTS was located in this compartment and, therefore, could serve as a reliable pH indicator was obtained by co-staining with fluorophore-conjugated transferrin, a marker of the lysosomal/endosomal compartment, or with an acidophilic dye that mostly labels lysosomes Figure 2. In addition, the use of different intracellular pH modulators targeting distinct cellular compartments indicated that bafilomycin A1 specifically increased intravesicular pH without altering cytoplasmic pH. In contrast, EIPA mainly altered cytosolic pH but had little or no effect on endosomal and lysosomal pH while ammonium chloride affected pH of both compartments. These results provided evidence that SNARF-1 and HPTS could be used to simultaneously monitor pH changes in these two different cellular compartments.
One important feature of the method described here is the use of confocal laser scanning microscopy. Most studies reported in the literature on intracellular pH measurements have been done by spectrofluorometry. Although easy to use and providing rapid data acquisition, this approach does not allow observation of cells during the experiment. This drawback may become of significance since it has been our experience that during the calibration step, extended incubation under acidic (pH 5.5) or alkaline (pH 8.0) conditions may adversely affect various cell types and trigger apoptosis. In the case of HT-1080 cells, apoptosis leads to red autofluorescence, thus interfering with the pH-dependent fluorescence of SNARF-1 (data not shown). To circumvent this problem, we have used a separate culture dish for each calibration and discarded experiments where signs of apoptosis or other cell alterations were observed. The use of the confocal microscope for pH measurements also makes analysis of data easier. For instance, analysis of confocal fluorescence microscopy images can be used to discard artifacts, apoptotic cells and background noise, making calculations easier and more accurate.
Although the method described here offers many advantages over other approaches, it has some limitations. One of these is related to the different loading conditions required for each probe. With respect to HPTS, the dye has to be taken up by pinocytosis. This restriction requires that cells must be maintained for an extended period of time (e.g. 12 hr) in a serum-supplemented medium to promote pinocytosis and thereby labeling of the endocytic compartment. In contrast, cell-permeant SNARF-1 needs to be incubated in a serum-free medium to prevent the possibility of acetoxymethyl ester (AM) hydrolysis by serum-containing non-specific esterases. These restrictions will exclude experimental protocols that require loading-incompatible cell culture conditions. In addition, the sensitivity of HPTS to acidic medium is an important limitation. As shown in Figure 2, fluorescence intensities of HPTS excited at 458 nM show minimal variation at pH 6.0 or lower, with ratios close to background values. This intrinsic property of HPTS ought to be taken into account in the case of studies of very acidic cellular compartments such as lysosomes that have pH values as low as 4.0 to 5.0. However, to our knowledge, HPTS is the only available ratiometric dye that can be used to measure intraendosomal pH. For example, the commonly used lysosensor dye will mostly partition within the more acidic lysosomal compartment. The extent of partition of this dye within the endosomal compartment will depend on pH values within these vesicles, which is a major drawback when measuring intravesicular pH in cells where endosomal pH homeostasis is altered.
In conclusion, we describe herein an approach to simultaneously measure cytosolic and endosomal pH values in single cells. This is especially important for the study of pH homeostasis in cells where mutations or drugs can affect efflux and influx of protons in endosomes.
The authors have nothing to disclose.
We thank Dr. Gilles Dupuis for critical reading of the manuscript.
Funding
This work was supported by the Canadian Institutes for Health Research, grant # MOP-126173. C.M.D is a member of the Fonds de la Recherche en Santé (FRSQ)-funded Centre de Recherche Clinique Étienne LeBel.
Solutions for calibration | |||
Sodium chloride | Fischer | L-11621 | |
Potassium chloride | Fischer | M-12445 | |
D-Glucose (dextrose) | Fischer | D16-1 | |
Magnesium sulfate | Fischer | M65-500 | |
HEPES | Sigma-Aldrich | H3375 | |
Calcium chloride dihydrate | Fischer | M-1612 | |
Deionized water | N/A | N/A | |
Nigericin | Calbiochem | 481990 | Toxic by inhalation or in contact with skin |
Keep protected from the light at 4°C | |||
Culture dishes ∅ 35mm | BD Biosciences | 354456 | |
pH-sensing probes | |||
8-Hydroxypyrene-1,3,6-trisulfonic acid (HPTS) | Life technologies | H-348 | Keep away from the light at room temperature |
5-(and-6)-Carboxy SNARF®-1, Acetoxymethyl Ester, Acetate | Life technologies | C-1271 | Keep away from the light and humidity at -20°C |
Dimethyl Sufoxide (DMSO) | Fischer | BP231-1 | Harmful |
Phosphate buffered saline (PBS) 100X | |||
Potassium chloride | Fischer | M-12445 | 20 g |
Sodium phosphate monobasic | Fischer | S369-1 | 115 g |
Potassium phosphate monobasic | J.T Baker | 3246-01 | 20 g |
Deionized water | N/A | N/A | Bring to 1 L |
Autoclave and adjust pH to 7.4 | |||
Phosphate buffered saline (PBS) 1X | |||
PBS 100X | N/A | N/A | 50 mL |
Sodium chloride | Fischer | L-11621 | 40,5 g |
Deoinized water | N/A | N/A | Bring to 5 L |
pH modulators | |||
Bafilomycin A1 | Sigma-Aldrich | B-1793 | |
5-(N-Ethyl-N-isopropyl)amiloride (EIPA) | Sigma-Aldrich | A3085 | |
Ammonium chloride | Fischer | A649-500 |