The goal of this article is to provide a standardized approach to induce human hepatic progenitor differentiation from pluripotent stem cells. The development of this procedure with ready-to-use media formulations offer the user a facile system to generate human liver cells for biomedical research and translation.
Method Article
Hepatic Progenitor Specification from Pluripotent Stem Cells using a Defined Differentiation System
In This Article
Summary
Abstract
Liver disease is an escalating global health issue. While liver transplantation is an effective mode of therapy, patient mortality has increased due to shortages in donor organ availability. Organ scarcity also affects the routine supply of human hepatocytes for basic research and the clinic. Therefore, the development of renewable sources of human liver progenitor cells is desirable and is the goal of this study. To be able to effectively generate and deploy human liver progenitors on a large scale, a reproducible hepatic progenitor differentiation system was developed. This protocol aids experimental reproducibility between users in a range of cell cultureware formats and permits differentiations using both, human embryonic and induced pluripotent stem cell lines. These are important advantages over current differentiation systems that will enhance the basic research and may pave the way towards clinical product development.
Introduction
Liver disease represents a global health challenge, causing approximately 2 million deaths per year worldwide1. Although a number of model systems exist to study hepatic diseases and intervene clinically, the routine use of cell-based systems is limited by significant drawbacks (for a review see Szkolnicka et al.2). Advanced human pluripotent stem cell (hPSC) culture and somatic cell differentiation methods represent promising technologies to develop tools for basic biomedical research and renewable sources of differentiated cells for the clinic3,4.
To date, multiple protocols for hepatocyte-like cell (HLC) differentiation have been developed5,6,7,8. These protocols attempt to recreate aspects of human liver development by using a combination of small molecules and growth factors9,10. Most protocols consist of a stepwise differentiation process, where hPSCs are primed to definitive endoderm, followed by hepatic progenitor specification11,12,13, and ending with HLC specification. HLCs produced by these protocols display a mixture of fetal and adult phenotypes. This includes the expression of alpha fetoprotein (AFP), such as hepatocyte markers such as HNF4α and albumin (ALB), as well as drug metabolizing capacity14,15,16. Between laboratories, HLC differentiation can vary; therefore, the development of standardized protocols is necessary. This will enable researchers to effectively generate and apply stem cell-derived HLCs on a large scale for basic and clinical research.
A hepatic progenitor differentiation system was developed that can be applied to both human embryonic and induced pluripotent stem cell lines using easy-to-follow guidelines. This procedure yields homogenous populations of hepatic progenitors in varying cultureware formats, ranging from cell culture flasks to 96 well plates. Provided below is the protocol to produce stem cell-derived hepatic progenitors in 24 and 96 well formats.
Cell density used in the protocol presented below is specified for one well of a 24 and 96 well plate respectively (see Table 1). Optimization of the starting cell number is required for the different cell culture plate formats and cell lines. Suggested starting cell density for protocol optimization is 2 x 10⁵ cells/cm2. For density optimization, several cell densities can be tested by adding ± 50,000 cells/cm2 at a time.
Protocol
1. Human pluripotent stem cell (hPSC) maintenance on laminin-521
- Maintain human pluripotent cells (hPSCs) at 37 °C and 5% CO2 in a 6 well plate on laminin-521 (LN-521). Feed the cells daily with 2 mL of stem cell maintenance medium (i.e., mTeSR1 medium) per well of a 6 well plate up to the chosen seeding day for differentiation (day 0).
- Ensure that the desired cell confluency of 70–80% is achieved prior to cell harvesting.
2. Laminin-521 multiwell preparation and hPSC seeding for differentiation
NOTE: For hPSCs not maintained on LN-521 (e.g., matrigel or fibronectin), split hPSCs onto LN-521 and culture for 1 week prior to passaging and eliciting differentiation to improve the efficiency of the process15,17,18.
- Laminin-coated plate preparation
- Thaw a vial of recombinant LN-521 (100 μg/mL) at 4 °C for 2 h or overnight.
- Prepare an 8 μg/mL solution by diluting the thawed LN-521 in ice-cold 1x DPBS with Ca2+/Mg2+.
- Add 0.25 mL of the 8 μg/mL LN-521 solution to each well of a 24 well plate or 0.05 mL to each well of a 96 well plate. Rock the plate gently from side to side to evenly coat the wells with the LN-521 solution.
NOTE: For the 96 well plate format, volume dispensing, cell seeding, and medium changes can be performed using a semi-automated pipeline. For details see Meseguer-Ripolles et al.19. - Seal the LN-521 coated plates with a semi-transparent, flexible film and store at 4 °C overnight prior to use.
NOTE: LN-521 coated plates can be used for up to 2 weeks when stored at 4 °C. Avoid any drying of the laminin-coated wells.
- On the day of the cell seeding, warm up the precoated plates in a cell culture incubator at 37 °C for 30–60 min.
- Aspirate the LN-521 solution.
NOTE: Avoid direct contact of the aspirator with the bottom of the well to prevent damage to the LN-521 coating. - Dispense 0.5 mL of stem cell maintenance medium with freshly supplemented 10 µM Rho-associated kinase (ROCK) inhibitor Y27632 to each well of a 24 well plate or 0.05 mL to each well of a 96 well plate. Place the plate in the incubator until ready for cell seeding.
- On the scheduled seeding day (day 0) and with an hPSC confluency between 70–80%, mark any regions of spontaneous differentiation on the bottom of the wells of the 6 well plate.
NOTE: Spontaneous differentiation can be visualized by a gross change in the cell size and/or the presence of different cell morphologies using phase contrast microscopy. - Aspirate and discard the marked regions of differentiation and the spent medium from the wells. Wash each well with 1 mL of DPBS without Ca2+/Mg2+ at room temperature (RT).
- Add 1 mL of enzyme-free dissociation reagent (see Table of Materials) to each well and incubate at 37 °C for 8–10 min until cells visibly detach from the plate.
- Use a cell scraper to gently detach the cells from the wells. Pipette the contents of each well up and down 2–4x with a P1000 pipette to yield a single-cell suspension. For each cell line, pool cells from all maintenance wells into a sterile 50 mL tube.
- Wash each emptied well with 1 mL of the stem cell maintenance medium. Add the washes to the corresponding tube containing the pooled cells from the appropriate cell line.
- For each cell line, perform three viable cell counts on the pooled samples. Calculate the average live cell count (live cells/mL) for each cell line.
- Centrifuge the pooled samples at 250 x g for 5 min at RT. Aspirate the supernatant, then resuspend the cell pellet in 1–3 mL of RT stem cell maintenance medium, freshly supplemented with 10 μM ROCK inhibitor Y27632.
- For each cell line, calculate the cell number needed per the number of wells prepared at step 2.4 (see Table 1). Resuspend the required cell number with stem cell maintenance medium freshly supplemented with 10 μM ROCK inhibitor Y27632.
- Add the calculated volume(s) into the wells of the prepared and precoated plates from step 2.4 without removing the volume added previously. The total volume per well will be 1 mL for a 24 well plate and 0.1 mL for a 96 well plate. Gently rock the plates from side to side and back and forth to ensure even cell dispersion throughout the well.
NOTE: An even cell distribution across the well is key to ensure homogenous cell seeding and successful differentiation. - Place the seeded plates into the incubator and immediately rock the seeded plates gently back and forth and from side to side to evenly distribute the cells and maintain cultures at 37 °C and 5% CO2.
3. Differentiating hPSCs to hepatic progenitors on laminin-521
- Prepare media for definitive endoderm induction (stage 1) using the Endoderm Basal Medium supplemented with the correct additives.
- On day 0, thaw the bottle of the Endoderm Basal Medium overnight at 4 °C.
- Prepare Stage 1 Medium 1 (for use on day 1) as needed.
- Thaw Supplement MR and Supplement CJ on ice.
- Dilute Supplement MR and Supplement CJ 1:100 in the Endoderm Basal Medium.
- Prepare Stage 1 Medium 2 for use on days 2–4 as needed.
- Dilute Supplement CJ 1:100 in the Endoderm Basal Medium.
- Prepare media for the subsequent hepatic progenitor cell specification (Stage 2) differentiation using the Hepatic Progenitor Medium.
- On day 4, thaw the bottle of the Hepatic Progenitor Medium overnight at 4 °C.
NOTE: 1% penicillin/streptomycin (final concentrations of 100 IU/mL and 100 μg/mL, respectively) was used for this experiment. Antibiotics are not required; antibiotic use is at user discretion.
- On day 4, thaw the bottle of the Hepatic Progenitor Medium overnight at 4 °C.
- On day 1 of the differentiation, remove the spent stem cell maintenance medium with 10 μM ROCKi Y-27632 medium from the wells and replace with 0.5 mL of complete Stage 1 Medium 1 per well of a 24 well plate and 0.1 mL per well of a 96 well plate.
- On days 2, 3, and 4, remove the spent medium and feed each well with 0.5 mL of Stage 1 Medium 2 per well for a 24 well plate or 0.1 mL per well of a 96 well plate.
- On day 5, fix the wells for definitive endoderm differentiation analysis via immunocytochemistry. For the remaining wells, remove the spent medium and feed each well with 0.5 mL of Hepatic Progenitor Differentiation Medium per well for a 24 well plate or 0.1 mL per well of a 96 well plate. Refresh the medium again on days 6, 7, and 9.
- On day 10, harvest wells for hepatic progenitor differentiation analysis or proceed with further hepatocyte-like cell differentiation.
NOTE: At this time point, samples were either fixed with 4% paraformaldehyde (PFA) for immunocytochemistry analysis or supernatant was collected for ELISA and cells were collected for protein quantification.
4. Characterization of the hepatic progenitor differentiation cultures generated from hPSCs on laminin-521
- On day 5, detect expression of definitive endoderm-specific markers using immunostaining.
- On day 10, detect expression of hepatic progenitor-specific markers using immunostaining.
- On day 10, measure AFP and ALB secretion via ELISA using a kit following manufacturer’s instructions and normalize per mg protein as determined by a bicinchoninic acid (BCA) protein assay.
- Assess the hepatic progenitor variability of the 96 well plate by quantifying of the percentage of HNF4α positive cells per well.
5. Immunocytochemistry and image acquisition
- On days 5 and 10 of the differentiation, wash cells 3x with 1x DPBS, with 0.5 mL per well of a 24 well plate and 0.1 mL per well of a 96 well plate. Incubate the plate with gentle shaking for 2–5 min at RT.
NOTE: Use DPSB without Ca2+/Mg2+ for immunocytochemistry. - Fix the cells with 4% paraformaldehyde (PFA) at RT for 15–30 min by adding 0.3 mL of PFA per well for a 24 well plate and 0.1 mL per well of a 96 well plate.
- Wash 3x with 1x DPBS as described in step 5.1.
- Permeabilize the membrane with PBST using 0.1% Tween, 1x DPBS and incubate for 20 min at RT by adding 0.3 mL of PBST per well of a 24 well plate and 0.1 mL per well of a 96 well plate.
- Perform the protein block by incubating the cells with 10% BSA in PBST for 1 h, adding 0.3 mL of BSA per well of a 24 well plate and 0.1 mL of BSA per well of a 96 well plate, gently shaking using a plate shaker.
- After protein blocking, replace the blocking solution with the primary antibody diluted in 1% BSA in PBST and incubate at 4 °C with gentle shaking overnight.
NOTE: Do not wash between protein block and antibody addition. - After 24 h, wash wells 3x with PBST.
- Add the secondary antibody in 1% BSA in PBST. Incubate 1 h at RT in the dark with gentle shaking.
- After secondary antibody incubation, wash wells 3x with 1x DPBS and dispense Hoechst stain according to the manufacturer’s instructions for 10 min at RT in the dark with gentle shaking.
- Wash 3x with 1x DPBS. The plates are now ready for imaging.
NOTE: Store plates at 4 °C in the dark until imaging. - Image the multiwell plate using a high-content imaging microscope after immunohistochemistry. Image acquisition of several fields of view is recommended to obtain a true representation of the well. The expression of the different markers was assessed via cell segmentation analysis using commercial software (see Table of Materials) (Figure 1).
NOTE: Cell segmentation can also be performed using an image analysis open-source software such as CellProfiler or Fiji20,21.
Results
Hepatic progenitor differentiation from both hESC (H9) and hiPSC (P106) lines was performed following the stepwise protocol described in Figure 2. Here, pluripotent stem cells were seeded as single cells into LN-521-coated plates prior to the start of the differentiation. Cell confluency is the key for a robust and reproducible differentiation. Once the right confluency was achieved (Figure 2), differentiation was initiated. At day 5, definitive endoderm specification was assessed via Sox17 expression. In both cell lines, Sox17 was highly expressed with 80% ± 0.5% and 87.8% ± 0.5% SEM of Sox17-positive cells for H9 and P106, respectively (Figure 3). At day 10, hepatic progenitors displayed a cobblestone-like morphology (Figure 2). In addition, hepatic progenitor specification was assessed for HNF4α, AFP, ALB, and cytokeratin-19 (CK19) expression as well as AFP and ALB protein secretion10,15,22 (Figure 4). Both H9 and P106 hepatic progenitor cultures expressed fetal hepatic markers such as HNF4α (91% ± 0.5% and 90% ± 0.2%), AFP (89.7% ± 1.8% and 86% ± 1.2%), and CK19 (78.5% ± 3.2% and 83.6 ± 1.8%) (Figure 4). AFP secretion was detected at day 10 in both cell lines (32.4 ± 1.6 and 47.8 ± 5.9 ng/mL/mg/24 h) (Figure 5). Albumin synthesis was observed at lower levels (30.7% ± 1.8% and 27.2% ± 1.1%) (Figure 4) and was not detected via ELISA (Figure 5).
The protocol allowed the standardized production of hepatic progenitors from 24 well to 96 well plates. A semi-automated pipeline was employed to produce 96 well plates of hepatic progenitors from H9 and P106 cell lines as previously described17. Cell number variability and hepatic progenitor differentiation efficiency was assessed via quantification of HNF4α expression. Cell segmentation was performed for protein quantification via immunofluorescence using a high content imaging instrument (Figure 1). At day 10, hepatic progenitors showed no significant variability across rows with >94% of HNF4α-positive cells per well for H9 and 97% HNF4α-positive cells for P106 (Figure 6).
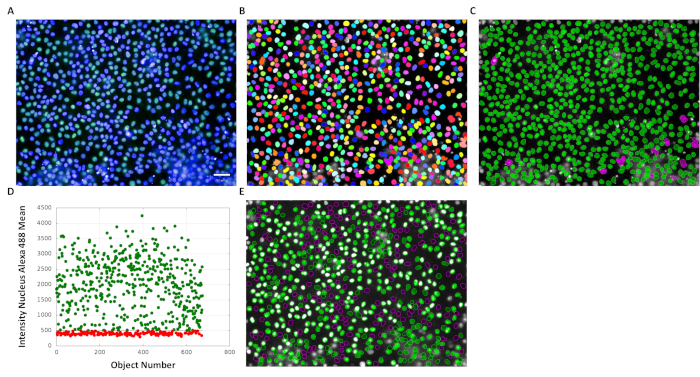
Figure 1: Cell segmentation pipeline overview. (A) Using the original image, (B) nuclear staining was used for nuclei segmentation. (C) A nuclear segmentation quality control step based on shape and size was performed to only quantify clearly segmented nuclei. (D) Following this, positive HNF4α-stained nuclei were quantified. (E) Finally, an intensity-based threshold was employed to identify HNF4α-expressing cells. In C and E, green nuclei represent selected cells and magenta nuclei indicate discarded cells. Scale bar = 50 µm. Please click here to view a larger version of this figure.
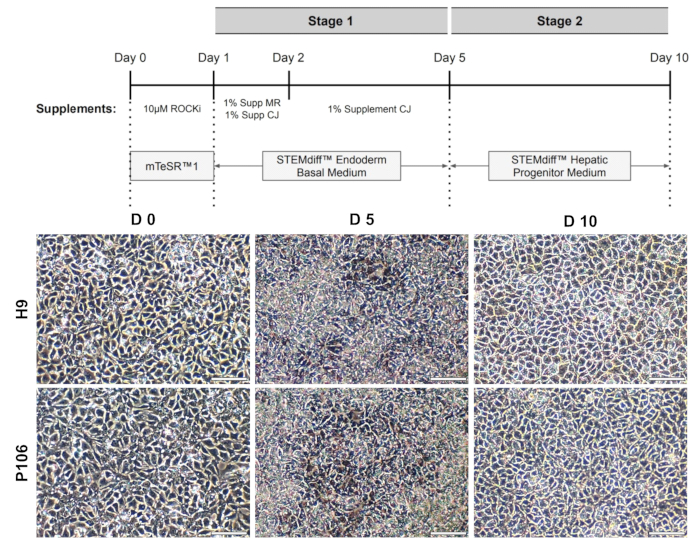
Figure 2: Hepatic progenitor differentiation from hPSCs. (A) Schematic representation of the hepatic progenitor differentiation protocol. (B) Representative images highlighting the morphological changes during the differentiation. At day 0 (D0), hPSCs presented a packed monolayer of cells. Following this, hPSCs were primed into definitive endoderm on day 5 (D5). This was followed by hepatic progenitor differentiation on day 10 (D10). Hepatic progenitors displayed a cobblestone-like cell morphology. Scale bar = 75 µm. Please click here to view a larger version of this figure.
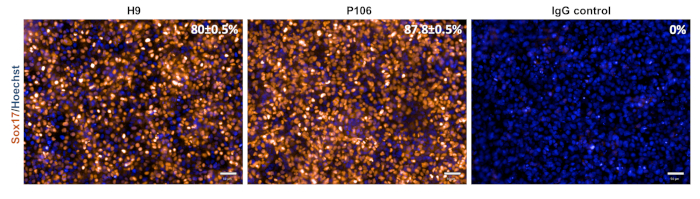
Figure 3: Characterization of definitive endoderm specification. At day 5, cells were stained for Sox17, a definitive endoderm marker. The percentage of Sox17-positive cells was 80 ± 0.5% for H9 and 87.8 ± 0.5% for P106. Percentage quantification was based on 10 separate wells with 6 fields of view per well. Data are shown as the average ± SEM. Scale bar = 50 µm. Please click here to view a larger version of this figure.
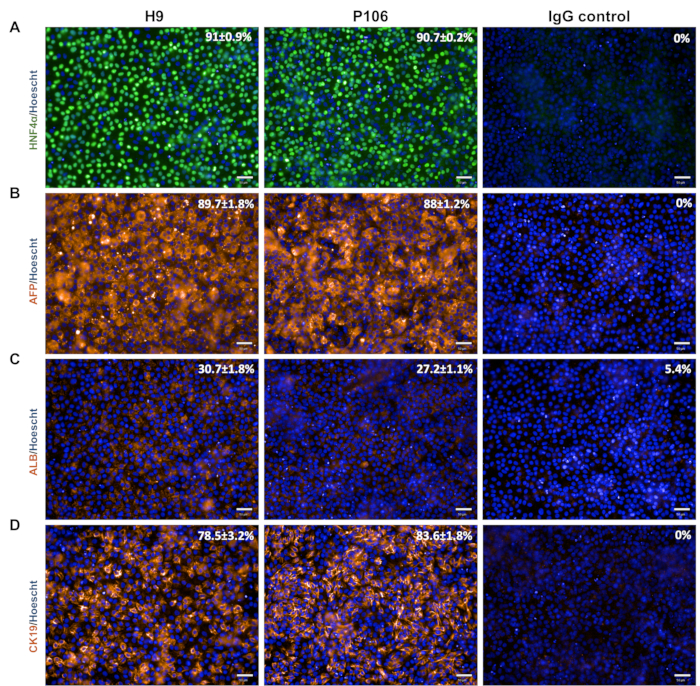
Figure 4: Hepatic progenitor characterization. At day 10, hepatic progenitors were stained for hepatic markers (A) HNF4α, (B) AFP, and (C) ALB. For H9, the percentage of positive cells were 91% ± 0.4%, 89.7% ± 1.8%, and 30.7% ± 1.8% for HNF4α, AFP, and ALB, respectively. For P106, the percentage of positive cells were 90% ± 0.2%, 86% +/- 1.2%, and 27.2% ± 1.1% for HNF4α, AFP, and ALB, respectively. (D) Cholangiocyte lineage potential was assessed via CK19 expression; H9-derived hepatic progenitors expressed 78.5% ± 3.2% CK19-positive cells, whereas 83.6% ± 1.8% of CK19-positive cells were observed for P106 hepatic progenitors. Immunoglobulin G (IgG) staining was used as a staining control. Percentage quantification was based on 10 separate wells with 6 fields of view per well. Data are shown as the average ± SEM. Scale bar = 50 µm. Please click here to view a larger version of this figure.
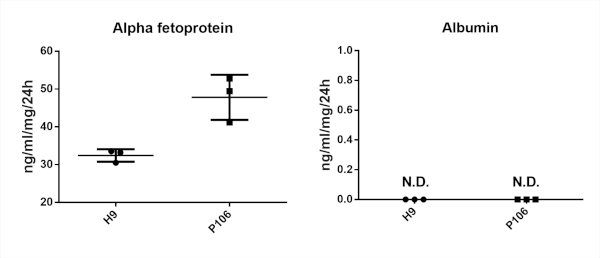
Figure 5: Hepatic progenitor protein secretion analysis. The secretion of alpha fetoprotein (AFP) and albumin (ALB) was analyzed in hepatic progenitor cultures at day 10 in H9 and P109. The data represent three biological replicates and the error bars represent the SD. Secreted proteins were quantified from 24 h culture medium as nanograms of secreted protein per mL per mg of protein, n = 3; ND = not detected. Please click here to view a larger version of this figure.
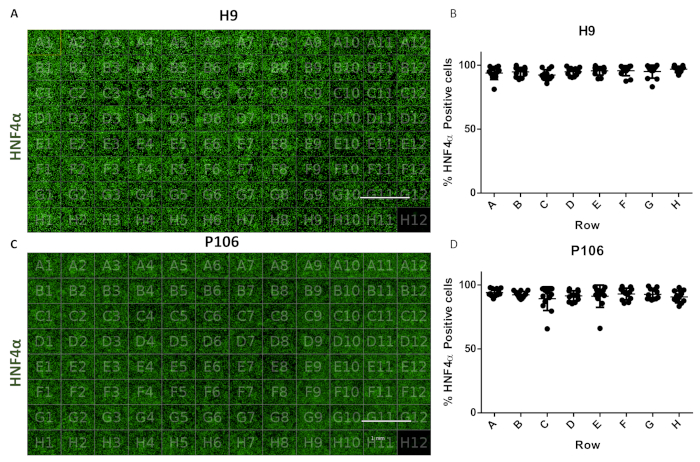
Figure 6: Assessment of well-to-well variability in 96 well plate. (A) Visualization of a 96 well plate view of H9-derived hepatic progenitors stained with HNF4α. (B) Quantification of the HNF4α-positive cells. Average of cell number per well in rows, from six fields of view per well quantified. The average cell number across the plate was 94.81% ± 0.22 SEM HNF4α-positive cells per well. No statistically significant differences were observed between wells. (C) Visualization of a 96 well plate view of P106-derived hepatic progenitors stained with HNF4α. (D) Quantification of HNF4α-positive cells. The average cell number per wells in rows, from six fields of view per well and quantified. The average cell number across the plate was 97.7% ± 0.57 SEM HNF4α-positive cells per well. No statistically significant differences were observed between rows. Well H12 was used as an Immunoglobulin G (IgG) staining control. Scale bar = 1 mm. One-way ANOVA with Tukey's post-hoc statistical tests were employed. Please click here to view a larger version of this figure.
| Plate format | Surface area (cm2) | Cells per cm2 | Total cells per well | Dispensing volume (mL) | Cell concentration (cells/ml) |
| 24-well plate | 1.9 | 210526 | 400000 | 0.5 | 800000 |
| 96-well plate | 0.32 | 187500 | 60000 | 0.05 | 1200000 |
Table 1: Recommended cell density for the different plate formats for the hPSC cell lines used in this protocol.
Discussion
The generation of human hepatic progenitor cells from pluripotent stem cells on a large scale could represent a promising alternative to cadaver-derived material. Protocol standardization and reproducibility are key to ensure technology translation and impact for biomedical research. To address this, previous work has focused on developing a stepwise differentiation protocol from hESC and iPSCs using defined additives and matrices15,23,24,25,26,27,28. By doing this, hepatocyte phenotype and reproducibility have been improved, permitting the semi-automation of the differentiation process19. The system presented is strengthened by its combination with off-the-shelf cell culture media and a facile hepatocyte differentiation system.
Previously, pluripotent cell density prior to the start of the differentiation protocol was highlighted as a key variable to achieve a homogenous population of hepatic progenitor cells26. Using this more refined procedure, it is possible to generate large numbers of stem cell-derived hepatic progenitors in a stepwise manner using a range of starting cell densities (Table 1). At day 5, definitive endoderm induction was validated by Sox17 staining (Figure 3). Efficient and robust differentiation into definitive endoderm was achieved with both tested ESC and iPSC lines, with more than 80% expressing Sox17 (Figure 3). At day 10, hepatic progenitors displayed a uniform cobblestone-like morphology, and liver stem cell markers were highly enriched for both AFP and HNF4α (>86%, Figure 4). Using a combination of manual and semi-automated technologies it was possible to perform differentiation in multiple plate formats19.
In its current form, cell differentiation is suitable for in vitro based experimentation. However, cell enrichment would likely be required before clinical application to ensure that a homogenous population of hepatic progenitors are prepared for delivery.
In conclusion, the protocol described here provides the field with a standardized approach to produce hepatic progenitors on a large scale. Future work will focus on the production of a new medium for subsequent HLC differentiation, maturation, and maintenance.
Disclosures
David C. Hay is a co-founder and shareholder of Stemnovate Ltd. The rest of the authors certify that they have no conflicts of interest in the subject matter or materials discussed in this article.
Acknowledgements
This study was supported with awards from the MRC Doctoral Training Partnership (MR/K501293/1), the UK Regenerative Medicine Platform (MRC MR/L022974/1 and MR/K026666/1), the Chief Scientist Office (TCS/16/37).
Materials
| Name | Company | Catalog Number | Comments |
|---|---|---|---|
| DPBS with Calcium and Magnesium | ThermoFisher | 14040133 | |
| Gentle cell dissociation reagent | STEMCELL Technologies | 7174 | |
| Hoechst 33342 Ready Flow Reagent | thermofisher | R37165 | |
| Human Recombinant Laminin 521 | BioLamina | LN521-02 | |
| Human Serum Albumin ELISA | Alpha Diagnostics | 1190 | |
| Human Serum Alpha Fetoprotein ELISA | Alpha Diagnostics | 500 | |
| mTeSR1 medium | STEMCELL Technologies | 5850 | |
| Operetta High-Content Imaging System | PerkinElmer | HH12000000 | |
| PBS, no calcium, no magnesium | ThermoFisher | 14190250 | |
| Penicillin-Streptomycin (10,000 U/mL) | Life Technologies | 15140122 | |
| Rho-associated kinase (ROCK)inhibitor Y27632 | Sigma-Aldrich | Y0503-1MG | |
| STEMdiff Definitive Endoderm Supplement CJ | STEMCELL Technologies | ||
| STEMdiff Definitive Endoderm Supplement MR | STEMCELL Technologies | ||
| STEMdiff Endoderm Basal Medium | STEMCELL Technologies | ||
| STEMdiff Hepatic Progenitor Medium | STEMCELL Technologies | ||
| TWEEN 20 | Sigma-Aldrich | P9416 | |
| Antibodies | |||
| Albumin | Sigma-Aldrich | A6684 | 1:200 (mouse) |
| Alpha-fetoprotein | Sigma-Aldrich | A8452 | 1:400 (mouse) |
| HNF-4α | Santa Cruz | sc-8987 | 1:400 (rabbit) |
| IgG | DAKO | 1:400 | |
| Sox17 | R&D Systems, Inc. | AF1924 | 1:200 (Goat) |
| Software | |||
| Columbus Image Data Storage and Analysis system | PerkinElmer |
References
- Asrani, S. K., Devarbhavi, H., Eaton, J., Kamath, P. S. Burden of liver diseases in the world. Journal of Hepatology. 70 (1), 151-171 (2019).
- Szkolnicka, D., Hay, D. C. Concise Review: Advances in Generating Hepatocytes from Pluripotent Stem Cells for Translational Medicine. Stem Cells Dayton Ohio. 34 (6), 1421-1426 (2016).
- Heslop, J. A., Duncan, S. A. The Use of Human Pluripotent Stem Cells for Modeling Liver Development and Disease. Hepatology. 69 (3), 1306-1316 (2019).
- Alwahsh, S. M., Rashidi, H., Hay, D. C. Liver cell therapy: is this the end of the beginning. Cell and Molecular Life Sciences. 75 (8), 1307-1324 (2018).
- Hay, D. C., et al. Efficient differentiation of hepatocytes from human embryonic stem cells exhibiting markers recapitulating liver development in vivo. Stem Cells Dayton Ohio. 26 (4), 894-902 (2008).
- Si-Tayeb, K., et al. Highly efficient generation of human hepatocyte-like cells from induced pluripotent stem cells. Hepatology. 51 (1), 297-305 (2010).
- Hannan, N. R. F., Segeritz, C. -P., Touboul, T., Vallier, L. Production of hepatocyte-like cells from human pluripotent stem cells. Nature Protocols. 8 (2), 430-437 (2013).
- Basma, H., et al. Differentiation and transplantation of human embryonic stem cell-derived hepatocytes. Gastroenterology. 136 (3), 990-999 (2009).
- Meseguer-Ripolles, J., Khetani, S. R., Blanco, J. G., Iredale, M., Hay, D. C. Pluripotent Stem Cell-Derived Human Tissue: Platforms to Evaluate Drug Metabolism and Safety. The AAPS Journal. 20 (1), 20(2017).
- Si-Tayeb, K., Lemaigre, F. P., Duncan, S. A. Organogenesis and development of the liver. Developmental Cell. 18 (2), 175-189 (2010).
- D'Amour, K. A., et al. Efficient differentiation of human embryonic stem cells to definitive endoderm. Nature Biotechnology. 23 (12), 1534-1541 (2005).
- Shin, D., et al. Bmp and Fgf signaling are essential for liver specification in zebrafish. Development Cambridge England. 134 (11), 2041-2050 (2007).
- DeLaForest, A., et al. HNF4A is essential for specification of hepatic progenitors from human pluripotent stem cells. Development Cambridge England. 138 (19), 4143-4153 (2011).
- Baxter, M., et al. Phenotypic and functional analyses show stem cell-derived hepatocyte-like cells better mimic fetal rather than adult hepatocytes. Journal of Hepatology. 62 (3), 581-589 (2015).
- Cameron, K., et al. Recombinant Laminins Drive the Differentiation and Self-Organization of hESC-Derived Hepatocytes. Stem Cell Reports. 5 (6), 1250-1262 (2015).
- Szkolnicka, D., et al. Reducing Hepatocyte Injury and Necrosis in Response to Paracetamol Using Noncoding RNAs. Stem Cells Translational Medicine. 5 (6), 764-772 (2016).
- Domogatskaya, A., Rodin, S., Boutaud, A., Tryggvason, K. Laminin-511 but Not -332, -111, or -411 Enables Mouse Embryonic Stem Cell Self-Renewal In Vitro. Stem Cells. 26 (11), 2800-2809 (2008).
- Kanninen, L. K., et al. Laminin-511 and laminin-521-based matrices for efficient hepatic specification of human pluripotent stem cells. Biomaterials. 103, 86-100 (2016).
- Meseguer-Ripolles, J., Lucendo-Villarin, B., Wang, Y., Hay, D. C. Semi-automated Production of Hepatocyte Like Cells from Pluripotent Stem Cells. Journal of Visualized Experiments. (137), e57995(2018).
- Carpenter, A. E., et al. CellProfiler: image analysis software for identifying and quantifying cell phenotypes. Genome Biology. 7, 100(2006).
- Schindelin, J., et al. Fiji: an open-source platform for biological-image analysis. Nature Methods. 9 (7), 676-682 (2012).
- Raven, A., et al. Cholangiocytes act as Facultative Liver Stem Cells during Impaired Hepatocyte Regeneration. Nature. 547 (7663), 350-354 (2017).
- Hay, D. C., et al. Unbiased screening of polymer libraries to define novel substrates for functional hepatocytes with inducible drug metabolism. Stem Cell Research. 6 (2), 92-102 (2011).
- Medine, C. N., et al. Developing High-Fidelity Hepatotoxicity Models from Pluripotent Stem Cells. Stem Cells Translational Medicine. 2 (7), 505-509 (2013).
- Szkolnicka, D., et al. Accurate prediction of drug-induced liver injury using stem cell-derived populations. Stem Cells Translational Medicine. 3 (2), 141-148 (2014).
- Wang, Y., et al. Defined and Scalable Generation of Hepatocyte-like Cells from Human Pluripotent Stem Cells. Journal of Visualized Experiments. (121), e55355(2017).
- Villarin, B. L., et al. Polymer Supported Directed Differentiation Reveals a Unique Gene Signature Predicting Stable Hepatocyte Performance. Advanced Healthcare Materials. 4 (12), 1820-1825 (2015).
- Wang, Y., et al. Multiomics Analyses of HNF4α Protein Domain Function during Human Pluripotent Stem Cell Differentiation. iScience. 16, 206-217 (2019).
Reprints and Permissions
