The use of photodegradable hydrogels to isolate bacterial cells by utilizing a high-resolution light pattering tool is reported. Essential experimental procedures, results, and advantages of the process are reviewed. The method enables rapid and inexpensive isolation of targeted bacteria showing rare or unique functions from heterogeneous communities or populations.
Method Article
Photodegradable Hydrogel Interfaces for Bacteria Screening, Selection, and Isolation
In This Article
Summary
Abstract
Biologists have long attempted to understand the relationship between phenotype and genotype. To better understand this connection, it is crucial to develop practical technologies that couple microscopic cell screening with cell isolation at high purity for downstream genetic analysis. Here, the use of photodegradable poly(ethylene glycol) hydrogels for screening and isolation of bacteria with unique growth phenotypes from heterogeneous cell populations is described. The method relies on encapsulating or entrapping cells with the hydrogel, followed by culture, microscopic screening, then use of a high-resolution light patterning tool for spatiotemporal control of hydrogel degradation and release of selected cells into a solution for retrieval. Applying different light patterns allows for control over the morphology of the extracted cell, and patterns such as rings or crosses can be used to retrieve cells with minimal direct UV light exposure to mitigate DNA damage to the isolates. Moreover, the light patterning tool delivers an adjustable light dose to achieve various degradation and cell release rates. It allows for degradation at high resolution, enabling cell retrieval with micron-scale spatial precision. Here, the use of this material to screen and retrieve bacteria from both bulk hydrogels and microfabricated lab-on-a-chip devices is demonstrated. The method is inexpensive, simple, and can be used for common and emerging applications in microbiology, including isolation of bacterial strains with rare growth profiles from mutant libraries and isolation of bacterial consortia with emergent phenotypes for genomic characterizations.
Introduction
Isolation of cells with unique behaviors from a complex and heterogeneous environment is fundamental for obtaining genetic information in biology1. In microbiology, the selection and isolation of rare or unique microbes after observation becomes important in many applications that require a connection between genomic information and observable phenotypic information. These applications include selecting phenotypically rare strains from mutant libraries2, selecting keystone microorganisms from complex microbial communities3,4, and selecting phenotypically rare but important bacteria from isogenic populations. Isolation of viable but nonculturable cells (VBNC) from a bacteria population is an important example of the latter, where cells with the VBNC phenotype are often hidden in bacteria populations at 1:102 to 1:105 ratios5,6. Due to the widespread difficulties in bacteria isolation, much remains unknown about many phenotypically rare microorganisms. These limitations emphasize the need for cell isolation techniques to first identify the target cell or cells from a mixture and then retrieve and isolate them for downstream molecular analysis7.
Some of the most commonly established methods of cell isolation include flow cytometry and fluorescent activated cell sorting (FACS)8, immunomagnetic separation9,10, and microfluidics11. While these isolation methods have high value, they also have drawbacks that limit their use. For example, FACS can provide routine microbial isolation at the single-cell level for follow-up genomic analysis3 but is often limited by its availability and expense, as well as downstream contamination issues11. Microfluidic-based approaches such as microfluidic flow cytometry have obtained much attention, which, compared to conventional flow cytometry, allows for a significant reduction in the sample volume required12. However, separation and retrieval of an individual or small collections of cells from microfluidic devices is often a challenging issue that typically requires a more complex setup and device design13. Many microfluidic-based approaches genetically characterize cells before they are input and observed in a device14, limiting the number of unique species observed when performing a functional screen. Given these limitations, further innovation of both methods and materials that are practical for cell screening and isolation is required for widespread use in many laboratories.
This paper presents a new, materials-based approach for bacteria screening and isolation. The method uses photodegradable hydrogels for cell encapsulation, culture, microscopic observation, and on-demand release and recovery of targeted bacteria with unique phenotypes. Hydrogels are designed to contain 10 nm mesh size, where each crosslink contains o-nitrobenzyl groups15. The material encapsulates or traps cells for observation while enabling the diffusion of nutrients and waste products to and from cells for culture. Exposing the material to a patterned 365 nm UV light source through an upright microscope enables local degradation of the hydrogel through photocleavage of o-nitrobenzyl groups16,17. Degradation triggers the selective release of cells for recovery for downstream analysis, including genomic and, potentially, proteomic and transcriptomic analysis. The experimental setup and protocol are relatively simple, inexpensive, and translational to microbiology laboratories. It requires only cell encapsulation through hydrogel formation, observation of captured cells with an upright brightfield and fluorescence microscope, and the illumination of cells of interest with a patterned UV light source for retrieval.
A key advantage of this materials-based approach to screening is its adaptability to different screening formats. In its most basic format, the material can be used for screening by encapsulating a heterogeneous cell collection in bulk hydrogels. Cells are then observed for the desired phenotype, and individual cells of interest are removed for genomic characterization. In more elaborate formats, the material can also be integrated into lab-on-a-chip devices to provide precise cell release and retrieval from desired areas of the device. Both formats are described here, and both have enabled recent novel microbial screening and selection applications17,18,19. The method is demonstrated here with model Gram-negative organisms (Escherichia coli, Agrobacterium tumefaciens) and a model Gram-positive organism (Bacillus subtilis) and has been readily extended to a variety of other bacteria.
Protocol
1. Bacterial strains and culture protocols
- Streak colonies of bacteria on agar plates supplemented with appropriate growth media. In this report, B. subtilis (strain 1A1135, Bacillus Genetic Stock Center) is cultured on ATGN (0.079 M KH2PO4, 0.015 M (NH4)2SO4, 0.6 mM MgSO4·7H2O, 0.06 mM CaCl2·2H2O, 0.0071 mM MnSO4·H2O, 0.125 M FeSO4·7H2O, 28 mM glucose, pH: 7 ± 0.2, 15 g/L agar) agar plates supplemented with 100 µg/mL spectinomycin and E. coli (strain 25922, ATCC) on ATGN agar plates supplemented with 100 µg/mL ampicillin.
NOTE: Prior reports of hydrogel encapsulation and release with these materials from Fattahi et al.19 instead used A. tumefaciens C58 cells - Pick desired colonies from ATGN agar plates and start overnight cultures. For E. coli and B. subtilis strains used here, culture at 37 °C while shaking at 215 rpm in ATGN liquid medium for 24 h. Store the cell cultures in 50% glycerol at -80 °C until future use.
- Pick colonies of both strains from glycerol stocks using sterile inoculation loops and incubate in ATGN liquid media for 24 h at 37 °C and 215 rpm.
2. Preparation of the material needed for hydrogel formation
- Photodegradable PEG-o-NB-diacrylate synthesis
NOTE: The in-house synthesis of the PEG-o-NB-diacrylate has been well-described and previously reported16,17. Alternatively, because the synthesis is routine, it can be outsourced from a chemical synthesis facility. - Crosslinking buffer
- Take the recipe of the selected medium for the bacterial strain and prepare media with 2x nutrients. Add phosphate, e.g., NaH2PO4, to the medium to a final concentration of 100 mM. Then, adjust the pH value to 8 using 5 M NaOH (aq).
- Sterilize the buffer solution and store it at -20 °C until further use.
NOTE: Leave out any transition metals present in the media, as these metals catalyze the oxidation of the thiols to disulfides.
- PEG-o-NB-diacrylate solution
- For each mg of the aliquot PEG-o-NB-diacrylate (3,400 Da molecular weight) powder, add 3.08 µL of ultrapure water to reach 49 mM concentration of PEG-o-NB-diacrylate (98 mM acrylate concentration).
- Vortex the solution until it is well mixed and store this solution at -20 °C until further use.
- 4-arm PEG-thiol solution
- For 4-arm PEG-thiol (10,000 Da molecular weight) preparation, add 4 µL of ultrapure water per mg powder to reach a 20 mM concentration (80 mM of thiol concentration).
- Vortex this solution until it is well-mixed and store this solution at -20 °C until further use.
3. Preparation of perfluoroalkylated (non-reactive) coverslips
- Place up to 5 glass slides (25 mm x 75 mm x 1 mm) inside a polypropylene slide mailer. Sonicate the slides with a 2% (w/v) detergent solution (Table of Materials) for 20 min.
- Rinse the slides three times with ultrapure water, then sonicate the slides in water for 20 min. Dry the slides using a stream of N2.
- Plasma clean (see Table of Materials) on both sides of the glass slides according to the protocol in section 4.1 for 2 min.
- Place the plasma cleaned slides back into the slide mailer and fill the container with a 0.5% (v/v) solution of trichloro(1H, 1H, 2H, 2H,-perfluorooctyl)silane in toluene. Allow these glass slides to be functionalized for 3 h at room temperature (RT).
- After the slides are functionalized, rinse the slides within the slide mailer, first with toluene and next ethanol (three times with each solvent). Next, dry each functionalized slide with a stream of N2.
4. Preparation of thiol functionalized (base) coverslips
- Cleaning of the glass coverslips using a plasma cleaner
- Place 18 mm x 18 mm coverslips in a Petri dish. Then, place the Petri dish in a plasma cleaner chamber and switch on the power of the plasma cleaner.
- Turn the vacuum pump on to clear the air within the chamber until the pressure gauge reads 400 mTorr.
- Open the metering valve to let air into the chamber until the pressure gauge reaches a steady pressure (800-1000 mTorr). Then, select RF with "Hi" mode and expose the coverslips for 3 min.
- After 3 min, turn off the RF mode and vacuum pump.
- Take the Petri dish out of the chamber, flip the coverslips, and place them back in the chamber to plasma expose the other side of the glass coverslip.
- Repeat steps 4.1.2-4.1.4 to plasma clean the untreated side of the glass coverslip.
- After completing the process, remove the Petri dish from the chamber and turn the plasma cleaner and vacuum pump off.
- Cleaning and hydroxylation of the coverslips with piranha solution
NOTE: Standard piranha cleaning protocols can be used to clean and hydroxylate glass slips. Piranha solution is a 30:70 (v/v) mixture of H2O2 and H2SO4. Alternate methods of cleaning glass coverslips may also be used.
CAUTION: Piranha solution is strongly corrosive and explosive with organic solvents and should be handled with extreme caution. Appropriate safety and containment measures should be implemented, such as use of proper personal protective equipment (lab coat, chemical resistant apron, safety glasses, face shield, acid resistant butyl gloves). All glassware and working surfaces in contact with piranha solution should be clean, dry, and free of organic residues prior to use. Piranha solution should never be stored in a partially closed or closed container.- Place a clean 100 mm x 50 mm glass dish on a hotplate magnetic stirrer with adjustable stir speed under a fume hood and add 14 mL of H2SO4 to the dish.
- Gently place a small, teflon-coated magnetic stir bar using teflon-coated forceps inside the dish. Then, turn the stirrer slowly to avoid splashing of the acid.
- Next, gently add 6 mL of H2O2 to the dish and allow the solution to become well mixed.
- Turn off the stirrer, then remove the stir bar from the dish using the forceps. Next, gently place the coverslips inside the dish using the forceps and set the temperature to 60–80 °C.
- After 30 min, gently remove the coverslips using the forceps and submerge them in deionized water (DI) water two times to wash off residual piranha solution.
- After rinsing with water, store the coverslips in DI water at RT until further use.
- Turn off the hotplate and allow the piranha solution to cool.
- To dispose of the piranha solution, gently place the 100 mm x 50 mm glass dish containing the cooled piranha solution in a larger, empty glass beaker that is at least 1.5 L in volume. Then add 1 L of water to dilute and add sodium bicarbonate powder to neutralize. Note that sodium bicarbonate will cause bubbling and heat generation and should be added very slowly, otherwise bubbling may lead to splashing of the acid. When further addition of sodium bicarbonate does not cause bubbling, check the pH with pH paper to verify that it has been neutralized. Once the solution is neutralized and cooled, it can be poured down the sink.
- Thiol functionalization of the coverslips
- Prepare a 5% (v/v) solution of 269 mM of (3-mercaptopropyl) trimethoxysilane (MPTS) solution in dry toluene.
- Add 10 mL of the solution to individual 50 mL conical centrifuge tubes and place one cleaned coverslip in each tube and submerge it within the solution.
NOTE: One coverslip per 50 mL tube is used to assure the thiolation of both sides of the substrate without being disturbed by other substrates. - After 4 h, wash each coverslip (four washes per coverslip) with toluene, a 1:1 (v/v) ethanol: toluene mixture, and ethanol.
NOTE: This is done by immersing each coverslip sequentially into conical centrifuge tubes containing the mentioned solutions. - After rinsing the substrate, submerge them in ethanol and store them at 4 °C until further use.
NOTE: Depending on the number of coverslips, this method can become laborious due to treating coverslips one at a time. For multiple coverslips, Columbia jars that fit several coverslips at the same time can be used.
5. Fabrication of silicon microwell arrays
- Parylene coating: Use the standard protocol described in previous research articles20,21 to coat silicon wafers with parylene.
- Microfabrication: Follow the protocol described by Barua et al.18 to design and fabricate the microwell array (Supplementary Figure 1).
NOTE: Standard photolithographic techniques described by Timm et al.17 were applied to fabricate microwell arrays on parylene-coated silicon wafers.
6. Hydrogel formation
- Bulk hydrogel formation on glass coverslips
- Hydrogel precursor solution: Add 12.5 µL of the crosslinking buffer to an 0.5 mL microcentrifuge tube, followed by 5.6 µL of PEG-o-NB-diacrylate solution. Lastly, add 6.9 µL of 4-arm PEG-thiol solution to the mixture.
NOTE: Adding the 4-arm PEG thiol to the mixture initiates the crosslinking reaction. Thus, the hydrogel precursor solution should be used immediately after mixing. - For cell encapsulation in the hydrogel precursor solution, follow steps 6.1.3-6.1.9.
- For cell encapsulation, before step 6.1.1, inoculate the crosslinking buffer with the desired cell density. As reported previously19, it was observed that cell density of 7.26 × 10⁷ CFU/mL in the crosslinking buffer correlates to a density of ~ 90 cells/mm2 encapsulated across the hydrogel.
- Place the thiolated base coverslip on a clean Petri dish. Place two spacers (see Table of Materials) on the two opposing sides of the coverslip.
NOTE: Thiol functionalization of the coverslips is necessary for the covalent attachment of the hydrogel to the coverslip surface. This is done through the reaction of thiol groups on the surface and the acrylate groups present in the hydrogel precursor solution. - Fix the spacers on the base coverslip by taping the spacers to the Petri dish.
- Pipette the desired volume of the precursor solution on a non-reactive, perfluoroalkylated glass slide.
- Place the perfluoroalkylated glass slide on the base coverslip (Figure 1C). Wait for 25 min at RT for hydrogel formation to complete.
- After gelation, gently remove the perfluoroalkylated glass slide. The hydrogel will stay attached to the base coverslip.
NOTE: For 18 mm x 8 mm coverslips to obtain a 12.7 µm thick membrane, use ~7 µL of the precursor solution (Figure 1A,B). Using higher volumes of precursor solution may result in hydrogel underneath the base coverslip. This may cause the base coverslip to stick to the Petri dish and break upon an attempt of removal. Also, hydrogel residue underneath the coverslip is problematic for microscopy. Gentle removal of the non-reactive perfluoroalkylated glass slide is required as fast removal can damage the hydrogel. - Place the substrate in a 60 mm x 15 mm Petri dish in specified culture media. Here, ATGN media supplemented with 100 µg/mL spectinomycin for B. subtilis or 100 µg/mL ampicillin for E.coli at 37 °C was used for 24 h culture times.
- Hydrogel precursor solution: Add 12.5 µL of the crosslinking buffer to an 0.5 mL microcentrifuge tube, followed by 5.6 µL of PEG-o-NB-diacrylate solution. Lastly, add 6.9 µL of 4-arm PEG-thiol solution to the mixture.

Figure 1: Hydrogel formation on thiolated glass coverslips. (A) Spacers with a thickness of 12.7 µm are placed on two opposite sides of a base coverslip containing reactive thiol groups. (B) The hydrogel precursor solution is pipetted over a non-reactive, fluorinated glass slide. (C) The non-reactive glass slide is placed on the spacers for the formation of 12.7 µm thick hydrogel. (D) The non-reactive glass slide is gently removed, leaving the hydrogel attached to the base coverslip. (E) The prepared hydrogel can be incubated in media for culture. Please click here to view a larger version of this figure.
7. Hydrogel formation over microwell arrays
- Bacteria seeding in microwell arrays
NOTE: 700 µL of 0.1 OD600 cell suspensions were seeded over the microwell array substrates, and the parylene lift-off method was applied to remove cells from the background using the protocol described by Timm et al.22. - Prepare the hydrogel precursor solution by adding 5.6 µL of the PEG-o-NB-diacrylate with 12.5 µL of pH 8 phosphate-buffered saline ATGN and mixing with 6.9 µL of the four-arm PEG thiol solution.
- Pipette 12.5 µL of the precursor solution on a non-reactive, perfluoroalkylated glass slide and place two 38 µm steel spacers (see Table of Materials) on two opposing sides of the microwell array substrate inoculated with cells.
- Invert the perfluoroalkylated glass slide with the precursor solution droplet and place the droplet in the middle of the microwell substrate. Then, incubate for 25 min at RT for hydrogel formation.
- Gently remove the glass slide from the microwell substrate. The hydrogel membrane should remain attached to the microwell substrate. Proceed to step 6.1.9.
8. Material preparation for cell extraction
- PDMS holder preparation
- Tape a stack of ten 18 x 18 mm coverslips together and glue this stack of coverslips to the bottom of a Petri dish.
- To fabricate PDMS holders, mix PDMS precursor and curing agent at a ratio of 10:1 volume ratio in a plastic cup, degas the mixture in a vacuum desiccator, and then pour the mixture into the Petri dish.
- Cure PDMS for 90 min at 80 °C. Then, cut around the taped block to remove the PDMS holder and place the PDMS holder on a glass slide for easier handling for microscopy.
- Microsyringe and tubing preparation
- Cut 20 cm of PTFE tubing (0.05 in I.D.) and attach one end of the tubing to a 100 µL microliter syringe.
NOTE: For extraction, avoid using pipettes as drawing the released cells via a pipette tip can damage the hydrogel surface and lead to contamination.
- Cut 20 cm of PTFE tubing (0.05 in I.D.) and attach one end of the tubing to a 100 µL microliter syringe.
9. Hydrogel degradation with the patterned illumination tool
NOTE: The following steps described in this section are identical for both bulk hydrogels and microwell arrays, except for the light exposure patterns described in steps 9.6.4-9.6.6 and 9.6.7-9.6.10.
- Turn on the microscope (see Table of Materials). Then, turn on the patterned illumination tool (see Table of Materials).
- Turn on the 365 nm LED light source Analog and Digital control module. Next, turn on the LED light source control module.
- Open the microscope software and the software for the patterned illumination tool. When the hardware configuration window is opened, select the Load button.
NOTE: Three devices will be loaded here. (Third-party camera, a control module, and the patterned illumination tool) - Press the Start button. The light patterning software window will now open. Select the first option, the Device Control button, on the left sidebar of the window.
- Calibrate the patterned illumination tool.
NOTE: Calibration must be done with the same microscope objective and filter that will be used for light exposure.- Set the microscope objective to 10x magnification.
NOTE: This magnification allows enough working distance between the microscope lens and the sample surface. It also allows for monitoring and recording the retrieval process in real-time through the image window. - Set the microscope lens and filter to the settings used for light exposure and place the calibration mirror under the microscope.
- In the Device Control window, press the LED Control tab. Turn on LED #1 and set the light intensity to the desired number. In standard extraction experiments, this is set to 60%.
- Press the tab titled with the patterned illumination tool product name in the Device Control window. Then, press the Show Grid button.
NOTE: A grid pattern will be projected on the calibration mirror. - Adjust the microscope focus and camera exposure to obtain high image quality of the grid and rotate the camera to align the grid lines parallel to the camera window frame, if needed.
- Select the Calibration Wizard button under the tab titled with the patterned illumination tool product name and follow the instructions provided by the software in this window.
NOTE: A third-party camera setup window will be opened. - A calibration Type Selection window will be opened. Select Automatic Calibration and press Next.
- When the Pre-calibration Adjustment window opens, follow the software instructions, and press the Next button.
- When the Mapping Information window opens, save this calibration accordingly in the desired folder. This is done by putting in the date, microscope name, objective lens, and filter.
- After calibration, press the Working Area Definition button found under the tab titled with the patterned illumination tool product name to define the working area of the patterned illumination tool if needed.
- Set the microscope objective to 10x magnification.
- Sequence Design section for pattern preparation.
- Press the Sequence Design button on the left-sidebar of the software window. Then, press the Profile Sequence Editor button.
- When the Profile Sequence Editor window opens, select the New Profile option under the Profile List.
NOTE: Now, a Pattern Editor window will be opened. - Prepare the desired pattern for light exposure by choosing different pattern shapes and sizes, or manually draw the pattern, if desired.
- For circle and broken cross patterns for the bulk hydrogel, follow steps 9.6.5- 9.6.6
- For circle patterns, define a circle with a 30 µm diameter over a target bacteria colony to cover the whole colony. Choose the shape fill color white.
- For broken cross patterns, choose the rectangle shape from the pattern drawing window with 3 µm x 8 µm dimensions. Place four rectangles with this dimension on the edges of the target colony, while half the patterns have an overlay with the colony.
- For circle and ring patterns for the microwell arrays, follow steps 9.6.8-9.6.10.
- For circle patterns, draw a 10 µm diameter circle around the well perimeter. Choose the shape fill color white.
- For the ring pattern, draw a circle of diameter 20 µm, place it over the well and choose the shape fill color white.
- Draw another circle pattern of diameter 10 µm with fill shape color black and place it around the perimeter of the well.
- Edit the pattern and modify the shapes based on the desired extraction method. Ensure that the desired pattern exists within the working area of the patterned illumination tool.
- Place the sample in a PDMS holder and pipette the defined media on top of the sample to prevent sample dehydration and provide a carrier solution for released cells.
- Then, replace this with the calibration mirror.
- Adjust the microscope focus to get a sharp image of the colonies within the hydrogel. Inspect the colonies to identify a colony of interest.
- Here, design the light patterns while the camera view shows the colonies inside the sample to test different patterns for cell extraction.
- Save the defined pattern. After saving the defined pattern, select the Session Control section.
- In this section, under the tab titled with the patterned illumination tool product name, add the saved sequence.
- After adding the sequence, choose the option to simulate the pattern to view and adjust for the desired location of exposure.
NOTE: Sample location can be adjusted here to assure the pattern is projected precisely on the targeted area. - Next, adjust the light intensity to 60% and the exposure time to 40 s under the LED control tab and start the exposure process.
- Monitor the hydrogel degradation in real-time and brightfield mode to ensure cell release.
NOTE: Prevent any movements to the sample during light exposure as it can cause degradation of unwanted areas of the hydrogel resulting in cross-contamination.
10. Cell retrieval
NOTE: Cell retrieval procedure is identical for both bulk hydrogels and microwell arrays.
- After 365 nm light exposure and cell release, collect the cells using a microliter syringe and microfluidic tubing (Figure 2).
NOTE: Cell retrieval needs to be done immediately after pattern exposure. This allows for localized cell recovery before the released cells move away from the irradiated area. - Change the microscope from brightfield to FITC or TRITC filter to allow for visualizing the exposed area of the sample by the naked eye.
- Once the exposed area is located, place the end of the tubing upon the irradiated spot. Then change the microscope filter back to brightfield to monitor cell retrieval in real-time.
- Use the syringe attached to the other end of the tubing to carefully withdraw the released cells. Withdraw 200 µL of the solution and insert the solution into a 1.5 mL centrifuge tube for DNA analysis or plating.
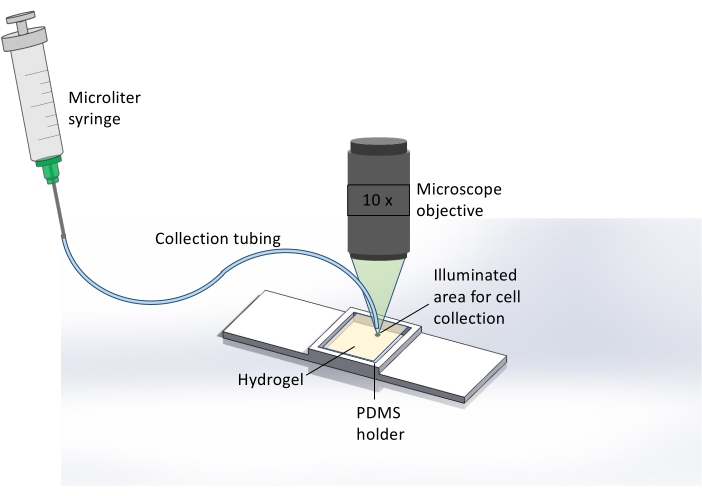
Figure 2: Schematic representation of the extraction method for collecting cells released from the hydrogel. Here, immediately after 365 nm UV exposure, hydrogel degradation, and cell release, the microscope is used to illuminate the hydrogel sample with light from a TRITC filter, resulting in a bright green spot covering the area where cell release occurred. This assists the user in identifying the spatial location for sample collection. After visualizing this area, collection tubing attached to a microliter syringe is placed at this spot and the sample is collected. Brightfield microscopy at 10x magnification is used to monitor the end of the tubing and hydrogel surface in real-time for precise cell collection. Please click here to view a larger version of this figure.
11. Genomic DNA purification and DNA quality measurement
- Use DNA purification kit (see Table of Materials) to extract DNA from bacteria isolates.
- Follow the manufacturer's specification described in the DNA purification kit handbook23 up to the last step (step 7), requiring elution with Buffer AE.
- For the elution step, follow the manufacturer's specification, with the difference of using 100 µL of Buffer AE instead of 200 µL.
- Repeat elution once as described in step 11.1.2. This step leads to increased overall DNA yield.
- Measure DNA quality by using a UV-Vis spectrophotometer (see Table of Materials).
- Turn on the spectrophotometer. After the device initialization, on the home page, select the dsDNA option on the screen.
- Next, lift the pedestal arm and clean the pedestal position with DI water and lint-free wipes.
- Pipette 2 µL of a blank solution, here AE buffer, on the pedestal position and gently bring the pedestal arm down and select Blank on the screen.
- Next, lift the pedestal and clean the pedestal position with DI water to remove any residual material from the previous measurement.
- Load the sample (2 µL) on the pedestal position, bring the pedestal arm down, and select the Measure button on the screen.
- Redo steps 11.2.4 and 11.2.5 for all samples.
- Once the measurement is done, select "End Experiments" on the screen. Insert the flash drive into the device and press "Export data" on the screen.
12. Determining cell viability from hydrogel and microwell extracts
- Dilute the bacterial suspensions by a dilution factor of 105 using a 96-well plate.
- Pipette 10 µL of the diluted bacterial suspension and spot three times on ATGN plates for each bacteria suspension.
- Tilt the plates to spread the cells on agar surfaces. Air-dry the ATGN plates containing the bacterial suspensions.
- Incubate the plates at 37 °C for 48 h. Count and record the Colony Formation Units (CFUs) numbers. Count all three spreads of bacterial suspensions on each plate.
NOTE: Perform steps 12.1-12.4 in a biological safety cabinet to avoid contamination of the plate.
Results
To investigate the ability of UV light to trigger controlled hydrogel degradation for cell release, hydrogels were first encapsulated over thiolated coverslips without bacteria present. Each hydrogel was exposed to three replicate circle patterns of light at different intensities and exposure times. The percent gel degradation was calculated after UV light exposure at each light intensity, and the exposure time was then quantified by coupling pendant thiol groups with a fluorescein-5-maelimide dye for fluorescence imaging19,24. A representative example of how these two parameters affect hydrogel degradation is shown in Figure 3. As evident, patterned light provided by the patterned illumination tool provides spatial-temporal control of hydrogel degradation at a resolution that can enable the release of only a small number of cells.

Figure 3: Control over hydrogel degradation. UV light dose and resulting hydrogel degradation rate are tunable via the patterned illumination tool. (Inset) Two different light intensities were chosen for patterned hydrogel degradation. After 365 nm UV light exposure, hydrogels were labeled with fluorescein-5-maleimide for fluorescence imaging. Reprinted (adapted) with permission from Fattahi et al.19 Copyright 2020 American Chemical Society. Please click here to view a larger version of this figure.
For cell extraction, different light patterns were used to investigate cell release (Figure 4). Here, Agrobacterium bacteria cells were encapsulated into bulk hydrogels over thiolated glass coverslips, then cultured into microscale colonies. Hydrogels were then inspected in brightfield microscopy, and targeted microcolonies were exposed to varied UV light patterns. It was observed that different exposure patterns influenced the morphology of the released cells. This is potentially beneficial for various applications. For instance, exposing a ring pattern around the target colony results in the release of the entire colony still encapsulated in a protective PEG hydrogel and without direct UV light exposure (Figure 4A), which may preserve cells and provide easy downstream purification. In contrast, by exposing part or all of the colony to UV light, cells can be extracted either as aggregated cell clusters (Figure 4B) or as free, individual cells (Figure 4C).
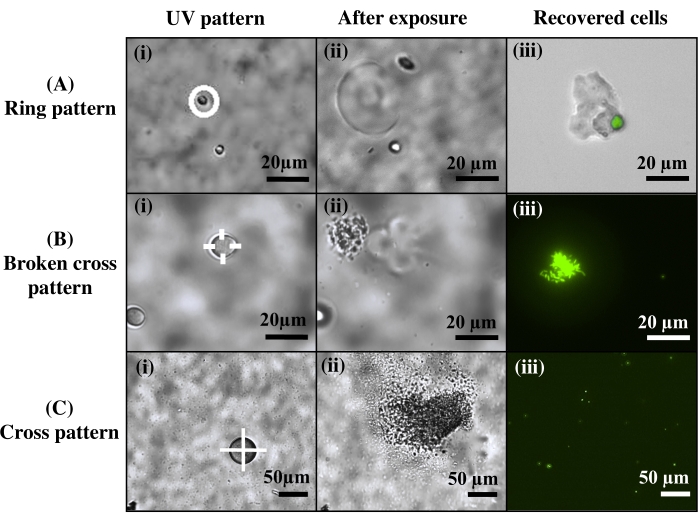
Figure 4: Control over the morphology of the extracted cells. (A) Use of a ring pattern to release the entire cell colony, protected in a PEG matrix. (B) Use of a broken cross pattern for cell release in aggregates. (C) Use of a cross pattern to release individual cells. Reprinted (adapted) with permission from Fattahi et al.19 Please click here to view a larger version of this figure.
Critical in the encapsulation protocol is both the cell seeding density and the thickness of the hydrogel, as both of these parameters can influence the number of cells incorporated in the hydrogel for observation. To demonstrate, A. tumefaciens cells samples were encapsulated into hydrogels of two different thicknesses using thin spacers (12.7 µm) or thick spacers (40 µm) cultured, and imaged following the established protocols. Thinner hydrogels resulted in a microcolony density of 90 colonies/mm2 throughout the hydrogel, where minimal colony overlap was observed (Figure 5A). In contrast, hydrogel thicknesses greater than 12.7 µm resulted in the formation of overlapping colonies in the vertical direction (Figure 5B), which may result in the extraction of multiple colonies. Overlapping colonies can cause cross-contamination during extraction due to the two-dimensional nature of the light pattern. For example, a top colony can be targeted, while an underlying colony also is extracted with it (Figure 5C). Therefore, using 12.7 µm spacers is recommended for hydrogel preparation.
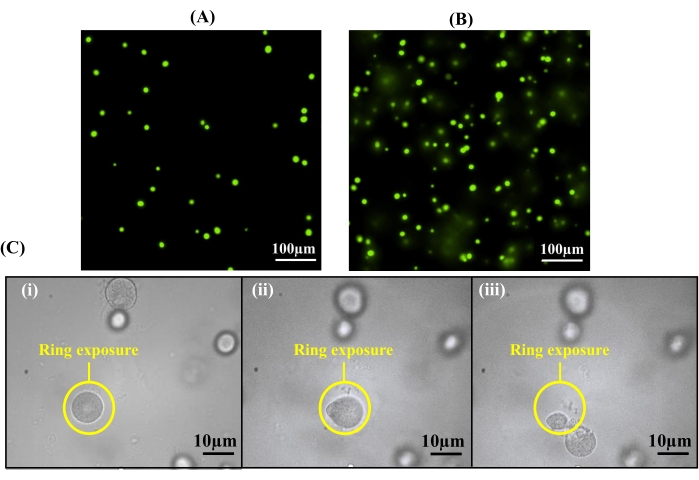
Figure 5: Hydrogel thickness affects the extraction purity. (A) By utilizing spacers with a thickness of 12.7 µm for hydrogel formation, colonies are formed within one 10x focal plane. (B) Overlay of colonies can be observed at 10x magnification if spacers with greater thicknesses than 12.7 µm are used. (C) Cross-contamination can occur with an overlay of colonies during cell release: (i) a ring pattern is used to release a targeted cell colony, (ii) the targeted cell colony becomes detached from the hydrogel, and (iii) a second, underlying colony is observed during the light exposure beneath the targeted colony. This colony is also removed, resulting in cross-contamination. Reprinted (adapted) with permission from Fattahi et al.19 Copyright 2020 American Chemical Society. Please click here to view a larger version of this figure.
Given the potential damage to bacteria with UV light, the effect of varied UV light micropatterns on cell viability was further studied using model, Gram-positive bacteria (B. subtilis) and model, Gram-negative bacteria (E. coli). Each was encapsulated within bulk hydrogels and cultured into microscale colonies according to standard protocols, verifying their compatibility with the hydrogel. Targeted microcolonies of equivalent sizes (26 ± 1 μm diameter) were then exposed to a constant light dose (168 mJ/mm2), either in the form of circle patterns exposing entire microcolonies to UV light or cross-patterns that degrade only hydrogel edges to minimize light exposure to cells. Cells were then recovered and plated to quantify the CFU/mL recovered from each colony. No significant difference in cell recovery level was found (Figure 6A). To further investigate the purity of the extracted cells, DNA was extracted from E. coli samples and analyzed using a UV-Vis spectrophotometer. For both patterns, DNA quality levels fall within a A260/A280 range between 1.8 and 2.0 (Figure 6B), which is in the ideal range for genomic sequencing25. This demonstrates that the UV patterns used for release under the described conditions have minimal effect on the quantity of viable cells recovered from the bulk hydrogels or on genomic DNA quality after extraction.
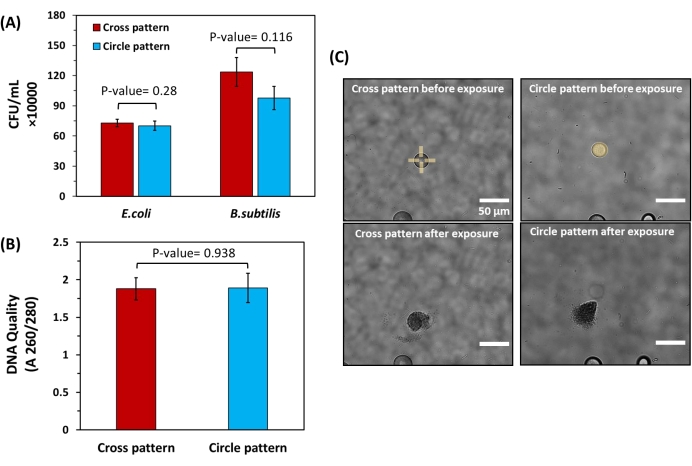
Figure 6: Impact of different light exposure patterns on cell viability and DNA quality of bacteria released from bulk hydrogels. (A) Cell recovery levels for both E. coli and B. subtilis after extraction using cross patterns and circle patterns. For this experiment, extraction was done from spherical colonies with the same diameter (26 µm ± 1 µm) to ensure the number of released cells from each colony was equivalent. The extracted solutions were then plated to calculate the CFU/mL acquired from each pattern. Statistical analysis showed no significant difference in CFU/mL obtained from cross and circle patterns for both E. coli and B. subtilis (P-value > 0.05, n= 6 for both strains). (B) Spectrophotometric quantification of DNA quality for isolated E. coli cells using cross and circle patterns. Here, statistical analysis did not show a significant difference in DNA quality for the patterns used (P-value > 0.05, n = 6) (C) Brightfield images of colonies with equal diameters exposed to cross and circle patterns. Please click here to view a larger version of this figure.
Microwell arrays provide an alternative, lab-on-a-chip screening interface that offers more controlled screening features compared to bulk hydrogels. For example, microwell arrays enable the seeding of bacteria into discrete culture sites where the number of cells in the inoculum can be controlled. Geometric features of microwells such as well depth and diameter are also controlled through standard microfabrication methods. With these benefits, microwells have been useful for studying bacteria growth under spatial confinement26, and most recently for the discovery of symbiotic and antagonistic interactions between different bacterial species when confined together at the microscale18. Cellular extraction from wells for genomic analysis such as 16S amplicon sequencing is critical for these applications. Using the same hydrogel material, UV light can be exposed over a well containing cells of interest, either as circle or ring patterns. The latter ensures hydrogel degradation only at the microwell perimeter to prevent direct irradiation of cells. To demonstrate this, A. tumefaciens cells expressing mCherry were seeded into wells, the hydrogel was then attached to the microwell array. Cells were cultured and then irradiated with either circle or ring patterns. The membrane was then stained with fluorescein-5-maleimide dye. Two-color fluorescence images revealed that both the membrane and the cells within the wells are removed for both irradiation patterns17. Unlike the bulk hydrogel format, cell extraction here has only been observed in the shape of cell clusters18.
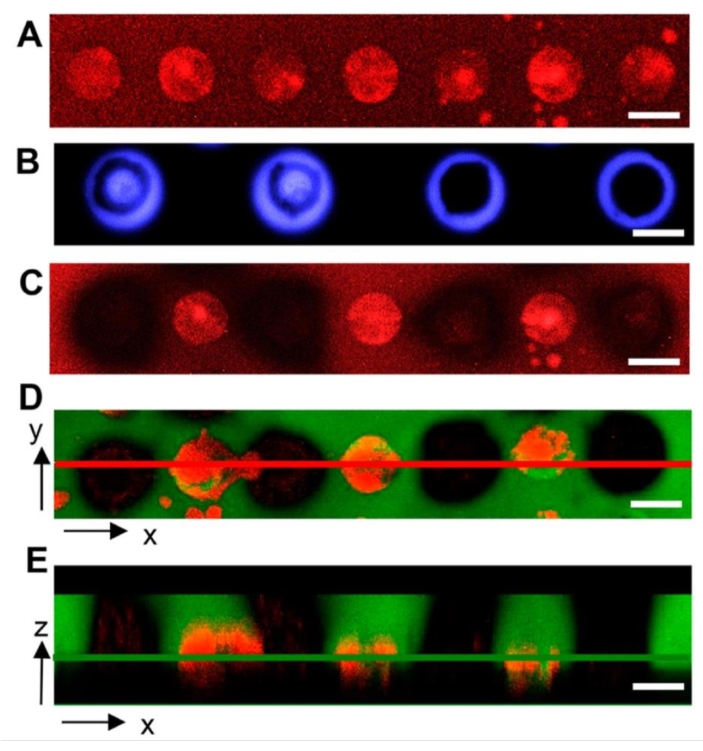
Figure 7: Representative confocal microscopy images showing light pattern impact on cell isolation from microwell arrays. (A) Microwells with diameters of 40 µm containing bacteria (red) after seeding and culture. (B) Light exposure using circle and ring patterns (blue). (C) Decreased red fluorescence demonstrates that cells are extracted from irradiated wells. (D) Two-color fluorescence image of membranes and bacteria after irradiation, indicating removal of both the hydrogel (green) and bacteria (red) from target wells. (E) Z-stack, two-color fluorescence image of target wells. The red line in (D) denotes the xz plane imaged in (E), and the green line in (E) denotes the xy plane imaged in (D). Samples in images (C-E) were washed for removal of released cells, then fixed and imaged. Scale bar = 40 µm. Reprinted (adapted) with permission from van der Vlies et al.17. Copyright 2019 American Chemical Soceity. Please click here to view a larger version of this figure.
To quantify bacteria cell viability and DNA quality after extraction in this format, B. subtilis and E. coli cells were seeded, cultured, and then released from microwell arrays using circle and ring patterns (Figure 8A, B). Released cells were then plated on ATGN agar plates, and the DNA quality of the extracted cells was quantified. To ensure that a consistent number of cells was present during each extraction, microwells with similar fluorescent intensities (~6000 A.U.) and therefore a similar number of cells were targeted for release. The number of viable cells extracted using a circle pattern was not significantly different from the number of viable cells extracted using ring pattern for either bacteria (Figure 8C). Also, the DNA quality levels were not significantly different between the circle and ring patterns for either bacteria (Figure 8D). Hence, similar to findings in bulk hydrogels, the application of UV light at the intensity and duration specified here had a negligible impact on the viability and DNA quality of cells extracted from the microwell arrays. These findings demonstrate that viable bacteria cells can be selectively retrieved from microwells with minimal damage for downstream analysis.
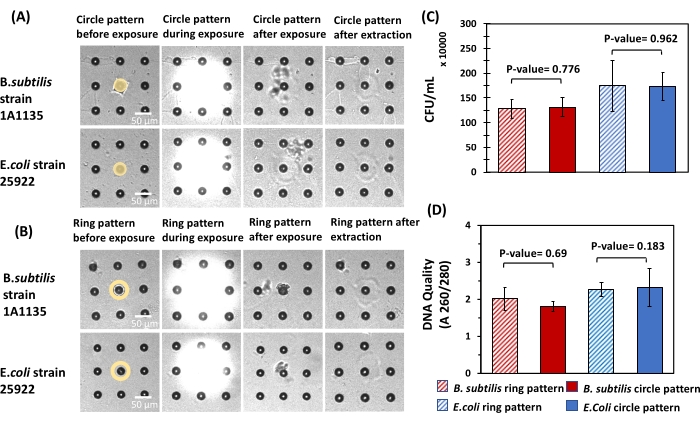
Figure 8: Impact of different light exposure patterns on cell viability and DNA quality of bacteria released from microwell arrays. (A,B) For both E. coli and B. subtilis, circle patterns and ring patterns were used for cell extraction from 10 µm microwells. Circle pattern with a diameter of 10 µm and ring pattern with an inner diameter of 10 µm and outer diameter of 20 µm were used in this experiment for cell extraction. Microwells with the same diameters were used to ensure that the number of released cells from each microwell was the same. (C) The extracted solutions were then plated to calculate the CFU/mL acquired from each exposure pattern. Statistical analysis showed no significant difference in CFU/mL obtained from circle and ring pattern for both E. coli and B. subtilis (P-value > 0.05, n = 6 for both strains). (D) Spectrophotometry was used to measure the DNA quality of both E. coli and B. subtilis cells using circle and ring patterns. Here, statistical analysis did not show any significant difference in the DNA quality for the patterns used (P-value > 0.05, n = 6 for both strains). Please click here to view a larger version of this figure.
Supplementary Figure 1: Design and fabrication of microwell arrays. (A) Standard microfabrication techniques were applied to fabricate microwell arrays on silicon wafers. (B) Each substrate consisted of 7 x 7 arrays of 10µm diameter wells with 20 µm depth and 30 µm pitch. (C) Each array consisted of 225 microwells. This figure has been modified from Barua et al.18. Copyright 2021 Frontiers Media. Please click here to download this File.
Discussion
This manuscript demonstrates the use of photodegradable hydrogels for bacteria screening and isolation. The material and approach enable high-throughput culture, control over growth media and growth conditions, and clean and precise cell extraction in a straightforward and cost-effective manner. Extraction only requires a fluorescent microscope coupled with the patterned illumination tool and can be done in a sequential manner to isolate multiple cell targets. Each extraction takes 5-10 min to perform, and up to 30 targeted colonies have been removed from a single hydrogel. A key advantage of the approach is its adaptability to a variety of different assay formats, as demonstrated here with screening from both bulk hydrogels and microwell arrays. The separation process in both formats has been successfully used to isolate bacteria that display unique growth behavior for downstream genotyping after culture and microscopic observation, a critical capability for connecting cell genotype to phenotype. To date, genomic characterizations of bacteria extracted from these interfaces have included 16S amplicon sequencing to identify multi-species collections of bacteria from environmental microbiomes that generate emergent growth behavior18, and for whole-genome sequencing to successfully identify genetic mutations that cause rare growth profiles in cells present within mutant libraries19.
Using bulk hydrogels for cell screening and isolation is the most straightforward and simple format. Bulk photodegradable hydrogels form rapidly (25 min) after mixing the precursors over transparent glass coverslips to encapsulate cells in a 3-D cell culture matrix that is imaged with a standard upright or inverted fluorescence microscope. Thus, the method has the potential to be translational to common microbiology laboratories that do not have microfabrication resources or expertise. A drawback to this format is that cells are randomly oriented throughout the three-dimensional hydrogel. Therefore, cells can appear out of the focal plane when imaging with higher magnification objectives and extraction can be difficult if cell colonies are oriented too close to each other or if there is a vertical overlay of colonies. Depositing a thin hydrogel (<13 μm) as described is critical to mitigating this drawback. Exposure in broken cross light patterns (Figure 4B) is preferable here, as this pattern results in cells free of the hydrogel that have minimal exposure to UV light and can be readily recovered through plating.
In contrast, the microwell array format provides a more well-controlled interface, as bacteria cells are partitioned into discrete microwells that serve as small culture or co-cultures sites17,18,26. Microwell dimension, pitch, and density are precisely fabricated using standard photolithographic techniques. Compared to bulk hydrogels, bacteria can be extracted from microwell arrays with a higher degree of specificity and lower chance of cross-contamination, as the cells are only present at predefined locations, not randomly dispersed throughout the hydrogel. The concentration and ratios of bacteria cells in the seeding solution can also be varied to control the quantity and composition of the microwell inoculum through a seeding process that has been characterized in previous reports26, giving the user flexibility in the experimental design of the screen. The primary drawback of screening with the microwell array format is the added time and expertise required for microfabrication. Fabrication of microwells was estimated to cost ~$10 per array, which includes material costs and cleanroom expenses. In addition, microwells arrays are traditionally made from silicon, which can cause imaging difficulties since the substrates are non-transparent. Moreover, a high amount of light scattering from the silicon surface can limit imaging within the microwells and can decrease pattern resolution during hydrogel exposure with UV light from the patterned illumination tool (seen in Figure 8A,B). Similar microwells have been fabricated on transparent quartz substrates to address these types of limitations27; however, this fabrication is considerably more difficult. Exposure to ring patterns that illuminate the perimeter of the well is preferable here to release free cells from the wells while minimizing UV exposure.
The most common problem that occurs in either format is detachment of the hydrogel from the underlying substrate during culture due to hydrogel swelling. If this is an issue for bulk hydrogels, the presence, density, and uniformity of thiol groups in the chemical (MTPS) attachment layer across the surface of the base glass coverslip should be verified using an appropriate surface characterization technique (XPS, ATR-FTIR, AFM, etc.). Low densities of surface thiol groups due to inefficient surface functionalization can lead to a weak interaction between the substrate and the hydrogel. If a low level of surface thiolation occurs, the stability of the MTPS solution should be checked. Care should be taken in the initial cleaning of the glass slide to assure a clean surface prior to MTPS treatment, and care should be taken to ensure the use of anhydrous toluene during the MTPS surface reaction (Protocol Section 4). In the case of microwell arrays, surfaces are not thiolated, and hydrogels instead attach through the partial filling of the wells with the hydrogel, which anchors the hydrogel to the silicon substrate17. If hydrogel detachment is an issue in this system, more microwells or other microscale features can be etched into the array to further anchor the hydrogel to the substrate to promote stronger attachment.
A limitation of the technique in either format is the limited stability of the hydrogels in the presence of bacteria. It has been noted that some bacteria, such as A. tumefaciens, can degrade the hydrogel over the course of 5-7 days17,19, which limits the experiment time. Current investigation of the mechanisms of bacterial degradation is underway; it is hypothesized that the ester groups present from the diacrylate monomers are subject to bacteria-mediated hydrolysis and/or enzymatic degradation, as noted in other systems17. Developing more stable hydrogel chemistries will extend the time that bacteria can remain in the hydrogel and will extend the screen to microorganisms with slower growth rates. A second limitation is that in both formats, cell recovery and extraction occur in an open environment, resulting in relatively high extraction volumes (30-100 μL), which can be susceptible to outside contamination. Thus, care must be given to ensure enough cells are present from the target colonies while minimizing the extraction solution volume. To obtain enough cells for plating and recovery or for extraction of DNA material, it was observed that in bulk hydrogels, cells must be cultured long enough to reach colony diameters of at least 10 µm. To lower the required volume for cell extraction, it was observed that using a microliter syringe and tubing (Figure 2) was more efficient than pipetting. The tubing allowed the isolates to be drawn from the release point more accurately, requiring less solution volume and lowering the chance of contamination.
Future work involves understanding the effect of hydrogel mechanical properties on cell growth, as mechanical features of these hydrogels are well-controlled by the selection of appropriate PEG-based monomer precursors of various molecular weights28, and mechanical interactions likely play an important role in bacteria behavior29. As the hydrogel materials can be readily incorporated into a variety of different systems and devices, further development is also focused on the integration of this material into microfluidic systems. This would reduce the extraction solution to femtoliter to picoliter volumes, compared to traditional 30-100 μL volumes currently required in the open collection format. Smaller solution volumes would greatly reduce potential contamination and move the approach towards single-cell isolation and characterization.
Disclosures
RRH and AJV have filed a patent on this technology. The remaining authors declare no conflict of interest.
Acknowledgements
This research was supported by NSF CAREER Award #1944791.
Materials
| Name | Company | Catalog Number | Comments |
|---|---|---|---|
| (3-Mercaptopropyl)triethoxysilane | Sigma-Aldrich | 175617-25G | > 95% |
| Alconox detergent powder | Alconox | 1104 | |
| Ammonium sulfate | Fisher Chemical | A702-500 | Certified ACS Granular |
| Autoclave SK300C | Yamato Scientific | 18016 | |
| Bacillus subtilis 1A1135 | Bacillus Genetic Stock Center | 1A1135 | |
| Brightfield upright microscope | Olympus Corporation | BX51 | |
| Calcium chloride, anhydrous | Fisher Chemical | C614-500 | For Desiccators Pellets, 4-20 Mesh |
| Centrifuge 5702 | Eppendorf | 5702 | |
| Citric acid monohydrate | Sigma-Aldrich | C1909-500G | ACS reagent, > 99.0% |
| D-Glucose (Dextrose) | VWR Amresco Life Science | 0188-1KG | |
| Dneasy Blood & Tissue Kit | Qiagen | 69504 | DNA purification kit |
| DOWSIL 184 silicone elastomer base | Dow Silicones Corporation | Storage temperature: -30-60 °C | |
| DOWSIL 184 silicone elastomer curing agent | Dow Silicones Corporation | Storage temperature: < 32 C | |
| EPOCH2 microplate spectrophotometer | BioTek Instruments | EPOCH2 | |
| Escherichia coli ATCC 25922 | Thermo Fisher Scientific | R19020 | |
| Ethanol, anhydrous | Fisher Chemical | 459844 | |
| Fisherbrand microscope cover glass | Fisher Scientific | 12540A | |
| Fisherfinest premium microscope slides plain | Fisher Scientific | 12-544-4 | |
| Hydrogen peroxide solution | Sigma-Aldrich | 216763-500ML | Contains inhibitor, 30 wt% in H2O |
| Incu-Shaker Mini | Benchmark | E5-0014-01 | |
| Isopropanol | Sigma-Aldrich | 190764 | |
| Magnesium sulfate, 7-hydrate | Macron Fine Chemicals | 6066-04 | Avantor Performance Materials, Inc. |
| Methanol | Sigma-Aldrich | 179337-4L | ACS reagent, > 99.8% |
| NanoDrop One spectrophotometer | Thermo Scientific | ND-ONEC-W | |
| Nitrogen, compressed | Matheson | UN1066 | |
| Oxygen plasma cleaner | Harrick Plasma | PDC-001-HP | |
| Pentaerythritol tetra(mercaptoethyl) polyoxyethylene (4 arm-PEG) | NOF America Corporation | PTE-100SH | Sunbright-PTE-100SH |
| Phosphate buffered saline (PBS), 10X | VWR Amresco Life Science | K813-500ML | Store between 15 °C–30 °C |
| Polydimethyl siloxane (PDMS) Slygard 184 | Dow Corning | 4019862 | |
| Polygon400 | Mightex | DSI-D-000 | |
| Premium microscope slides | Fisher Scientific | 12-544-4 | 25 x 75 x 1 mm |
| Sodium bicarbonate | Sigma-Aldrich | S5761-500G | |
| Sodium chloride | Sigma Life Science | S5886-500G | Bioreagent, suitable for cell culture |
| Sodium hydroxide | Sigma-Aldrich | S8045-500G | BioXtra, > 98%, pellets (anhydrous) |
| Sodium phosphate monobasic dihydrate | Sigma-Aldrich | 71505-250G | BioUltra, for molecular biology, > 99.0% (T) |
| Stainless steel thickness gage | Precision Brand Products | 77739 | |
| Sulfuric acid | Sigma-Aldrich | 320501-2.5L | |
| Toluene, anhydrous, 99.8% | Sigma-Aldrich | 244511-1L | Anhydrous, > 99.8% |
| Trichloro (1H,1H,2H,2H perfluorooctyl) silane (TPS), 97% | Sigma-Aldrich | 448931-10G | |
| Tryptic soy broth | Sigma-Aldrich | 22092-500G | For microbiology |
| Super Nuova Digital Hot Plate Stirrer | Thermo Scientific | S131825 | |
| Ultrasonic sonicator | Fischer Scientific | FS-110H |
References
- Welch, J. D., et al. Selective single cell isolation for genomics using microraft arrays. Nucleic Acids Research. 44 (17), 8292-8301 (2016).
- Lim, J. W., Shin, K. S., Moon, J., Lee, S. K., Kim, T. A microfluidic platform for high-throughput screening of small mutant libraries. Analytical Chemistry. 88 (10), 5234-5242 (2016).
- Ishii, S., Tago, K., Senoo, K. Single-cell analysis and isolation for microbiology and biotechnology: Methods and applications. Applied Microbiology and Biotechnology. 86 (5), 1281-1292 (2010).
- Nichols, D., et al. Use of ichip for high-throughput in situ cultivation of “uncultivable microbial species”. Applied and Environmental Microbiology. 76 (8), 2445-2450 (2010).
- Oliver, J. D. Recent findings on the viable but nonculturable state in pathogenic bacteria. FEMS Microbiology Reviews. 34 (4), 415-425 (2010).
- Zhao, X., Zhong, J., Wei, C., Lin, C. W., Ding, T. Current perspectives on viable but nonculturable state in foodborne pathogens. Frontiers in Microbiology. 8, 580(2017).
- Wang, X., Gou, X., Chen, S., Yan, X., Sun, D. Cell manipulation tool with combined microwell array and optical tweezers for cell isolation and deposition. Journal of Micromechanics and Microengineering. 23 (7), 075006(2013).
- Lewis, W. H., Tahon, G., Geesink, P., Sousa, D. Z., Ettema, T. J. G. Innovations to culturing the uncultured microbial majority. Nature Reviews Microbiology. 19 (4), 225-240 (2020).
- Poonlapdecha, W., et al. Antibody-conjugated ferromagnetic nanoparticles with lateral flow test strip assay for rapid detection of Campylobacter jejuni in poultry samples. International Journal of Food Microbiology. 286, 6-14 (2018).
- Wang, Z., Cai, R., Gao, Z., Yuan, Y., Yue, T. Immunomagnetic separation: An effective pretreatment technology for isolation and enrichment in food microorganisms detection. Comprehensive Reviews in Food Science and Food Safety. 19 (6), 3802-3824 (2020).
- Blainey, P. C. The future is now: Single-cell genomics of bacteria and archaea. FEMS Microbiology Reviews. 37 (3), 407-427 (2013).
- Shrirao, A. B., et al. Microfluidic flow cytometry: The role of microfabrication methodologies, performance and functional specification. Technology. 06 (01), 1-23 (2018).
- Kou, S., Cheng, D., Sun, F., Hsing, I. -M. Microfluidics and microbial engineering. Lab on a Chip. 16 (3), 432-446 (2016).
- Kehe, J., et al. Massively parallel screening of synthetic microbial communities. Proceedings of the National Academy of Sciences of the United States of America. 116 (26), 12804-12809 (2019).
- Tibbitt, M. W., Kloxin, A. M., Sawicki, L. A., Anseth, K. S. Mechanical properties and degradation of chain and step-polymerized photodegradable hydrogels. Macromolecules. 46 (7), 2785-2792 (2013).
- Kloxin, A. M., Kasko, A. M., Salinas, C. N., Anseth, K. S. Photodegradable hydrogels for dynamic tuning of physical and chemical properties. Science. 324 (5923), 59-63 (2009).
- Van Der Vlies, A. J., Barua, N., Nieves-Otero, P. A., Platt, T. G., Hansen, R. R. On demand release and retrieval of bacteria from microwell arrays using photodegradable hydrogel membranes. ACS Applied Bio Materials. 2 (1), 266-276 (2019).
- Barua, N., et al. Simultaneous discovery of positive and negative interactions among root microbiome bacteria using microwell recovery arrays. Frontiers in Microbiology. 11, 3361(2021).
- Fattahi, N., et al. Photodegradable hydrogels for rapid screening, isolation, and genetic characterization of bacteria with rare phenotypes. Biomacromolecules. 21 (8), 3140-3151 (2020).
- Masigol, M., Barua, N., Retterer, S. T., Lokitz, B. S., Hansen, R. R. Chemical copatterning strategies using azlactone-based block copolymers. Journal of Vacuum Science & Technology B, Nanotechnology and Microelectronics: Materials, Processing, Measurement, and Phenomena. 35 (6), (2017).
- Masigol, M., Barua, N., Lokitz, B. S., Hansen, R. R. Fabricating reactive surfaces with brush-like and crosslinked films of azlactone-functionalized block co-polymers. Journal of Visualized Experiments: JoVE. (136), e57562(2018).
- Timm, A. C., Halsted, M. C., Wilmoth, J. L., Retterer, S. T. Assembly and tracking of microbial community development within a microwell array platform. Journal of Visualized Experiments: JoVE. (124), e55701(2017).
- DNeasy Blood & Tissue Handbook - QIAGEN. , Available from: https://www.qiagen.com/us/resources/resourcedetail?id=68f29296-5a9f-40fa-8b3d-1c148d0b3030&lang=en (2021).
- Baldwin, A. D., Kiick, K. L. Tunable degradation of Maleimide-Thiol adducts in reducing environments. Bioconjugate Chemistry. 22 (10), 1946-1953 (2011).
- Shokrzadeh, M., Mohammadpour, A. Evaluation of a modified salt-out method for DNA extraction from whole blood lymphocytes: A simple and economical method for gene polymorphism. Pharmaceutical and Biomedical Research. 4 (2), 28(2018).
- Hansen, R. H., et al. Stochastic assembly of bacteria in microwell arrays reveals the importance of confinement in community development. PLoS One. 11 (5), 0155080(2016).
- Halsted, M., et al. Development of transparent microwell arrays for optical monitoring and dissection of microbial communities. Journal of Vacuum Science & Technology B, Nanotechnology and Microelectronics: Materials, Processing, Measurement, and Phenomena. 34 (6), (2016).
- Zustiak, S. P., Wei, Y., Leach, J. B. Protein-Hydrogel Interactions in Tissue Engineering: Mechanisms and Applications. Tissue Engineering. Part B, Reviews. 19 (2), 160(2013).
- Kandemir, N., Vollmer, W., Jakubovics, N. S., Chen, J. Mechanical interactions between bacteria and hydrogels. Scientific Reports. 8 (1), 10893(2018).
Reprints and Permissions
