

11.12: Heating and Cooling Curves
When a substance—isolated from its environment—is subjected to heat changes, corresponding changes in temperature and phase of the substance is observed; this is graphically represented by heating and cooling curves.
For instance, the addition of heat raises the temperature of a solid; the amount of heat absorbed depends on the heat capacity of the solid (q = mcsolidΔT). According to thermochemistry, the relation between the amount of heat absorbed or released by a substance, q, and its accompanying temperature change, ΔT, is:

where m is the mass of the substance, and c is its specific heat. The relation applies to matter being heated or cooled, but not changing state.
When the temperature is high enough, the solid begins to melt (Figure 1, point A). The heat absorbed depends on the solid’s heat capacity (q = mcsolidΔT), and a plateau is observed at its melting point. The plateau indicates a change of state from solid to liquid, during which the temperature does not rise due to the heat of fusion (q = mΔHfusion). In other words, further heat gain is a result of diminishing intermolecular attractions, instead of increasing molecular kinetic energies. Consequently, while a substance is changing state, its temperature remains constant.
Once the solid has completely melted (Figure 1, point B), the liquid starts warming and experiences a rise in temperature. The heat absorbed depends on the liquid's heat capacity (q = mcliquidΔT). When the liquid reaches its boiling point, the liquid begins to vaporize (Figure 1, point C) and the temperature remains constant despite the continued input of heat. Another plateau (constant temperature) is observed at the liquid's boiling point during the liquid to gas transition due to the heat of vaporization (q = mΔHvap). This same temperature is maintained by the liquid as long as it is boiling. If heat is provided at a greater rate, the liquid's temperature does not rise, but instead, the boiling becomes more vigorous (rapid). After all the liquid has vaporized (Figure 1, point D), the temperature of the gas increases.
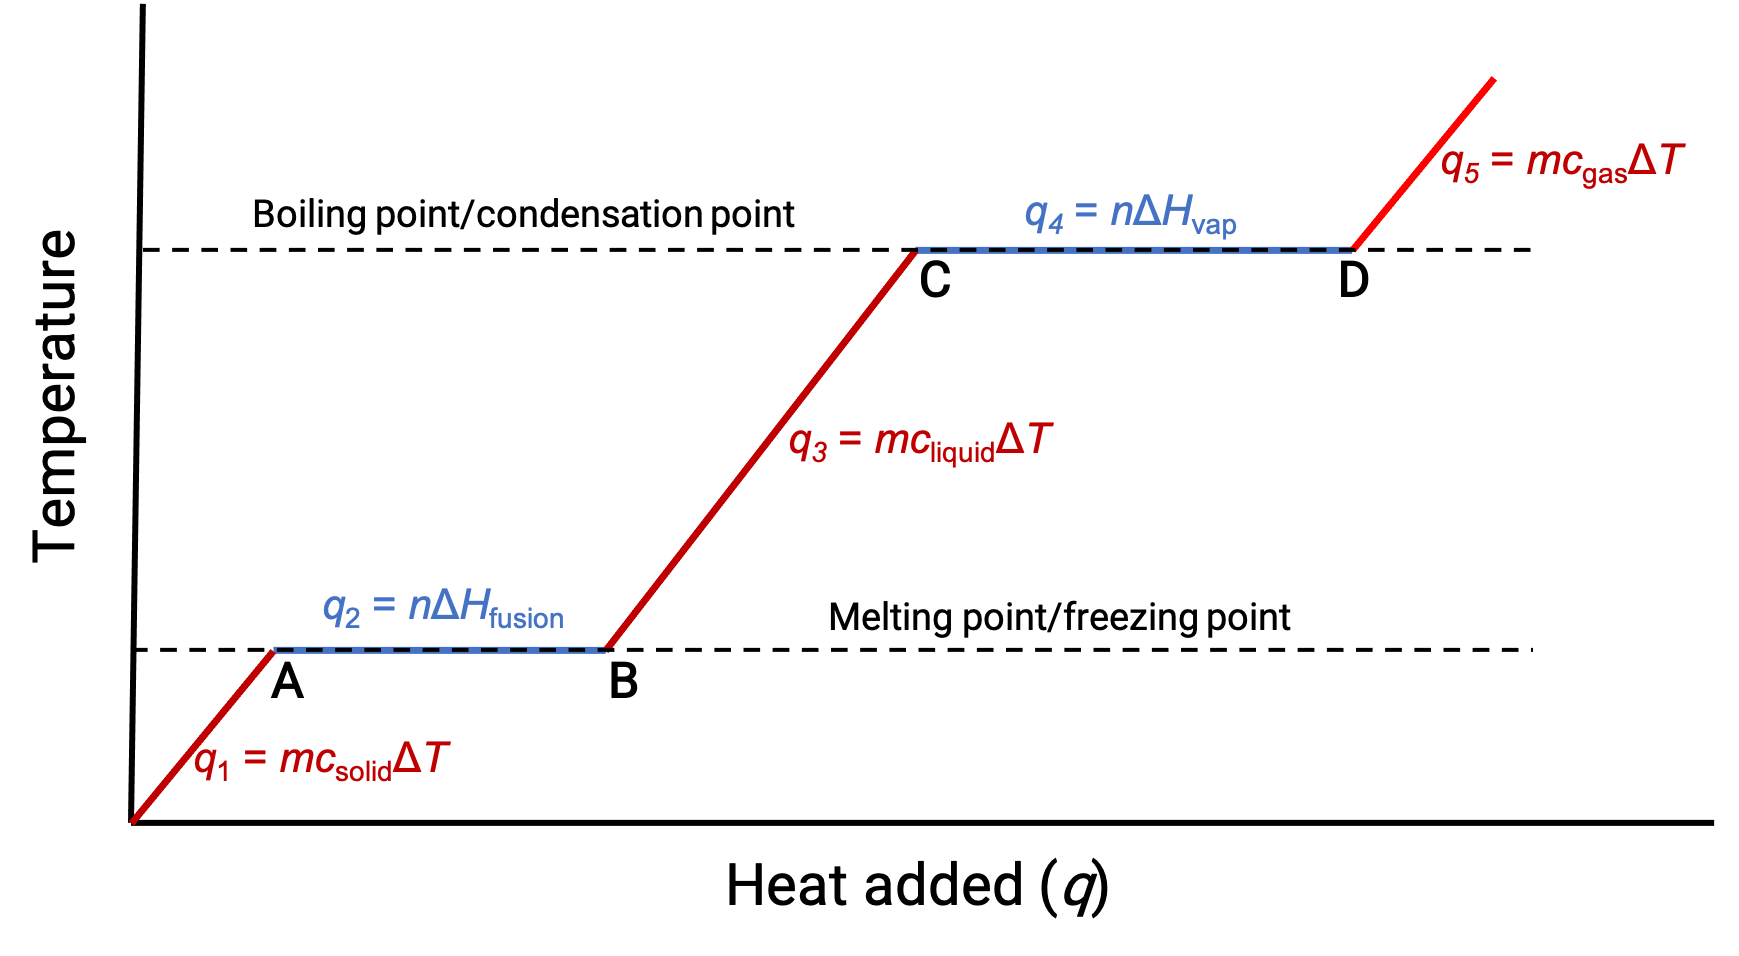
Figure 1. The representative heating curve for a substance depicts changes in temperature that result as the substance absorbs increasing amounts of heat. Plateaus in the curve (regions of constant temperature) are exhibited when the substance undergoes phase transitions.
This text is adapted from Openstax, Chemistry 2e, Section 10.3: Phase Transitions.