Individual cardiomyocytes from wild type and mutant mice can be isolated from the heart in order to study their contractility and calcium transients. This allows characterization of the contribution of cellular dysfunction to heart dysfunction from any cause.
Cardiomyocytes, the workhorse cell of the heart, contain exquisitely organized cytoskeletal and contractile elements that generate the contractile force used to pump blood. Individual cardiomyocytes were first isolated over 40 years ago in order to better study the physiology and structure of heart muscle. Techniques have rapidly improved to include enzymatic digestion via coronary perfusion. More recently, analyzing the contractility and calcium flux of isolated myocytes has provided a vital tool in the cellular and sub-cellular analysis of heart failure. Echocardiography and EKGs provide information about the heart at an organ level only. Cardiomyocyte cell culture systems exist, but cells lack physiologically essential structures such as organized sarcomeres and t-tubules required for myocyte function within the heart. In the protocol presented here, cardiomyocytes are isolated via Langendorff perfusion. The heart is removed from the mouse, mounted via the aorta to a cannula, perfused with digestion enzymes, and cells are introduced to increasing calcium concentrations. Edge and sarcomere detection software is used to analyze contractility, and a calcium binding fluorescent dye is used to visualize calcium transients of electrically paced cardiomyocytes; increasing understanding of the role cellular changes play in heart dysfunction. Traditionally used to test drug effects on cardiomyocytes, we employ this system to compare myocytes from WT mice and mice with a mutation that causes dilated cardiomyopathy. This protocol is unique in its comparison of live cells from mice with known heart function and known genetics. Many experimental conditions are reliably compared, including genetic or environmental manipulation, infection, drug treatment, and more. Beyond physiologic data, isolated cardiomyocytes are easily fixed and stained for cytoskeletal elements. Isolating cardiomyocytes via perfusion is an extremely versatile method, useful in studying cellular changes that accompany or lead to heart failure in a variety of experimental conditions.
Cardiomyocytes provide the contractile force for the heart. Each myocyte contains organized cytoskeletal and contractile elements essential to contraction. The heart not only contains cardiomyocytes but also fibroblasts, connective tissue, and modified myocytes such as Purkinje fibers. Changes in any or all of these cell types can be seen in heart failure, making determination of the ultimate cause of heart dysfunction difficult. Decreased ventricular contractility of a failing heart is preceded by varying degrees of fibrous tissue build-up and hypertrophy and dysfunction of the cardiomyocytes1. Arrhythmias can be caused by dysfunction in the conducting cells2, fibrosis interrupting cardiac conduction3, or changes in the expression of ion channels in cardiomyocytes1,4. Indeed, these problems often co-exist in a complicated fashion.
Isolating and studying cardiomyocytes allows one to examine contractile and electrical dysfunction of individual myocytes in the context of overall heart function. Techniques to isolate individual cardiac myocytes were developed over 40 years ago in an effort to better study physiology of this ‘workhorse’ cell of the heart. Isolation techniques have been improved to increase yield and quality of cells, with the vital development of coronary perfusion via cannulation of the aorta, first performed in 19705. This article describes cardiomyocyte isolation followed by measurement of contractility and calcium transients using ratiometric fluorescence and cell dimensioning data acquisition software. In both genetic and environmental models of heart disease, utilizing this protocol provides key information about cell contractility, sarcomeric contractility and relaxation, calcium transients, and cytoskeletal disruption. This system is often used to test the effect of drugs on isolated cardiomyocytes6,7. We employ the system to compare contractility and calcium transients of cardiomyocytes between wild type mice and mice with a mutation leading to dilated cardiomyopathy.
Studying individual cardiac myocytes has numerous advantages over other commonly used methods to study cardiac anatomy and physiology. Echocardiography and electrocardiography provide information about the contractile function and electrical conduction of the heart overall. Neither of these methods explains the cause or nature of the dysfunction below the level of the whole organ. Measuring contractility of individual cardiomyocytes using edge-detection and sarcomere length algorithms can demonstrate that changes within the contractile cell of the heart are present within global heart dysfunction. Measuring calcium transients demonstrates the influence of changes in ion flux at a cellular level to contractile dysfunction or arrhythmias.
In addition to complementing whole organ studies, this protocol provides cells easily stained for sub-cellular components. It is possible to see cytoskeletal changes by staining tissue sections of the whole heart; however, one is only able to visualize a cross section of cells. A whole cardiomyocyte is thicker than the typical tissue section, and given the arrangement and length of the cardiomyocytes, it is difficult to see whole cells in a single section. Isolated cardiomyocytes can be fixed immediately and stained for a variety of cytoskeletal elements and ion channels. Confocal images can be compiled into full thickness z-stacks of the cell. Additionally, staining isolated cardiac myocytes allows for staining of components that are impossible to visualize in sections, such as the membrane invaginations known as t-tubules.
Cultured cell lines of cardiac myocytes do exist, some of which have similar transcriptional profiles and phenotypic features to cardiac myocytes. Some, such as the HL-1 cell line, even retain some sarcomeric organization and rudimentary contractile ability8. Despite these qualities, cultured cells lack the “box car” shape and t-tubule structure of cardiomyocytes and have less sarcomeric organization. These components are essential to the function of cardiomyocytes in vivo. In addition, using cultured cells allows genetic manipulation but not in vivo physiologic manipulation. Isolated cardiomyocytes retain their cellular organization long enough to study but are still easily imaged and even transduced9.
Isolated cardiomyocytes are extremely versatile, providing a substrate to identically analyze cells from varied experimental conditions. Isolation and physiological analysis of myocytes have been used by countless labs for a variety of experiments including studying the effect of drugs6,7 or small molecules10, environmental stressors11, infection12, illness13, or genetic mutation14,15 on contractility and/or calcium transients and studying the regulation of contractility and calcium release within a cardiomyocyte15-17. With the application of any of these stressors, changes in heart function could be due to any combination of changes in the cardiomyocytes themselves and changes in the surrounding environment of the heart, such as scarring, changes in conductivity, or changes to the extracellular matrix. This is an ideal protocol for answering research questions regarding individual myocyte structure and function in the context of heart failure from any cause.
Although it has countless advantages over other techniques, physiological analysis of isolated cardiomyocytes is not ideal for every research question. Isolation is a terminal procedure, thus cardiomyocytes can only be assessed at one time in the mouse’s life. This can be partially overcome using cohorts and sacrificing individual mice along the course of illness development or by monitoring the mouse to determine whether it has clinically significant heart failure before isolation. Although this protocol can determine whether cardiomyocyte dysfunction has occurred, one cannot draw the conclusion that this dysfunction is the root cause of heart failure without additional experimental information. It is possible that cardiomyocyte dysfunction itself is secondary to other changes in the heart. Despite these challenges, studying cardiomyocytes offers valuable information in determining the nature of dysfunction in the heart, especially when combined with other experiments.
The following protocol is adapted from one provided by Dr. Chee Lim, Vanderbilt University. Although contractility and calcium flux data are highly reproducible and useful in comparing hearts with genetic or environmental manipulation, isolation itself remains a technique dependent protocol, requiring optimization. Minimizing the time between removing the heart from the mouse and perfusing the heart via aortic cannulation is essential for a quality digestion. In addition, digestion time and enzyme concentration can be optimized for the highest quality myocytes. Steps likely requiring optimization, along with suggestions for optimization, are noted below.
Ensure all procedures involving animals are approved by the appropriate animal use and care body.
1. Prepare Stock Buffers in Advance
2. On the Day of the Experiment, Prepare Perfusion, Transfer, and Digestion Buffers
3. Experimental Setup
4. Cardiomyocyte Isolation
5. Measuring Contractility and Calcium Transients
6. Analysis
7. Further Studies
Once the contractility and transient tracings are collected (Figure 2), data are easily analyzed with the appropriate software. The whole tracing, or portions thereof can be averaged (Figure 3). Contractility can be analyzed in a variety of ways. For systolic function, one can assess the magnitude of contraction with fractional shortening, or speed of contraction with time to peak shortening, and contraction velocity. Diastolic function can be analyzed similarly with time to 50% shortening and relaxation velocity. For calcium transients, similar data can be compared including baseline and peak Fura-2 ratios and time to peak or baseline (Table 8). These analyses provide comparable data from WT and KO hearts on systolic and diastolic cellular contractile function, as well as calcium flux, any of which could be altered in a heart with similar whole organ dysfunction. Additionally, cells from the same isolation can be used for other experiments as listed in the protocol, including immunohistochemical staining (Figure 4).
Ca2+ free Tyrode | mM | FW/concentration | Amount for 2 L solution |
NaCl | 135 | 58.44 g | 15.8 g |
KCl | 4 | 74.56 g | 0.596 g |
MgCl2 | 1 | 1 M | 2 ml |
HEPES | 10 | 238.31 g | 4.77 g |
NaH2PO4 | 0.33 | 141.96 g | 0.094 g |
Table 1. Calcium-free Tyrode’s solution – Reagents for 2 L of stock Ca2+-free Tyrode’s solution.
1.2 mM Ca2+ Tyrode | mM | FW/concentration | Amount for 2 L solution |
NaCl | 137 | 58.44 g | 16 g |
KCl | 5.4 | 74.56 g | 0.805 g |
MgCl2 | 0.5 | 1 M | 1 ml |
HEPES | 10 | 238.31 g | 4.77 g |
CaCl2·2H2O | 1.2 | 147.01 g | 0.353 g |
Table 2. 1.2 mM Calcium Tyrode’s solution – Reagents for 2 L of stock 1.2 mM Ca2+ solution.
Perfusion Buffer | mM | FW | Amount in 150 ml Ca2+ free Tyrode |
Glucose | 10 | 180.16 g | 0.27 g |
2,3-Butanedione-monoxime (BDM) | 10 | 101.11 g | 0.152 g |
Taurine | 5 | 125.16 g | 0.094 g |
Table 3. Perfusion Buffer – Reagents to prepare perfusion buffer on the day of experiment.
Buffer A | 35 ml Perfusion Buffer |
Bovine serum albumin (BSA) | 0.175 g |
Table 4. Buffer A – Reagents to prepare Buffer A on the day of experiment.
Buffer B | mM | FW | 25 ml Ca2+ Tyrode buffer |
Glucose | 5 | 180.16 g | 0.0225 g |
Table 5. Buffer B – Reagents to prepare Buffer B on the day of experiment.
Transfer Buffer | Buffer A (ml) | Buffer B (ml) |
0.06 mM Ca2+ | 9.5 | 0.5 |
0.24 mM Ca2+ | 8 | 2 |
0.6 mM Ca2+ | 5 | 5 |
1.2 mM Ca2+ | 0 | 10 |
Table 6. Transfer Buffer – Reagents to prepare transfer buffer on the day of experiment.
Enzyme Digestion Buffer | 25 ml Perfusion Buffer |
Collagenase B | 0.4 mg/g body weight |
Collagenase D | 0.3 mg/g body weight |
Protease XIV | 0.05 mg/g body weight |
Table 7. Enzyme Digestion Buffer – Reagents to prepare enzyme digestion buffer on the day of experiment.
Contractility | |
Baseline | 1.73 μm |
Peak | 1.64 μm |
Fractional Shortening | 4.70% |
Time to peak | 0.056 sec |
Time to 50% baseline | 0.043 sec |
Calcium transients | |
Baseline | 1.18 |
Peak | 1.32 |
Time to peak | 0.021 sec |
Time to 50% baseline | 0.083 sec |
Table 8. Contractility and calcium transient analyses. N = 5.
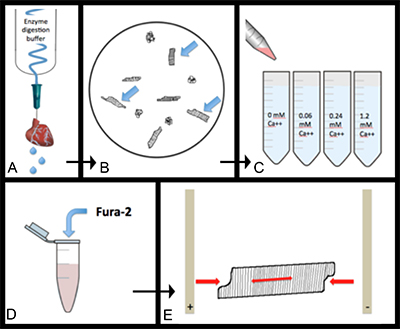
Figure 1. General overview of experimental design. A) Heart is digested via coronary perfusion with enzyme digestion buffer. B) Cells are further dispersed into individual, healthy myocytes. C) Cells are sequentially transferred through increasing calcium concentrations so cells become calcium tolerant. D) Cells are loaded with the calcium dependent dye, Fura-2 AM. E) Loaded cells are electrically paced while sarcomere length, cell length, and fluorescence are recorded. Please click here to view a larger version of this figure.
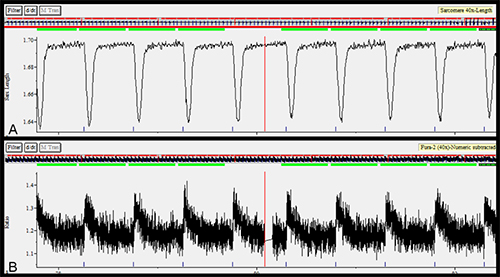
Figure 2. A) Sample contractility tracing represented by sarcomere length vs. time. B) Sample calcium transients represented by Fura-2 ratio vs. time. Please click here to view a larger version of this figure.
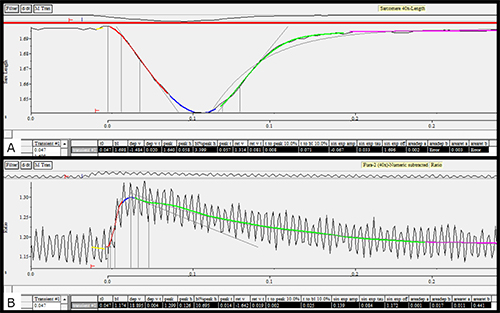
Figure 3. A) Average contractility tracing after analysis. B) Average of calcium transients after analysis. Please click here to view a larger version of this figure.
Figure 4. Immunofluorescent staining of cardiomyocyte cytoskeleton (α-actinin).
Isolation of quality cardiomyocytes requires some level of practice and optimization. This protocol contains key steps that can greatly affect the outcome of the digestion. These should be considered carefully when performing and troubleshooting the protocol. The time from removal of the heart to cannulation and perfusion should be minimized, ideally less than five minutes. Rinsing the heart immediately in ice-cold perfusion buffer after removing from the mouse and dissecting and cannulating the heart in ice-cold buffer will also increase the chances of a quality digestion. The cannulation itself is a critical step. The tip of the cannula must be placed below the first branches of the aorta but not through the aortic valve into the ventricle, as this will prevent perfusion of the coronary arteries. Coronary perfusion is essential to a quality digestion. In this laboratory, the cannula is attached to a syringe filled with perfusion buffer. Gently injecting a small amount of perfusion buffer after mounting and watching the coronary arteries clear of blood can test adequacy of the cannulation.
Troubleshooting this protocol involves carefully assessing the aforementioned critical steps. If the heart does not become palpably soft during the digestion, there are a few potential causes. First, during cannulation, the tip of the cannula may have been advanced beyond the aortic valve, preventing perfusion via the coronary arteries. This can be assessed before hanging the heart on the Langendorff apparatus but pushing a small amount of perfusion buffer through the cannula with a syringe and watching carefully for the coronary arteries to clear of blood. If perfusion is adequate but the heart does not digest well, consider purchasing different lots of enzymes. Because the enzymes are actually mixtures, lots do not act identically. We recommend purchasing small amounts of each enzyme. When lots are found that digest well, purchase larger quantities of that lot for future use. As discussed, if dissection and cannulation of the heart take longer than 5-10 min, the quality of the digested cells can be poor. Consider completing isolations with wild type or untreated animals to master the dissection before moving on to knockout or treated animals. After digestion, cells must be slowly be made calcium tolerant. Cells should spend at least 10 min in each of the calcium solutions. Rushing these steps can decrease the yield and viability of cells.
Although reproducible, the physiological measurements depend on starting with a quality digestion. When selecting cells to measure, choose cells that are not spontaneously contracting, which indicates a leaky, damaged cell membrane. Cells should contract uniformly when paced. Consider pacing cells for 10-15 sec before recording measurements to ensure contractile consistency. If cell appears to be contracting uniformly, but the measurements of contraction magnitude varies drastically over time, first check to make sure that the region of interest defined covers only one population of sarcomeres. Occasionally two cells group together and the region of interest (ROI) may be measuring two different populations of sarcomere as one. If an appropriate ROI is chosen but contractility is variable within a single cell, the cell may be dying and another cell should be chosen. For calcium transients, it is critical to dilute Fura-2 AM in desiccated anhydrous DMSO as water changes the amount of Fura-2 AM that is functionally available. After loading, allow at least 20 min between the first wash and measuring transients to allow all Fura-2 AM to de-esterify within the cell. As with any fluorescent dye, protect the cells from light during and after loading. Some cells will not uptake the dye, thus occasionally no calcium transients will be observed in a measured cell. Although contractility and calcium transients tracings may appear “cleaner” when the pacing rate is greatly reduced (0.5-1 Hz), measurements are more physiological at a rate closer to the mouse heart rate, thus a pace of at least 2 Hz is preferred.
The isolation itself can be modified if desired. This laboratory uses a constant flow method (3 ml/min for mice) during perfusion. Some groups have found a gravity flow more effective. Gravity flow perfusion allows for the digestion to be visualized more easily as the flow rate increases as the heart is digested.
As mentioned, these techniques do carry limitations. As the quality of the physiological measurements is dependent on quality of the digestion, it is prudent to measure myocytes from more than one heart for each experimental condition. Each heart will provide many myocytes to measure, but repeat digestions will ensure that results are consistent between hearts. Isolation is a terminal procedure, thus, if experimental design involves following the heart function of an animal over time, the cardiomyocytes can only be harvested once. More mice are required so a cohort can be followed longitudinally while individual mice are sacrificed to analyze cardiomyocytes.
Our focus has been studying contractility and cytoskeletal structure in a knockout mouse, however, isolated cardiomyocytes can be used for a variety of other experiments including live cell staining for t-tubules, studying cardiomyocytes from pressure or volume overloaded mice, examining the effects of pharmacological treatment, immunofluorescence, transfection9, and transcriptional profiling19. This versatile technique provides countless advantages over other methods used to study heart failure. Studying physiology of individual cells gives information that is not offered by whole organ studies such as echocardiography or electrocardiography, providing insight into the cellular changes that accompany whole organ failure. In addition, isolated cells are superior for imaging sub-cellular structures, as the whole cell can be easily stained and imaged. Isolating cardiomyocytes for analysis of contractility, calcium transients, and immunofluorescence is an extremely versatile technique that offers valuable information from a huge variety of experimental designs.
The authors have nothing to disclose.
Marc Wozniak for the use of Department of Cell and Developmental Biology videography equipment.
Vanderbilt University Cell Imaging Shared Resource.
This work is supported by AHA grant 12PRE10950005 to ERP, AHA grant 11GRNT7690040 to DMB, NIH grant R01 HL037675 to DMB. DMB is the Gladys P. Stahlman Chair in Cardiovascular Research.
NaCl | RPI | S23020 | |
KCl | Sigma | P-3911 | |
MgCl2 | Sigma | M-8266 | |
HEPES | EM Science | S320 | |
NaH2PO4 | Sigma | S5011 | |
CaCl2 Ÿ 2H2O | Fisher | C79 | |
D-(+)-Glucose | Sigma | G7528 | |
2,3-Butanedione-monoxime (BDM) | Sigma | B-0753 | |
Taurine | Sigma | T-0625 | |
Bovine Serum Albumin (BSA) | Sigma | A-7030 | |
Collagenase B | Roche Diagnostics | 1-088-823 | |
Collagenase D | Roche Diagnostics | 1-088-882 | |
Protease XIV | Sigma | P-5147 | |
Heparin | APP Pharmaceuticals, LLC | 401586D | |
Isofluorane | Butler Schein | 11695-6776-2 | |
Fura-2 AM | Teflabs | 103 | |
DMSO – anhydrous | Sigma | 276855 | |
IonOptix cell pacing and fluorescent analysis system | IonOptix | ||
250 um nylon mesh filter | Sefar America | Lab Pak 03-250/50 | |
23G leur-stub adaptor | Becton Dickinson | 1482619E | |
PE-50 tubing | Becton Dickinson | 427410 |