This protocol presents a novel, robust, and reproducible culture system to generate and grow three-dimensional spheroids from Caco2 colon adenocarcinoma cells. The results provide the first proof-of-concept for the appropriateness of this approach to study cancer stem cell biology, including the response to chemotherapy.
Method Article
A Three-dimensional Model of Spheroids to Study Colon Cancer Stem Cells
In This Article
Summary
Abstract
Colorectal cancers are characterized by heterogeneity and a hierarchical organization comprising a population of cancer stem cells (CSCs) responsible for tumor development, maintenance, and resistance to drugs. A better understanding of CSC properties for their specific targeting is, therefore, a pre-requisite for effective therapy. However, there is a paucity of suitable preclinical models for in-depth investigations. Although in vitro two-dimensional (2D) cancer cell lines provide valuable insights into tumor biology, they do not replicate the phenotypic and genetic tumor heterogeneity. In contrast, three-dimensional (3D) models address and reproduce near-physiological cancer complexity and cell heterogeneity. The aim of this work was to design a robust and reproducible 3D culture system to study CSC biology. The present methodology describes the development and optimization of conditions to generate 3D spheroids, which are homogenous in size, from Caco2 colon adenocarcinoma cells, a model that can be used for long-term culture. Importantly, within the spheroids, the cells which were organized around lumen-like structures, were characterized by differential cell proliferation patterns and by the presence of CSCs expressing a panel of markers. These results provide the first proof-of-concept for the appropriateness of this 3D approach to study cell heterogeneity and CSC biology, including the response to chemotherapy.
Introduction
Colorectal cancer (CRC) remains the second leading cause of cancer-associated deaths in the world1. The development of CRC is the result of a progressive acquisition and accumulation of genetic mutations and/or epigenetic alterations2,3, including the activation of oncogenes and inactivation of tumor suppressor genes3,4. Moreover, non-genetic factors (e.g., the microenvironment) can contribute to and promote oncogenic transformation and thus participate in the evolution of CRCs5. Importantly, CRCs are composed of different cell populations, including undifferentiated CSCs and bulk tumor cells displaying some differentiation traits, which constitute a hierarchical structure reminiscent of the organization of the epithelium in a normal colon crypt6,7.
CSCs are considered to be responsible for tumor appearance8, its maintenance and growth, metastatic capacity, and resistance to conventional therapies6,7. Within tumors, cancer cells, including CSCs, display a high level of heterogeneity and complexity in terms of their distinct mutational and epigenetic profiles, morphological and phenotypic differences, gene expression, metabolism, proliferation rates, and metastatic potential9. Therefore, to better understand cancer biology, tumor progression, and acquisition of resistance to therapy and its translation into effective treatments, human preclinical models capturing this cancer heterogeneity and hierarchy are important10,11.
In vitro 2D cancer cell lines have been used for a long time and provide valuable insights into tumor development and the mechanisms underlying the efficacy of therapeutic molecules. However, their limitation with respect to the lack of the phenotypic and genetic heterogeneity found in the original tumors is now widely recognized12. Moreover, nutrients, oxygen, pH gradients, and the tumor microenvironment are not reproduced, the microenvironment being especially important for the maintenance of different cell types including CSCs11,12. To overcome these main drawbacks, several 3D models have been developed to experimentally address and reproduce the complexity and heterogeneity of cancers. In effect, these models recapitulate tumor cellular heterogeneity, cell-cell interactions, and spatial architecture, similar to those observed in vivo12,13,14. Primary tumor organoids established from fresh tumors, as well as cell line-derived spheroids, are largely employed15,16.
Spheroids can be cultured in a scaffold-free or scaffold-based manner to force the cells to form and grow in cell aggregates. Scaffold-free methods are based on the culture of cells under non-adherent conditions (e.g., the hanging-drop method or ultra-low attachment plates), whereas scaffold-based models rely on natural, synthetic, or hybrid biomaterials to culture cells12,13,14. Scaffold-based spheroids present different disadvantages as the final spheroid formation will depend on the nature and composition of the (bio)material used. Although the scaffold-free spheroid methods available so far do not rely on the nature of the substrate, they generate spheroids that vary in structure and size17,18.
This work was aimed at designing a robust and reproducible 3D culture system of spheroids, which are homogenous in size, composed of Caco2 colon adenocarcinoma cells to study CSC biology. Caco2 cells are of particular interest owing to their capacity to differentiate over time19,20, strongly suggesting a stem-like potential. Accordingly, long-term culture of the spheroids revealed the presence of different CSC populations with different responses to chemotherapy.
Protocol
NOTE: The details of all reagents and materials are listed in the Table of Materials.
1. Spheroid formation
- Spheroid culture media
- Prepare basal medium consisting of Dulbecco's Modified Eagle Medium (DMEM) supplemented with 4 mM L-alanyl-L-glutamine dipeptide.
- Prepare DMEM complete medium containing 10% fetal bovine serum (FBS) and 1% penicillin-streptomycin (Pen/Strep) in basal medium from step 1.1.1.
- Prepare DMEM/basement membrane matrix medium containing 2.5% basement membrane matrix, 10% FBS, and 1% Pen/Strep in basal medium from step 1.1.1.
- Preparation of plates for spheroid formation
- Warm basal and DMEM/basement membrane matrix medium at room temperature (RT) for approximately 20 min.
- Pretreat the wells of a 24-well plate dedicated to spheroid formation by adding 500µL of anti-adherence rinsing solution to each well.
NOTE: In these plates, each well consists of 1,200 microwells. - Centrifuge the plate at 1,200 × g for 5 min in a swinging bucket rotor with adaptors for plates.
NOTE: If only one plate is used, prepare an additional standard plate filled with water to counterbalance the weight. - Rinse each well with 2 mL of warm basal medium, and aspirate the medium from the wells.
- Observe the plate under the microscope to ensure that bubbles have been completely removed from the microwells. If bubbles remain trapped, centrifuge again at 1,200 × g for 5 min to eliminate the bubbles.
- Repeat the rinsing steps 1.2.4-1.2.5.
- Add 1 mL of warm DMEM/basement membrane matrix medium to each well.
- Generation of spheroids
- Grow the Caco2 cells in a 2D monolayer in DMEM medium supplemented with 10% FBS and 1% Pen/Strep at 37 °C in a humidified atmosphere containing 5% CO2 (hereafter referred to as 37 °C/5% CO2).
NOTE: The maximum number of cell passages to be used is 80. - When 80% of confluency is reached, wash the cells with phosphate-buffered saline (PBS) 1x (5 mL for a 10 cm dish), add trypsin-ethylenediamine tetraacetic acid (EDTA) (2 mL for a 10 cm dish), and incubate for 2-5 min at 37 °C/5% CO2.
- Check cell detachment under the microscope, and neutralize the trypsin by adding 4 mL of DMEM complete medium per 10 cm dish.
- Count cells using a hemocytometer to determine the total number of cells.
- Centrifuge the cell suspension at 1,200 × g for 5 min. Discard the supernatant, and resuspend the pellet in an appropriate volume of DMEM/basement membrane matrix medium.
- Refer to Table 1 to determine the number of cells required per well to achieve the desired number of cells per microwell. Alternatively, calculate the number of cells using the following formula for a 24-well plate, considering each well contains 1,200 microwells
Required number of cells per well = Desired number of cells per microwell × 1,200 - Add the required volume of the cell suspension to each well to achieve the desired cell number in a final volume of 1 mL.
- Add 1 mL of DMEM/basement membrane matrix medium to each well to reach the final volume of 2 mL per well (see also step 1.2.7).
NOTE: Be careful not to introduce bubbles into the microwells. - Centrifuge the plate immediately at 1,200 × g for 5 min to capture the cells in the microwells. If necessary, counterbalance the centrifuge with a standard plate filled with water.
- Observe the plate under the microscope to verify that the cells are evenly distributed among the microwells.
- Incubate the plate at 37 °C/5% CO2 for 48 h without disturbing the plate.
NOTE: According to the original protocol21, although many cell lines can form spheroids within 24 h, some require a longer incubation time. In this protocol, 48 h are sufficient for spheroid formation.
- Grow the Caco2 cells in a 2D monolayer in DMEM medium supplemented with 10% FBS and 1% Pen/Strep at 37 °C in a humidified atmosphere containing 5% CO2 (hereafter referred to as 37 °C/5% CO2).
- Harvesting the spheroids from the microwells
- Warm the basal and DMEM/basement membrane matrix medium at RT for approximately 20 min.
- Using a serological pipette, remove half of the culture medium (1 mL) from each well.
- Add the medium back onto the surface of the well to dislodge the spheroids from the microwells.
NOTE: Do not touch or triturate the spheroids. - Place a 37 µm reversible strainer (or a 40 µm standard strainer) on the top of a 15 mL conical tube to collect the spheroids.
NOTE: If using a 40 µm standard strainer, place it upside down. - Gently aspirate the dislodged spheroids (from step 1.4.3), and pass the spheroid suspension through the strainer.
NOTE: The spheroids will remain on the filter; single cells will flow through with the medium. - Using a serological pipette, dispense 1 mL of the warm basal medium across the entire surface of the well to dislodge any remaining spheroids and recover them on the strainer.
- Repeat this washing step 1.4.6 twice.
- Observe the plate under the microscope to ensure that all spheroids have been removed from the microwells. Repeat the wash if necessary (steps 1.4.6-1.4.7).
- Invert the strainer, and place it on a new 15 mL conical tube. Collect the spheroids by washing the strainer with DMEM/basement membrane matrix medium.
NOTE: The collected spheroids are ready for downstream applications and analyses.
- Long-term culture of spheroids
- Prepare 1.5% agarose solution in basal medium, and sterilize it by autoclaving (standard cycle).
- While the agarose solution is warm and still liquid, coat the wells of standard culture plates or dishes, as described in Table 2.
NOTE: Warming the dish/plate in the oven will facilitate the coating step. Coated dishes/plates can be left at RT for up to 10 days in a sterile environment and protected from the light. - Seed the harvested spheroids (from step 1.4.9) in the agarose-coated plates, and add DMEM/basement membrane matrix medium to achieve the final volume depending on the size of the plate.
NOTE: To avoid spheroid aggregates, seed them at the optimal density of 22 spheroids/cm2. Observe that the coating is not perfectly flat, and it rises towards the edge, creating a light concavity at the center of the plate. If the number of spheroids is too high, they are more likely to adhere to each other. - Incubate the plate at 37 °C/5% CO2 until recovery of the spheroids for specific analyses.
- Treatment of spheroids with chemotherapeutic drugs
- Plate spheroids from step 1.5.4, and grow them for 2 days. Starting from day 3 (D3), treat them with FOLFIRI (5-Fluorouracil, 50 µg/mL; Irinotecan, 100 µg/mL; Leucovorin, 25 µg/mL) or with FOLFOX (5-Fluorouracil, 50 µg/mL; Oxaliplatin, 10 µg/mL; Leucovorin, 25 µg/mL) chemotherapeutic regimen combinations routinely used to treat CRC patients22,23,24,25, or maintain them in (control) not-treated (NT) condition.
- Collect the spheroids after 3 days of treatment by using a pipette with the tip cut off (1,000 µL tip), ensuring that each condition is represented by at least three replicates. Centrifuge them at 1,000 × g for 3 min, and then remove the supernatant.
- Fix the pellets in 2% paraformaldehyde (PFA) for histological analysis (see section 3), or use the pellets for RNA extraction (see section 4).
- To analyze cell death, incubate the spheroids from step 1.6.1 in black culture well plates in DMEM/basement membrane matrix medium for 30 min with a nucleic acid stain (1:5000 dilution) that does not permeate live cells, but penetrates the compromised membranes of dead cells26. Measure the accumulation of fluorescence with a microplate reader.
2. Monitoring spheroid growth
- Using an inverted microscope, acquire representative images of spheroids maintained under different conditions throughout the days in culture.
- Analyze the images by measuring three different representative diameters of each spheroid using appropriate software.
- Use the following formula to obtain the estimated sphere volume.

NOTE: The terms, d1, d2, and d3, are the three diameters of the spheroid.
3. Immunofluorescence (IF) and histological staining
- Fixation and paraffin embedding
- Collect the spheroids at selected time-points using a pipette with the tip cut off as described in step 1.6.2, and fix them for 30 min at RT in 2% PFA.
NOTE: Alternatively, store the samples at this step at 4 °C until further use. - For paraffin embedding, wash the spheroids 3x with PBS 1x, and resuspend them in 70% ethanol. After paraffin inclusion and sectioning, perform hematoxylin & eosin (H&E) staining for histological analysis.
- Collect the spheroids at selected time-points using a pipette with the tip cut off as described in step 1.6.2, and fix them for 30 min at RT in 2% PFA.
- Immunolabeling of paraffin sections
NOTE: Use 5-μm-thick sections for indirect immunostaining.- Incubate slides at 60 °C for 2 h to melt the wax and improve deparaffinization.
- Wash the slides twice for 3 min in methylcyclohexane.
- Wash the slides for 3 min in 1:1 methylcyclohexane:100% ethanol.
- Wash the slides twice for 3 min in 100% ethanol.
NOTE: Perform all manipulations for step 3.2.2 to step 3.2.4 in a chemical hood. - Wash the slides for 3 min in 90% ethanol.
- Wash the slides for 3 min in 75% ethanol.
- Wash the slides for 3 min in 50% ethanol.
- Wash the slides under tap water.
- Rehydrate the slides in distilled water for 5 min.
- Prepare 700 mL of 0.01 M citrate buffer, pH 6.0, and add it to a suitable container (width: 11.5 cm, length: 17 cm, height: 7 cm); submerge the slides in it. Heat the container in the microwave for 9-10 min at 700 W, and when the boiling starts, decrease the power to 400-450 W. Incubate for an additional 10 min.
- Let the slides cool down in the buffer to RT for approximately 30-40 min.
- Wash the slides twice in PBS for 5 min.
- Draw a circle around the sections with a marker pen to create a barrier for liquids applied to the sections.
- Incubate each section with 50 µL of blocking buffer (10% normal goat serum, 1% bovine serum albumin (BSA), and 0.02% Triton X-100 in PBS) for at least 30 min at RT.
- Remove the blocking buffer, and add 50 µL of primary antibodies diluted in the incubation buffer (1% normal goat serum, 0.1% BSA, and 0.02% Triton X-100 in PBS). Incubate for 2 h at RT or overnight at 4 °C.
- Remove the primary antibodies, and wash the slides 3x in PBS for 5 min.
- Incubate the slides with 50 µL of fluorescent secondary antibodies diluted in the incubation buffer for 1 h at RT.
- Remove the secondary antibodies, and wash the slides 3x in PBS for 5 min.
- Add 50 µL of mounting medium with 4′,6-diamidino-2-phenylindole to each section, and place a glass coverslip over the section.
4. RNA extraction, reverse transcription-polymerase chain reaction (RT-PCR), and quantitative RT-PCR (qRT-PCR)
- Collect spheroids at different time-points, each point represented by at least three replicates. Centrifuge them at 1,000 × g for 3 min, and then remove the supernatant.
NOTE: Pellets can be directly used for RNA extraction or stored at -20 °C until further use. - Isolate the total RNA using a commercial RNA isolation kit, according to the manufacturer's instructions.
- Reverse-transcribe 500 ng of each RNA sample into complementary DNA (cDNA) with a commercial kit according to the manufacturer's instructions.
- After reverse transcription, perform a PCR analysis on 1 µL of cDNA to amplify a housekeeping gene with primers located in different exons.
NOTE: This step enables the verification of the absence of any genomic DNA contamination in the RNA preparations. For this protocol, peptidylprolyl isomerase B (PPIB) primers were used. - Perform qPCR amplification on 4 µL of previously diluted cDNA (1:10 in RNAse-free double-distilled water) by using primers specific for the genes of interest. In each sample, quantify specific mRNA expression by using the ΔΔCt method and values normalized against a housekeeping gene levels.
NOTE: For this protocol, β-actin (ACTB) was selected. Primers used in this protocol are listed in Table 3.
Results
As the lack of homogeneity in the size of spheroids is one of the main drawbacks of currently available 3D spheroid culture systems13, the aim of this work was to set up a reliable and reproducible protocol to obtain homogenous spheroids. First, to establish ideal working conditions, different numbers of Caco2 cells were tested, ranging from 50 to 2,000 cells per microwell/spheroid using dedicated plates (Table 1). In effect, each well in these plates contains 1,200 microwells, enabling the formation of the same number of spheroids per well, and more importantly, the formation of one spheroid per microwell21. After two days of culture, the wells containing 2,000 cells per spheroid grew as a monolayer, and 50 cells per spheroid gave rise to small and non-homogenous spheroids (Figure 1A). These two conditions were therefore excluded from further analyses. To establish long-term cultures, spheroids were harvested from the microwells and seeded under non-adherent conditions in freshly prepared agarose-coated plates. Spheroid growth was then monitored throughout the experimental time-course by measuring the change in volume. To take into account the non-spherical shape, three different diameters of each spheroid were measured, and the volume formula was applied27 (Figure 1B). Spheroids generated from 100 and 200 cells maintained their initial size over the entire course of the experiment, whereas those containing 1,000 cells disintegrated during harvesting due to their large size and, consequently, presented more variability in their volume. Therefore, as spheroids arising from 500 cells showed the most homogenous increase in size over the experimental time-course, this number of cells was used for spheroid formation.
Second, besides 500 cells per spheroid, additional cell numbers ranging from 300 to 800 cells were studied. Moreover, to improve the non-adherent conditions, the original protocol was modified by pretreating the wells twice instead of applying only one wash. An improvement in spheroid homogeneity and compaction was observed with these changes (Figure 2A). The size of the spheroids in each condition was measured at the time of harvest (Figure 2B), and their long-term growth was monitored throughout the days in culture in agarose-coated dishes (Figure 2C). Based on the results, 500 and 600 cells/spheroid were confirmed as the optimal conditions yielding good growth and low variability. Owing to the more homogenous growth profile throughout the experimental time-course and the compact structures formed, 600 cells per spheroid was selected as the cell number for subsequent experiments. Finally, to further improve the protocol, DMEM complete medium was supplemented with 2.5% of basement membrane matrix, which contains additional growth factors and a large panel of extracellular matrix proteins28. Indeed, the multilobular shape of the spheroids could be due to the lack of signals from the microenvironment that may have affected cell polarization29,30. The addition of basement membrane matrix enhanced spheroid growth and improved their homogeneity (Figure 2D). An example of this improvement can be seen for 500 cells per spheroid. In the absence of the basement membrane matrix (Figure 1B), the size of the spheroids was more heterogeneous, doubling from D3 to D7 and then reaching a plateau. However, in the presence of the basement membrane matrix (Figure 2C), the size of the spheroids at each time-point was more homogeneous, increasing proportionally over time.
To analyze long-term features of the spheroids, they were recovered at different time-points after culture in agarose-coated dishes for detailed histological and IF analyses on paraffin sections. H&E staining showed that cells within the spheroids underwent changes in their organization and shape over time. Indeed, cells were densely arranged in multilayers at D3, while flattened cells arranged in monolayers were clearly visible at D10. Interestingly, as indicated by the black dotted lines in the images, a lumen appeared within the spheroids from D5 onwards (Figure 3). In parallel, cell proliferation and apoptosis were analyzed by IF using the proliferation marker, proliferating cell nuclear antigen (PCNA), and the cell death marker, activated caspase 3. Labeling for PCNA revealed that proliferating cells were often present at the outer surface of the spheroids, sometimes in crypt-like or bud-like structures reminiscent of organoid cultures15. In addition, a clear increase in PCNA-positive cells at D5 and D7 was observed that declined by D10 (Figure 4, left panels). Surprisingly, activated caspase 3 was observed in very few cells in the spheroids at both D3 and D5 (Figure 4, left panels) and over longer periods of time (data not shown). The expression pattern of β-catenin was also evaluated in paraffin sections. Interestingly, high levels of β-catenin expression were observed at each time-point with clear membrane-bound and cytoplasmic staining (Figure 4, right panels). It is worth noting that membrane-bound β-catenin participates in cell-cell adhesion by binding to E-cadherin31. A high level of ß-catenin labeling was noted in clusters of cells at all time-points. In some cases, cells also displayed clear nuclear ß-catenin localization (Figure 4, right panels). Caco2 cells are known to differentiate in vitro in 2D mainly into enterocytes19,32. However, the expression of differentiation markers, such as chromogranin A (enteroendocrine cells), lysozyme (Paneth cells) or mucin 2 (MUC 2, goblet cells), was undetectable in these spheroids by IF (data not shown). However, the potential to differentiate into enterocytes was confirmed, given that the spheroids expressed ALPI (alkaline phosphatase) and solute carrier family 2, transcript variant 2 (SLC2A5)/glucose transporter 5 (GLUT5) mRNAs (Figure 5). These mRNA levels increased at D5 and D7, but the difference was either not significant (ALPI) or only marginally significant (SLC2A5) compared to the levels at D3.
With the final aim of defining whether the spheroids generated and cultured based on this new method are a reliable tool to study CSCs, the expression of CSC markers was analyzed by IF and qRT-PCR. CD133 and CD44 characterize cancer cell populations including CSCs7,33,34 and are also expressed by SCs in the normal intestine and colon33,34,35. Clusters of CD133-positive cells were mainly localized on the external surface of the spheroids at each time-point (Figure 6A, left panels). CD44-positive cells were less frequent, but were always associated with CD133-positive cells (Figure 6A, right panels), indicating the existence of a population of CD133/CD44 double-positive CSC-like cells and a population expressing only CD133. Olfactomedin 4 (OLFM4) and Musashi 1 (MSI1) were examined as SC/CSC markers; these markers are expressed in a very limited manner in colon crypts36,37 and also in distinct cell populations35,38. Only a few MSI1-positive cells were observed at each time-point (Figure 7), whereas OLFM4 remained undetectable (data not shown). Nevertheless, as observed for CD44 and CD133, MSI1-labeled cells were located on the external surface of the spheroids in crypt-like or bud-like structures. The same markers were also analyzed at the mRNA level at the same time-points after culture in agarose-coated dishes. Aldehyde dehydrogenase 1 (ALDH1a1), a well-characterized marker of CSCs39,40, was also included in the study (Figure 8). The analysis of prominin-1 (PROM1 encoding for CD133) and CD44 mRNAs confirmed the expression of both markers in spheroids at all time-points analyzed. Of note, however, while PROM1 mRNA levels were quite similar over time in culture, CD44 levels decreased from D3 onwards. The difference, however, was only marginally significant when comparing the mRNA levels of D10 and D3.
The analysis of MSI1 mRNA confirmed its expression in spheroids at each time-point, with significantly higher levels at D3 and D5 compared with those at D7 or D10 (Figure 8), whereas OLFM4 mRNA was not detectable (not shown). Finally, ALDH1a1 mRNA was expressed in spheroids at each time-point and showed an expression profile that declined at D10, the levels being only marginally significant compared to those at D3 (Figure 8). To validate the appropriateness of the new model to study cancer cell biology, the response to chemotherapy was analyzed in spheroids treated with FOLFOX or FOLFIRI, combination therapies routinely administered to CRC patients22,23,24,25. First, the efficacy of the treatments in inducing cell death was examined by incubating the spheroids with a fluorescent nucleic acid stain that specifically enters into dead cells26. Compared to the control NT condition, the treatment with each of the drugs induced significant cell death measured by the accumulation of fluorescence (Figure 9A). This observation was also confirmed at the morphological level using live microscopy, which showed that the treatments strongly affected the size and the appearance of the spheroids (Figure 9B). Finally, the expression of SC/CSC markers was analyzed by qRT-PCR in spheroids under the same conditions (Figure 9C). Intriguingly, a significant decrease in PROM1 mRNA levels under both FOLFOX and FOLFIRI conditions was observed in comparison to the levels for the control, whereas MSI1 levels were not affected by the treatments. Furthermore, whereas FOLFOX had no effect on ALDH1a1 mRNA expression compared to the control, treatment with FOLFIRI significantly increased its levels. OLFM4 mRNA was not detected, and CD44 mRNA levels were extremely low (data not shown).
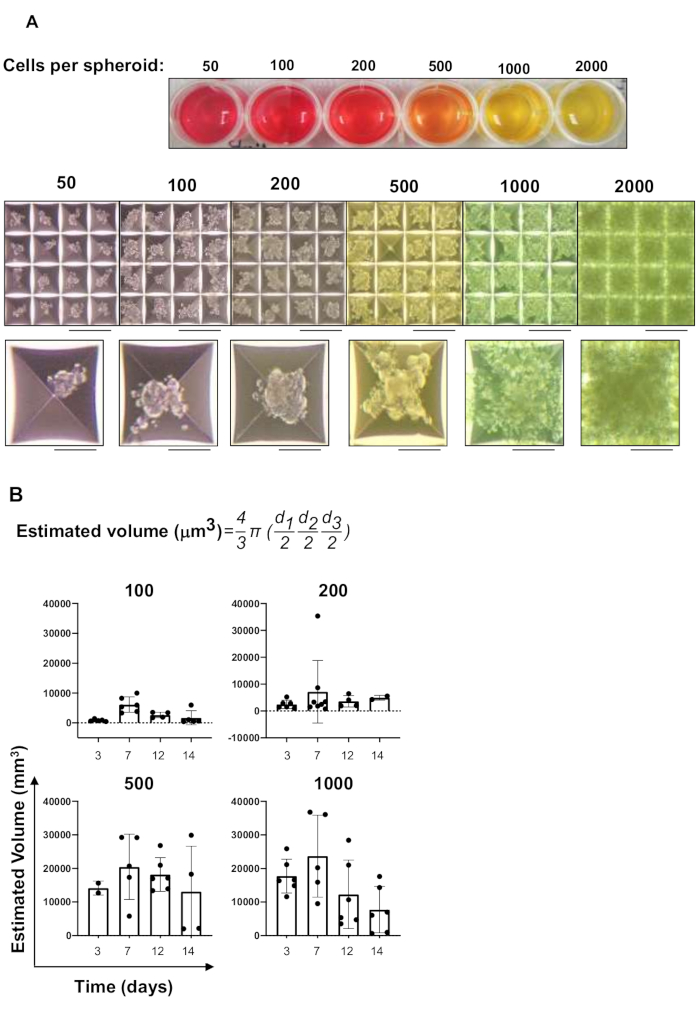
Figure 1: Setup of spheroid cultures. (A) Spheroid formation initiated from the indicated concentrations of Caco2 cells per spheroid/microwell. The top panel shows a representative image of a whole culture plate after two days of culture. The bottom panel shows images of selected microwells per condition. Images were taken at 4x magnification (microwell size: 400 μm). Scale bars: low magnification, 100 μm; high magnification, 30 μm. (B) Growth characteristics of the spheroids generated from different number of cells per microwell and analyzed at different time-points. Note that the indicated days include the first two days of culture in the microwells and the subsequent culture of the harvested spheroids in agarose-coated plates. Histograms show mean ± standard deviation, n = 4–6. Black circles show the values for individual spheroids. The formula for the estimated volume is shown in the upper part of the panel, where d1, d2, and d3 indicate the three diameters measured for each spheroid. Please click here to view a larger version of this figure.
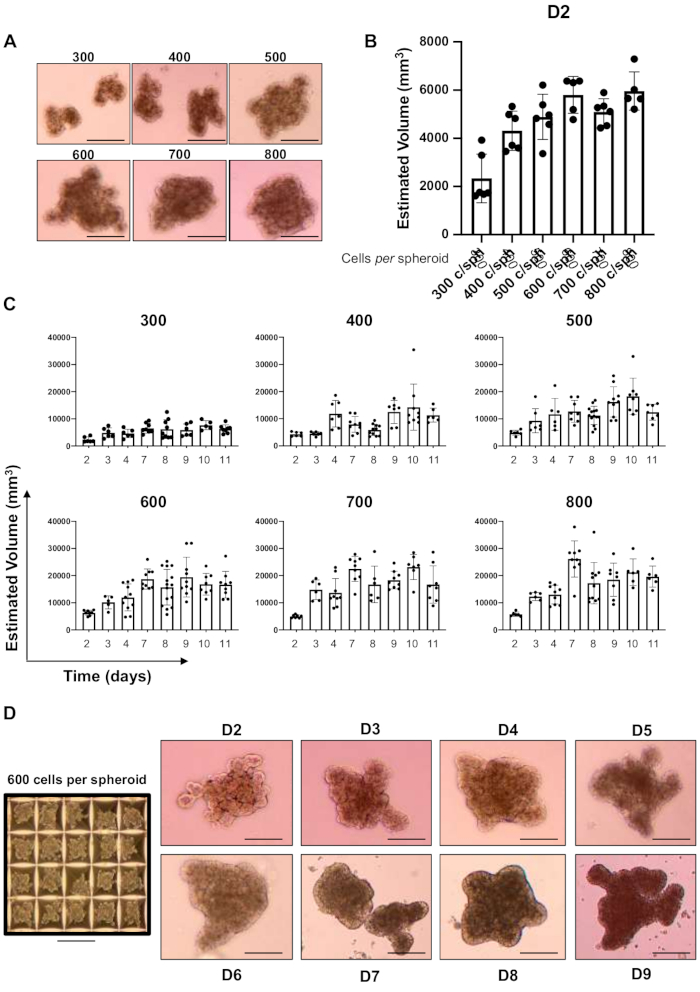
Figure 2: Optimization of the conditions for spheroid formation and culture. (A) Representative images of spheroids at D7 after their recovery from the microwells (2 days) and culture in agarose-coated dishes (5 days), using new well preparation and culture medium conditions. Scale bar: 30 μm. (B) Estimated volume of the freshly harvested spheroids two days after the start of cell culture in the microwells. Histograms show mean ± standard deviation (SD), n = 4–6. Black circles indicate the size of the individual spheroids. (C) Estimated volume of the spheroids in long-term culture based on the newly selected conditions. Graphs show the growth characteristics of the spheroids generated from different number of cells per spheroid and analyzed at different time-points after their harvesting, as indicated. Histograms show mean ± SD, n = 6–10. Black circles indicate the size of the individual spheroids. (D) Representative images of the chosen 600 cells per spheroid condition over the experimental time-course (right panels) and within the microwells (left panel). Images were taken at 4x magnification. Scale bars: low magnification, 100 μm; high magnification, 30 μm. Please click here to view a larger version of this figure.
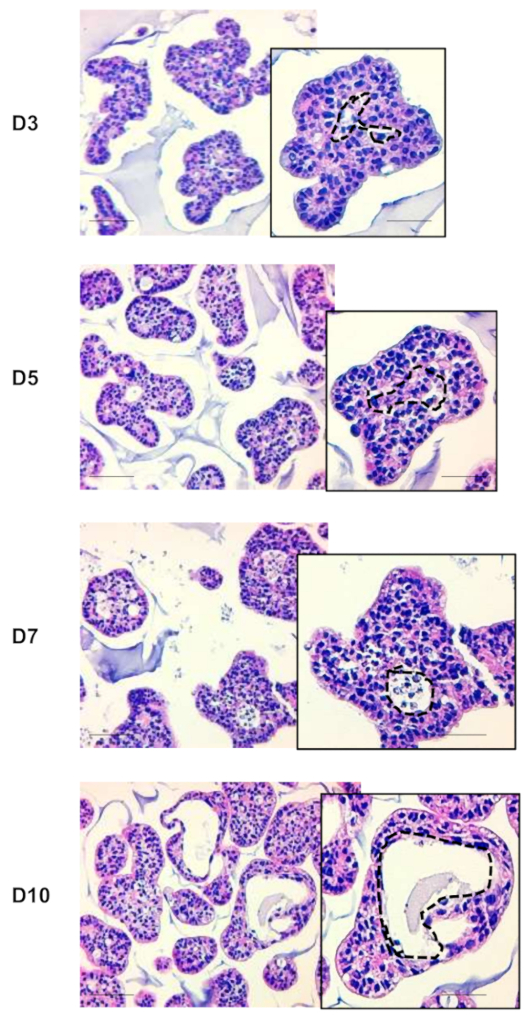
Figure 3: Histological characterization of the spheroids. Histological hematoxylin and eosin (H&E) staining of paraffin sections. Representative images of spheroids at the indicated time-points after harvesting, as indicated. Black dotted lines in each high magnification inset delimit the lumen within the spheroids. Scale bars: low magnification, 30 μm; high magnification, 10 μm. Please click here to view a larger version of this figure.
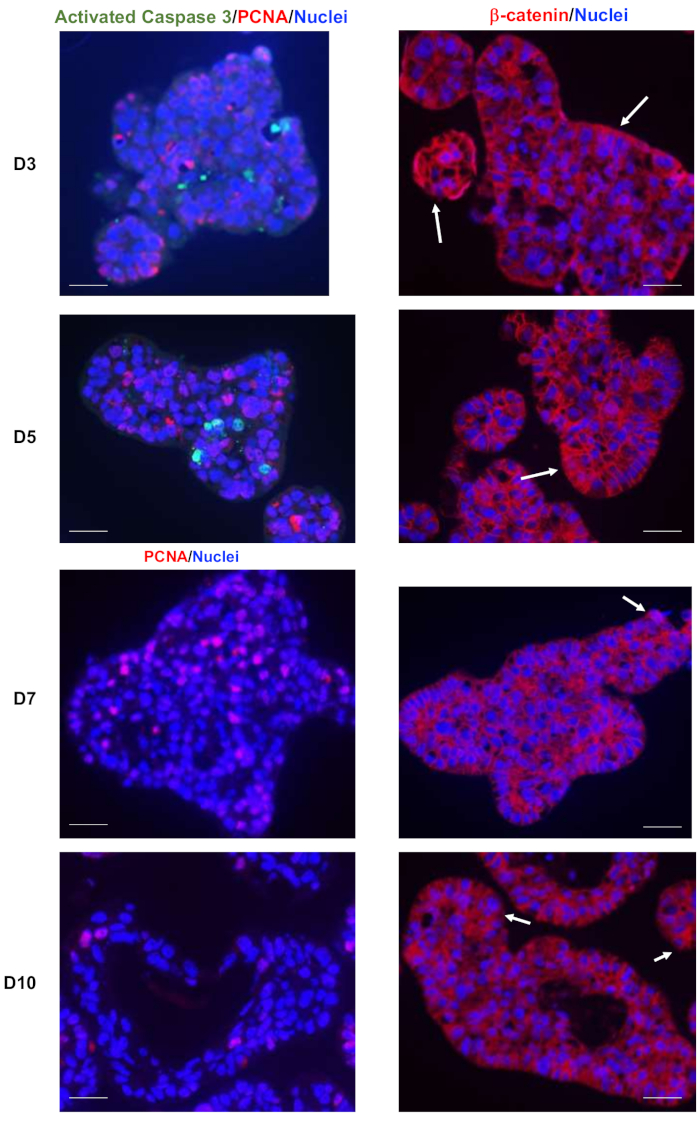
Figure 4: Caco2 spheroid characterization by immunolabeling. Immunostaining of spheroids for proliferation marker, proliferating cell nuclear antigen (PCNA, red), and cell death marker, activated caspase 3 (green) (left panels) and for β-catenin (red) (right panels) at the indicated times. Images show merged labeling of PCNA (red), activated caspase 3 (green), and nuclei (blue) or of β-catenin (red) and nuclei (blue). White arrows point to cells or groups of cells expressing high levels of β-catenin. Images were taken with a 20x objective. Scale bar: 5 μm. Please click here to view a larger version of this figure.
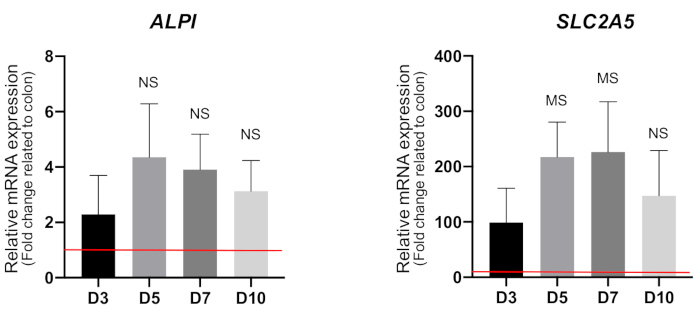
Figure 5: Analysis of enterocyte differentiation markers by qRT-PCR. Analysis of ALPI and SLC2A5 encoding alkaline phosphatase and GLUT5 proteins, respectively. Histograms show mean ± standard deviation, n = 3, after normalization against ACTB. Data are represented as fold change relative to normal colon mucosa (red line = 1). NS: not significant; MS: marginally significant compared with D3 by unpaired Student’s t-test. Abbreviations: qRT-PCR = quantitative reverse transcription-polymerase chain reaction; GLUT5 = glucose transporter 5; SLC2A5 = solute carrier family 2, transcript variant 2; ACTB = β-actin. Please click here to view a larger version of this figure.
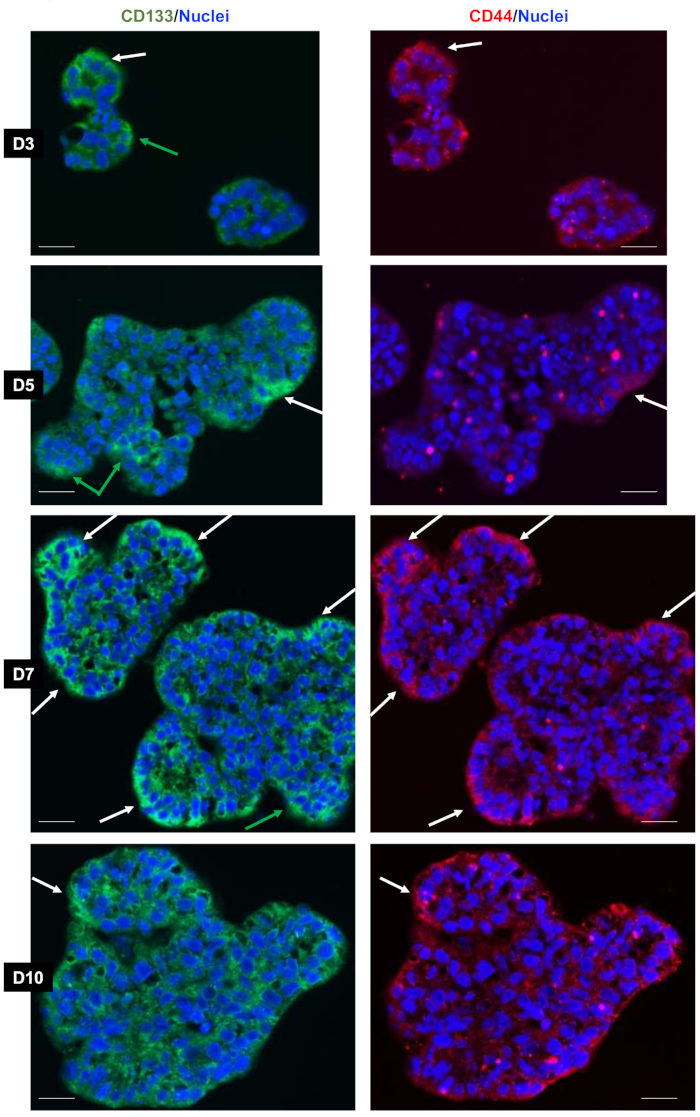
Figure 6: Heterogeneous expression of stem cell markers,CD44 and CD133, in the spheroids. Immunostaining for the stem cell markers, CD133 and CD44, at the indicated times. Images in the left panels show merged labeling of CD133 (green) and nuclei (blue); the same images in the right panels show merged labeling of CD44 (red) and nuclei (blue). Green arrows in the left panels point to CD133-expressing cells, and white arrows in both panels point to cells or groups of cells expressing CD44 and CD133. Images were acquired with a 20x objective. Scale bar: 5 μm. Please click here to view a larger version of this figure.
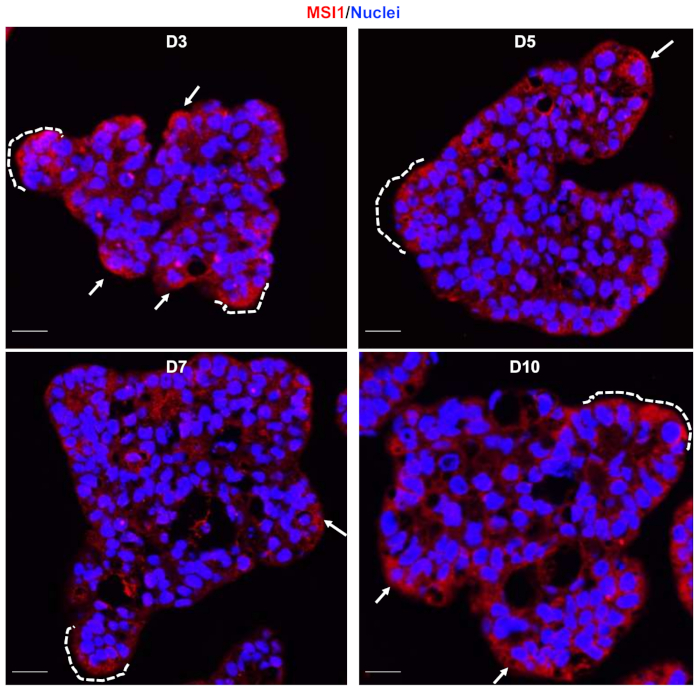
Figure 7: Heterogeneous expression of stem cell marker, MSI1, in the spheroids. Immunostaining for the stem cell marker MSI1 (red) at the indicated times. Images show merged labeling of MSI1 (red) and nuclei (blue). White dotted lines underline some crypt-like structures where cells are positive for MSI1 immunolabeling. Images were taken at 20x magnification. Scale bar: 5 μm. Abbreviation = MSI1 = Musashi 1. Please click here to view a larger version of this figure.
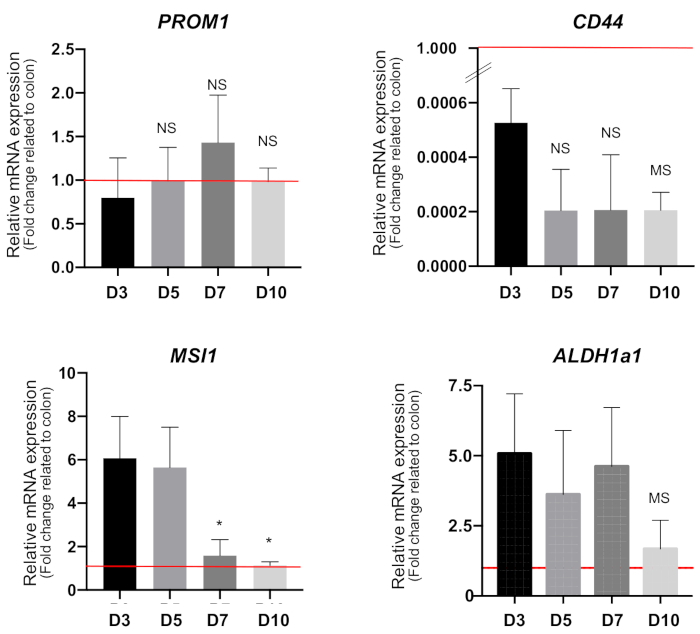
Figure 8: Analysis of stem cell markers by qRT-PCR. Quantification of PROM1, CD44, MSI1, and ALDH1a1 levels was performed on mRNA from spheroids at the indicated times. Histograms show mean ± standard deviation, n = 3, after normalization against ACTB. Data are represented as fold change relative to normal colon mucosa (red line = 1). NS: not significant; MS: marginally significant compared with D3, using unpaired Student’s t-test. *: P < 0.05 compared with D3 or D5, using unpaired Student’s t-test. Abbreviations: qRT-PCR = quantitative reverse transcription-polymerase chain reaction; PROM1 = prominin-1; MSI1 = Musashi 1; ALDH1α1 = aldehyde dehydrogenase 1 alpha; ACTB = β-actin. Please click here to view a larger version of this figure.
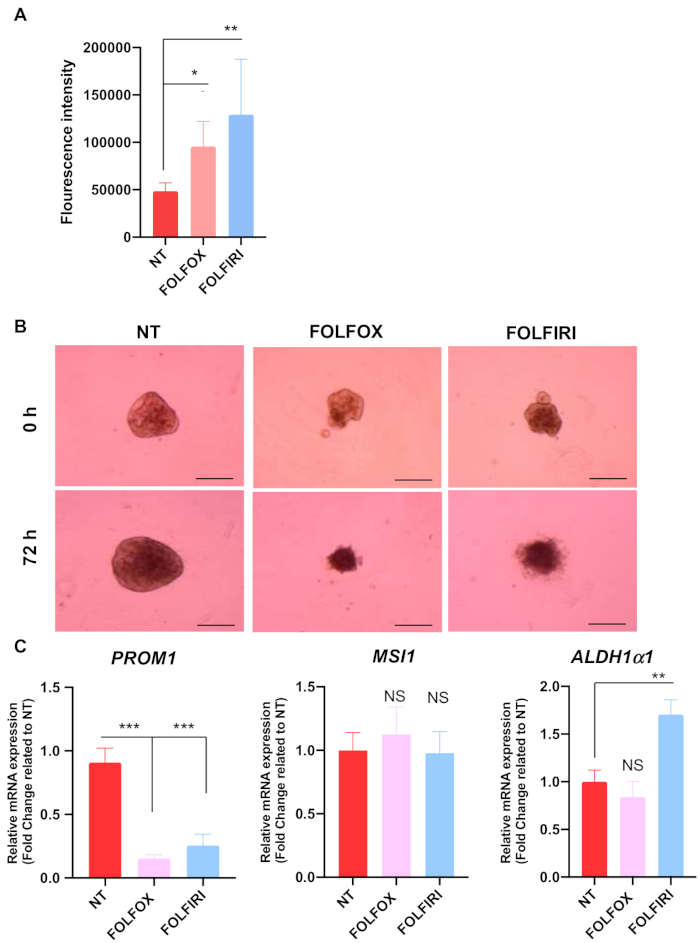
Figure 9: Effect of chemotherapy on spheroids. After harvesting from the microwells, spheroids were cultured in agarose-coated plates and treated for 3 days with FOLFOX or FOLFIRI or were maintained in (control) non-treated (NT) condition. (A) Analysis of fluorescence due to labeling of nucleic acid in dead cells. Histograms show mean ± standard deviation (SD), n = 4. (B) Morphological features of the spheroids maintained in the different culture conditions. Images were taken with a 4x objective. Scale bar: 400 μm. (C) Quantification of PROM1, MSI1, and ALDH1a1 mRNAs by qRT-PCR. Histograms show mean ± SD, n = 4, after normalization against ACTB. *: NS: not significant; P < 0.05; **: P < 0.01; ***: P < 0.001 compared to the control (NT) condition, using unpaired Student’s t-test. Abbreviations: FOLFOX = 5-Fluorouracil, 50 µg/mL; Oxaliplatin, 10 µg/mL; Leucovorin, 25 µg/mL ; FOLFIRI = 5-Fluorouracil, 50 µg/mL; Irinotecan, 100 µg/mL; Leucovorin, 25 µg/mL; qRT-PCR = quantitative reverse transcription-polymerase chain reaction; PROM1 = prominin-1; MSI1 = Musashi 1; ALDH1α1 = aldehyde dehydrogenase 1 alpha; ACTB = β-actin. Please click here to view a larger version of this figure.
| Desired number of cells per spheroid | Required number of cells per well |
| 50 | 6 x 10⁴ |
| 100 | 1.2 x 10⁵ |
| 200 | 2.4 x 10⁵ |
| 300 | 3.6 x 10⁵ |
| 400 | 4.8 x 10⁵ |
| 500 | 6 x 10⁵ |
| 600 | 7.2 x 10⁵ |
| 700 | 8.4 x 10⁵ |
| 800 | 9.6 x 10⁵ |
| 1000 | 1.2 x 10⁶ |
| 2000 | 2.4 x 10⁶ |
Table 1: Summary of spheroid formation and cell seeding.
| 10 mm dishes | 6-well plates | 12-well plates | 24-well plates | 96-well plates | |
| Coating Volume | 4 mL | 300 µL | 250 µL | 150 µL | 50 µL (Down & Up) |
Table 2: Volumes of agarose solution for coating of different plates/dishes.
| Genes | Primers | Sequence | Product Length | |
| Differentiation markers | ALPI | Forward | CTG GTA CTC AGA TGC TGA CA | 81 |
| Reverse | ATG TTG GAG ATG AGC TGA GT | |||
| SLC2A5 | Forward | TAC CCA TAC TGG AAG GAT GA | 94 | |
| Reverse | AAC AGG ATC AGA GCA TGA AG | |||
| Stem cell markers | ALDH1a1 | Forward | GCC TTC ACA GGA TCA ACA GAG | 147 |
| Reverse | TGC AAA TTC AAC AGC ATT GTC | |||
| MSI1 | Forward | AGT TGG CAG ACT ACG CAG GA | 131 | |
| Reverse | TGG TCC ATG AAA GTG ACG AAG | |||
| PROM1 | Forward | GTA AGA ACC CGG ATC AAA AGG | 131 | |
| Reverse | GCC TTG TCC TTG GTA GTG TTG | |||
| CD44 | Forward | TGC CTT TGA TGG ACC AAT TAC | 160 | |
| Reverse | TGA AGT GCT GCT CCT TTC ACT | |||
| OLFM4 | Forward | TCT GTG TCC CAG TTG TTT TCC | 118 | |
| Reverse | ATT CCA AGC GTT CCA CTC TGT | |||
| Housekeeping genes | ACTB | Forward | CAC CAT TGG CAA TGA GCG GTT C | 134 |
| Reverse | AGG TCT TTG CGG ATG TCC ACG T | |||
| PPIB | Forward | ATG ATC CAG GGC GGA GAC TT | 100 | |
| Reverse | GCC CGT AGT GCT TCA GTT TG |
Table 3: Primers used for quantitative reverse transcription-polymerase chain reaction.
Discussion
In vitro 3D models overcome the main experimental drawbacks of 2D cancer cell cultures, as they appear to be more reliable in recapitulating typical tumoral features including microenvironment and cell heterogeneity. Commonly used 3D models of spheroids are scaffold-free (cultured in low-attachment conditions) or scaffold-based (using biomaterials to culture cells). These methods present different disadvantages as they depend on the nature of the scaffold used or give rise to spheroids that are variable in structure and size.
The present protocol reports optimized conditions for producing homogeneous spheroids from the colon adenocarcinoma cell line, Caco2, by using a scaffold-free method. The spheroids are easily harvested and contrary to a previously reported study41, they grow successfully and their growth characteristics during the time in culture can also be analyzed. Moreover, with this new method, the spheroids (a) actively proliferate, (b) present a very low rate of cell death, (c) organize to form a lumen inside the spheres, and (d) exhibit differentiation capacity of the component cells. Given that the final aim of the new approach was its use for studies on CSC biology, the expression of different markers of CSCs was analyzed. Interestingly, the markers presented a dynamic expression pattern depending on the time-point and defined different CSC populations.
Of utmost importance, the spheroids generated through this protocol could be used for analyzing drugs relevant for clinical applications such as the chemotherapeutic regimens, FOLFOX and FOLFIRI. The results also underline a heterogeneous response of cells to the drugs depending on the CSC marker analyzed. This observation is consistent with the current view that heterogeneous and multiple CSC-like cell populations within tumors display diverse chemosensitivity/chemoresistance properties42,43. This finding strongly potentiates the applicability of this new method for large scale screening. In addition to the applications reported in this study, the new protocol can also be used for a wider range of analyses (e.g., RNA and/or DNA extraction and large-scale analyses, western blotting, and immunofluorescence). Indeed, the volume of spheroids and growth characteristics can be easily determined by applying the sphere volume formula which, if necessary, also takes into consideration different diameters to counterbalance deviations from a perfectly spherical form. However, specific parameters should be optimized depending on the cell type (cell line or fresh primary cultures) and growth capacity such as the replication time. Nevertheless, the protocol indicates critical steps that can be easily adjusted.
Some points of concern need to be considered when carrying out spheroid generation described in this article. First, several washing steps should be performed with the anti-adherence rinsing solution to promote the homogeneity and compaction of the spheres. In this case, two washes were necessary. Second, bubbles must be removed from the microwells as this can disturb the correct formation of the spheroids. Third, once the cells are seeded in each microwell after the centrifugation step, the plate must remain undisturbed for two days. Additional considerations and changes in the protocol are needed when studying the early steps of spheroid formation, possibly including an automated visualization and imaging system. Fourth, changing the medium without disturbing the spheroids, given that they are in suspension, can be challenging. Hence, it is recommended to change only half of the volume each time. Fifth, when harvesting the spheroids, it is important to preserve their structure. Hence, the use of serological pipettes or micropipettes with the tips cut off is recommended for all dispensing steps after rinsing in a serum-containing medium or PBS to prevent the spheroids from adhering to the tips.
Some limitations may also be encountered when using this protocol. First, not all cell lines or cell types have the same culture parameters; in some cases, cell heterogeneity and the number of passages/aging of cells may also affect the ability to form spheroids. Second, contrariwise to organoids, it may be difficult to maintain spheroids for a very long time in culture. In addition, they cannot be replicated by simple fragmentation through a micropipette tip15. Third, this protocol cannot be adapted for single-spheroid analysis because manually recovering spheroids one by one can be tricky. This technique is more suitable for obtaining high amounts of homogeneous spheroids at the same time. Finally, for studies investigating the effects of growth factors originating from other cell types or analyzing the importance of the microenvironment, it would be important to enrich the model and perform co-culture experiments.
In conclusion, the present methodology describes a new protocol to efficiently generate and culture spheroids from Caco2 cells. The results demonstrate that this method can be applied to the study of tumor heterogeneity and for the analysis of CSCs. This method can also be used for high-throughput drug screening and the study of stem cell biology in cancer and non-cancerous cells.
Disclosures
The authors have nothing to disclose
Acknowledgements
We acknowledge the imaging and Anipath recherche histology platforms (CRCL, CLB). We are indebted to the pharmacy of the Centre Léon Bérard (CLB) Hospital for the kind gift of FOLFOX and FOLFIRI. We also thank Brigitte Manship for critical reading of the manuscript. The work was supported by the FRM (Equipes FRM 2018, DEQ20181039598) and by the Inca (PLBIO19-289). MVG and LC received support from the FRM and CF received support from ARC foundation and the Centre Léon Bérard.
Materials
| Name | Company | Catalog Number | Comments |
|---|---|---|---|
| 37 µm Reversible Strainer, Large | STEMCELL Technologies | 27250 | To be used with 50 mL conical tubes |
| 5-Fluorouracil | Gift from Pharmacy of the Centre Leon Berard (CLB) | - | stock solution, 5 mg/100 mL; final concentration, 50 µg/mL |
| Agarose | Sigma | A9539 | |
| Aggrewell 400 24-well plates | STEMCELL Technologies | 34411 | 1,200 microwells per well for spheroid formation and growth |
| Anti Caspase3 - Rabbit | Cell Signaling | 9661 | dilution 1:200 |
| Anti Musashi-1 (14H1) - Rat | eBioscience/Thermo Fisher | 14-9896-82 | dilution 1:500 |
| Anti-Adherence Rinsing Solution x 100 mL | STEMCELL Technologies | 07010 | |
| Anti-CD133 (13A4) - Rat | Invitrogen | 14-133-82 | dilution 1:100 |
| Anti-CD44 -Rabbit | Abcam | ab157107 | dilution 1:2000 |
| Anti-PCNA - Mouse | Dako | M0879 | dilution 1:1000 |
| Anti-β-catenin - Mouse | Santa Cruz Biotechnology | sc-7963 | dilution 1:50 |
| Black multiwell plates | Thermo Fisher Scientific | 237108 | |
| Citric Acid Monohydrate | Sigma | C1909 | |
| CLARIOstar apparatus | BMG Labtech | microplate reader | |
| Dako pen | marker pen to mark circles on slides for creating barriers for liquids | ||
| Donkey anti-Mouse IgG (H+L) Secondary Antibody, Alexa Fluor 488 | Thermo Fisher Scientific | A21202 | dilution 1:1000 |
| Donkey anti-Mouse IgG (H+L) Secondary Antibody, Alexa Fluor 568 | Thermo Fisher Scientific | A10037 | dilution 1:1000 |
| Donkey anti-Rabbit IgG (H+L) Highly Cross-Adsorbed Secondary Antibody, Alexa Fluor 488 | Thermo Fisher Scientific | A21206 | dilution 1:1000 |
| Donkey anti-Rabbit IgG (H+L) Highly Cross-Adsorbed Secondary Antibody, Alexa Fluor 568 | Thermo Fisher Scientific | A10042 | dilution 1:1000 |
| Dulbecco's Modified Eagle Medium (DMEM) Glutamax (L-alanyl-L-glutamine dipeptide) | Gibco | 10569010 | |
| Fetal Bovine Serum (FBS) | Gibco | 16000044 | |
| Fluorogel mounting medium with DAPI | Interchim | FP-DT094B | |
| Goat anti-Rat IgG (H+L) Cross-Adsorbed Secondary Antibody, Alexa Fluor 568 | Thermo Fisher Scientific | A11077 | dilution 1:1000 |
| ImageJ software | Spheroid image analysis | ||
| Irinotecan | Gift from Pharmacy CLB | - | stock solution, 20 mg/mL; final concentration, 100 µg/mL |
| iScript reverse transcriptase | Bio-Rad | 1708891 | |
| Leucovorin | Gift from Pharmacy CLB | - | stock solution, 50 mg/mL; final concentration, 25 µg/mL |
| Matrigel Basement Membrane Matrix | Corning | 354234 | Basement membrane matrix |
| Nucleospin RNA XS Kit | Macherey-Nagel | 740902 .250 | |
| Oxaliplatin | Gift from Pharmacy CLB | - | stock solution, 100 mg/20 mL;final concentration, 10 µg/mL |
| Penicillin-streptomycin | Gibco | 15140130 | |
| Phosphate Buffer Saline (PBS) | Gibco | 14190250 | |
| SYBR qPCR Premix Ex Taq II (Tli RNaseH Plus) | Takara | RR420B | |
| SYTOX- Green | Thermo Fisher Scientific | S7020 | nucleic acid stain; dilution 1:5000 |
| Trypsin-EDTA (0.05 %) | Gibco | 25300062 | |
| Zeiss-Axiovert microscope | inverted microscope for acquiring images of spheroids |
References
- Bray, F., et al. Global cancer statistics 2018: GLOBOCAN estimates of incidence and mortality worldwide for 36 cancers in 185 countries. CA: A Cancer Journal for Clinicians. 68 (6), 394-424 (2018).
- Fearon, E. R., Vogelstein, B. A genetic model for colorectal tumorigenesis. Cell. 61 (5), 759-767 (1990).
- Rao, C. V., Yamada, H. Y. Genomic instability and colon carcinogenesis: from the perspective of genes. Frontiers in Oncology. 3, 130(2013).
- Fearon, E. R. Molecular genetics of colorectal cancer. Annual Review of Pathology. 6 (1), 479-507 (2011).
- Tran, T. Q., et al. α-Ketoglutarate attenuates Wnt signaling and drives differentiation in colorectal cancer. Nature Cancer. 1 (3), 345-358 (2020).
- Batlle, E., Clevers, H. Cancer stem cells revisited. Nature Medicine. 23 (10), 1124-1134 (2017).
- Clevers, H. The cancer stem cell: premises, promises and challenges. Nature Medicine. 17 (3), 313-319 (2011).
- Barker, N., et al. Crypt stem cells as the cells-of-origin of intestinal cancer. Nature. 457 (7229), 608-611 (2009).
- Dutta, D., Heo, I., Clevers, H. Disease modeling in stem cell-derived 3D organoid systems. Trends in Molecular Medicine. 23 (5), 393-410 (2017).
- Bleijs, M., van de Wetering, M., Clevers, H., Drost, J. Xenograft and organoid model systems in cancer research. The EMBO Journal. 38 (15), 101654(2019).
- Kawai, S., et al. Three-dimensional culture models mimic colon cancer heterogeneity induced by different microenvironments. Scientific Reports. 10 (1), 3156(2020).
- Ferreira, L. P., Gaspar, V. M., Mano, J. F. Design of spherically structured 3D in vitro tumor models -Advances and prospects. Acta Biomaterialia. 75, 11-34 (2018).
- Friedrich, J., Seidel, C., Ebner, R., Kunz-Schughart, L. A. Spheroid-based drug screen: considerations and practical approach. Nature Protocols. 4 (3), 309-324 (2009).
- Chaicharoenaudomrung, N., Kunhorm, P., Noisa, P. Three-dimensional cell culture systems as an in vitro platform for cancer and stem cell modeling. World Journal of Stem Cells. 11 (12), 1065-1083 (2019).
- Sato, T., et al. Single Lgr5 stem cells build crypt-villus structures in vitro without a mesenchymal niche. Nature. 459 (7244), 262-265 (2009).
- Weiswald, L. -B., Bellet, D., Dangles-Marie, V. Spherical cancer models in tumor biology. Neoplasia. 17 (1), 1-15 (2015).
- Nath, S., Devi, G. R. Three-dimensional culture systems in cancer research: Focus on tumor spheroid model. Pharmacology & Therapeutics. 163, 94-108 (2016).
- Silva-Almeida, C., Ewart, M. -A., Wilde, C. 3D gastrointestinal models and organoids to study metabolism in human colon cancer. Seminars in Cell & Developmental Biology. 98, 98-104 (2020).
- Chantret, I., Barbat, A., Dussaulx, E., Brattain, M. G., Zweibaum, A. Epithelial polarity, villin expression, and enterocytic differentiation of cultured human colon carcinoma cells: A survey of twenty cell lines. Cancer Research. 48 (7), 1936-1942 (1988).
- Caro, I., et al. Characterisation of a newly isolated Caco-2 clone (TC-7), as a model of transport processes and biotransformation of drugs. International Journal of Pharmaceutics. 116 (2), 147-158 (1995).
- Antonchuk, J. Formation of embryoid bodies from human pluripotent stem cells using AggreWellTM plates. Methods in Molecular Biology. 946, 523-533 (2013).
- Wolpin, B. M., Mayer, R. J. Systemic treatment of colorectal cancer. Gastroenterology. 134 (5), 1296-1310 (2008).
- Yaffee, P., Osipov, A., Tan, C., Tuli, R., Hendifar, A. Review of systemic therapies for locally advanced and metastatic rectal cancer. Journal of Gastrointestinal Oncology. 6 (2), 185-200 (2015).
- Fujita, K., Kubota, Y., Ishida, H., Sasaki, Y. Irinotecan, a key chemotherapeutic drug for metastatic colorectal cancer. World Journal of Gastroenterology. 21 (43), 12234-12248 (2015).
- Mohelnikova-Duchonova, B., Melichar, B., Soucek, P. FOLFOX/FOLFIRI pharmacogenetics: the call for a personalized approach in colorectal cancer therapy. World Journal of Gastroenterology. 20 (30), 10316-10330 (2014).
- Jordan, N. J., et al. Impact of dual mTORC1/2 mTOR kinase inhibitor AZD8055 on acquired endocrine resistance in breast cancer in vitro. Breast Cancer Research. 16 (1), 12(2014).
- Mohr, J. C., et al. The microwell control of embryoid body size in order to regulate cardiac differentiation of human embryonic stem cells. Biomaterials. 31 (7), 1885-1893 (2010).
- Hughes, C. S., Postovit, L. M., Lajoie, G. A. Matrigel: A complex protein mixture required for optimal growth of cell culture. Proteomics. 10 (9), 1886-1890 (2010).
- Luca, A. C., et al. Impact of the 3D microenvironment on phenotype, gene expression, and EGFR inhibition of colorectal cancer cell lines. PLoS One. 8 (3), 59689(2013).
- Petersen, O. W., Rønnov-Jessen, L., Howlett, A. R., Bissell, M. J. Interaction with basement membrane serves to rapidly distinguish growth and differentiation pattern of normal and malignant human breast epithelial cells. Proceedings of the National Academy of Sciences of the United States of America. 89 (19), 9064-9068 (1992).
- Nusse, R., Clevers, H. Wnt/β-catenin signaling, disease, and emerging therapeutic modalities. Cell. 169 (6), 985-999 (2017).
- Sambuy, Y., De Angelis, I., Ranaldi, G., Scarino, M. L., Stammati, A., Zucco, F. The Caco-2 cell line as a model of the intestinal barrier: influence of cell and culture-related factors on Caco-2 cell functional characteristics. Cell Biology and Toxicology. 21 (1), 1-26 (2005).
- Vermeulen, L., Snippert, H. J. Stem cell dynamics in homeostasis and cancer of the intestine. Nature Reviews Cancer. 14 (7), 468-480 (2014).
- van der Heijden, M., Vermeulen, L. Stem cells in homeostasis and cancer of the gut. Molecular Cancer. 18 (1), 66(2019).
- Barker, N., Bartfeld, S., Clevers, H. Tissue-resident adult stem cell populations of rapidly self-renewing organs. Cell Stem Cell. 7 (6), 656-670 (2010).
- van der Flier, L. G., Haegebarth, A., Stange, D. E., van de Wetering, M., Clevers, H. OLFM4 is a robust marker for stem cells in human intestine and marks a subset of colorectal cancer cells. Gastroenterology. 137 (1), 15-17 (2009).
- Potten, C. S., et al. Identification of a putative intestinal stem cell and early lineage marker; musashi-1. Differentiation. 71 (1), 28-41 (2003).
- Clevers, H. The intestinal crypt, a prototype stem cell compartment. Cell. 154 (2), 274-284 (2013).
- Clark, D. W., Palle, K. Aldehyde dehydrogenases in cancer stem cells: potential as therapeutic targets. Annals of Translational Medicine. 4 (24), 518(2016).
- Tomita, H., Tanaka, K., Tanaka, T., Hara, A. Aldehyde dehydrogenase 1A1 in stem cells and cancer. Oncotarget. 7 (10), 11018-11032 (2016).
- Zoetemelk, M., Rausch, M., Colin, D. J., Dormond, O., Nowak-Sliwinska, P. Short-term 3D culture systems of various complexity for treatment optimization of colorectal carcinoma. Scientific Reports. 9 (1), 7103(2019).
- Garcia-Mayea, Y., Mir, C., Masson, F., Paciucci, R., Leonart, M. E. Insights into new mechanisms and models of cancer stem cell multidrug resistance. Seminars in Cancer Biology. 60, 166-180 (2020).
- Marusyk, A., Janiszewska, M., Polyak, K. Intratumor heterogeneity: The Rosetta Stone of therapy resistance. Cancer Cell. 37 (4), 471-484 (2020).
Reprints and Permissions
