A flow analysis system for bead-based multiplexed assays which provides a two-reporter readout was used for the development of multiplex serological and antibody neutralization assays that can simultaneously measure neutralizing IgG and IgM antibodies for SARS-CoV-2.
Method Article
A Rapid, Multiplex Dual Reporter IgG and IgM SARS-CoV-2 Neutralization Assay for a Multiplexed Bead-Based Flow Analysis System
In This Article
Summary
Abstract
The COVID-19 pandemic has underscored the need for rapid high-throughput methods for sensitive and specific serological detection of infection with novel pathogens, such as SARS-CoV-2. Multiplex serological testing can be particularly useful because it can simultaneously analyze antibodies to multiple antigens that optimizes pathogen coverage, and controls for variability in the organism and the individual host response. Here we describe a SARS-CoV-2 IgG 3-plex fluorescent microsphere-based assay that can detect both IgM and IgG antibodies to three major SARS-CoV-2 antigens-the spike (S) protein, spike angiotensin-converting enzyme-2 (ACE2) receptor-binding domain (RBD), and nucleocapsid (Nc). The assay was shown to have comparable performance to a SARS-CoV-2 reference assay for IgG in serum obtained at ≥21 days from symptom onset but had higher sensitivity with samples collected at ≤5 days from symptom onset. Further, using soluble ACE2 in a neutralization assay format, inhibition of antibody binding was demonstrated for S and RBD.
Introduction
The COVID-19 pandemic has emphasized the importance of being able to rapidly develop and implement fast, high-throughput, high-performing serological tests that can be used for diagnosis and surveillance of novel pathogens such as SARS-CoV-2. Multiplex serological testing can be extremely useful in a pandemic, as it can simultaneously analyze antibodies to multiple antigens, which provides for broad pathogen coverage and controls for variability in the organism and the host response to infection. The development of a multiplex fluorescent bead-based assay, the SARS-CoV-2 IgG 3Flex (3Flex), that can detect antibodies to the spike (S) protein, the spike angiotensin-converting enzyme-2 (ACE2) receptor-binding domain (RBD), and nucleocapsid (Nc) of SARS-CoV-2 was recently reported1. 3Flex was shown to have comparable performance to a reference SARS-CoV-2 IgG assay for serum obtained at ≥21 days from symptom onset but had higher sensitivity with samples collected at ≤5 days from symptom onset. Additionally, inhibition of antibody binding was demonstrated for S and RBD antigens using soluble ACE2 in a neutralization assay format. Multiplex bead-based technology has been widely adopted as a proven technology for multiplex serological testing and has distinct advantages for large-scale screening, including short time-to-results, small sample requirements, and reduced labor2,3,4.
Recently, a new flow analysis instrument has become available that provides the same high-plex, high-throughput capability of the system demonstrated in previous work1, but with the added benefit of two reporter channels. The ability to measure two fluorescent reporter signals in a single reaction allows the assessment of two results per analyte for each sample and is ideal for isotyping applications, which typically must be performed in separate reaction wells5. The dual reporter capability provides twice the data for each sample in half as many reaction wells with half the sample volume requirements, and thus has a clear advantage over single reporter systems. This study details the standard serological assay protocol and describes the adaptation to a neutralization assay. Additionally, this report describes the conversion of the single reporter assay to a dual reporter serological assay, and subsequently, a dual reporter neutralization assay, to simultaneously measure neutralizing antibodies of both IgG and IgM isotypes against the SARS-CoV-2 S, RBD, and Nc antigens. A visual overview of the assay protocol is provided in Figure 1.
Protocol
Residual human serum samples previously tested for SARS-CoV-2 diagnostic analyses were used in this study which was approved by the University of Rochester Institutional Review Board.
1. Reagents and equipment
- Obtain coronavirus antigens and human IgG and IgM from commercial sources.
- Obtain assay control (AC) bead sets (45 and 220) from the instrument vendor. The AC bead set 45 monitors Median Fluorescence Intensity (MFI) collection on single reporter channel (RP1) instruments. The AC bead set 220 monitors MFI collection on the second reporter channel (RP2).
- Obtain detection antibodies and antigen-specific rabbit sera and antibodies used for coupling confirmation.
- Perform the detection with biotin-labeled antibodies with either a streptavidin, R-phycoerythrin conjugate (SAPE) or a streptavidin conjugate of fluorophore Super Bright 436 (SASB; excitation at 405 nanometers (nm) and emission at 436 nm).
- Obtain Human ACE2 protein (i.e., the SARS Receptor). Prior to use, rehydrate lyophilized ACE2 protein by dissolving to a 1 mg/mL concentration in nuclease-free water (Not DEPC-treated, autoclaved and 0.2-µm sterile filtered) and store at 4 °C.
- Perform all reactions in 96-well nonbinding surface (NBS) black flat-bottom plates. Seal the plates with 96 well microplate aluminum sealing tape for assay incubation steps. Use a magnetic plate separator for the assay wash steps.
2. Antigen-coupled and antibody-coupled control beads preparation
- Covalently couple magnetic, polystyrene, and color-coded microsphere sets (6.5-µm diameter) with S, RBD, and Nc antigens as described in Cameron et al.1. Coronavirus antigens are coupled at 10 pmol/106 beads (S) and 100 pmol/106 beads (RBD and Nc). Control beads coupled with human IgG or IgM are generated as previously described1. IgG and IgM are coupled at 5 µg/106 beads.
- After coupling, determine the bead concentrations and dilute each stock to 1 x 10⁶ beads/mL using described procedures6.
- Perform confirmation of antigen coupling with antigen-specific antibodies from rabbit or with positive human sera as described in Cameron et al.1.
- Confirm human IgG coupling with the assay's biotinylated anti-human IgG/SAPE detection reagents, and IgM coupling with a phycoerythrin (PE)-labeled goat anti-human IgM.
NOTE: Coupling confirmation is performed using a titration of protein-specific serum or antibody, because the optimal concentration to use for these reagents is not known. For serum, serial fold dilutions are used whereas for antibodies supplied as mg/mL stocks, serial µg/mL dilution series are used.
- Confirm human IgG coupling with the assay's biotinylated anti-human IgG/SAPE detection reagents, and IgM coupling with a phycoerythrin (PE)-labeled goat anti-human IgM.
- Dilute assay control (AC) beads that monitor MFI collection in the two reporter channels to a concentration of 1 x 10⁶ beads/mL prior to using in multiplex bead mixes.
3. Fresh multiplex bead mix preparation
- Prepare multiplex beads mixes freshly each day from the individual coupled bead and control bead stocks at 1 x 10⁶ beads/mL.
NOTE: Multiplex bead mixes are prepared to deliver 2,500 beads for each bead region in a 50 µL volume. Calculations for how to prepare multiplex bead mixes for any number of reactions are described in the blog published by Angeloni (2020)6.
4. Sample dilution
- Prepare a 1:100 serum sample dilution by mixing 10 µL of serum into 990 µL of phosphate-buffered saline (PBS) containing 0.05% Tween 20, 0.02% sodium azide, and 1% of bovine serum albumin (BSA) (PBS-TBN buffer).
- Dilute samples again 10-fold by adding 20 µL of the 1:100 dilution to 180 µL of PBS-TBN.
NOTE: Serum samples consist of negative sera, from specimens collected in 2019 prior to the COVID-19 pandemic, and positive sera from SARS-CoV-2 PCR-positive patients, representing low and high antibody titers. Positive samples were collected between ≈3 to >60 days from symptom onset (DFSO). All serum samples and IgG-stripped negative control sera are diluted to 1:1000 as described below. For neutralization assays, sera are diluted 1:500 as described in the neutralization protocols below (sections 6 and 8).
5. Single reporter serological assay protocol
- Add 50 µL of multiplex bead mix to each assigned well of a 96-well non-binding microtiter plate.
- Pipette 50 µL of 1:1000 serum or PBS-TBN into the appropriate wells; the final dilution of serum in the well is 1:2000.
- Cover the plate with a microplate foil seal and incubate on a heated plate shaker at 37 °C for 15 min with shaking at 600 rpm.
- Remove the plate from the plate shaker and place onto the magnetic plate separator for 2 min to separate the beads from the reaction mixture.
- While retaining the plate on the magnet, remove the foil seal, carefully invert the plate over a waste container, and gently flick the supernatant out of the wells.
- Blot the plate on absorbent paper while still holding the plate on the magnet.
- Wash the reaction wells as described below (first post-sample incubation wash).
- Remove the plate from the plate magnet and add 150 µL of PBS-TBN to each well.
- Cover the plate with a fresh foil seal and shake at 37 °C for 2 min at 600 rpm.
- Remove the plate from the plate shaker and place onto the plate magnet for 2 min to separate the beads from the reaction mixture.
- While retaining the plate on the magnet, remove the foil seal, carefully invert the plate over a waste container, and gently flick the supernatant out of the wells.
- Blot the plate on absorbent paper while still holding the plate on the magnet.
- Wash the reaction wells as described below (second post-sample incubation wash).
- Remove the plate from the plate magnet and add 150 µL of PBS-TBN to each well.
- Cover the plate with a fresh foil seal and shake at 37 °C for 2 min at 600 rpm.
- Remove the plate from the plate shaker and place onto the plate magnet for 2 min to separate the beads from the reaction mixture.
- While retaining the plate on the magnet, remove the foil seal, carefully invert the plate over a waste container, and gently flick the supernatant out of the wells.
- Remove the plate from the magnet.
- Make a fresh mix of biotin-anti-human IgG with SAPE by diluting the antibody to 0.62 µg/mL and the SAPE to 1 µg/mL. Add 100 µL to each well.
- Cover the plate with a microplate foil seal and incubate on a heated plate shaker at 37 °C for 15 min with shaking at 600 rpm.
- Remove the plate from the plate shaker and place onto the magnetic plate separator for 2 min to separate the beads from the reaction mixture.
- While retaining the plate on the magnet, remove the foil seal, carefully invert the plate over a waste container, and gently flick the supernatant out of the wells.
- Blot the plate on absorbent paper while still holding the plate on the magnet.
- Wash the reaction wells as described below (first post detection antibody incubation wash).
- Remove the plate from the plate magnet and add 150 µL of PBS-TBN to each well.
- Cover the plate with a fresh foil seal and shake at 37 °C for 2 min at 600 rpm.
- Remove the plate from the plate shaker and place onto the plate magnet for 2 min to separate the beads from the reaction mixture.
- While retaining the plate on the magnet, remove the foil seal, carefully invert the plate over a waste container, and gently flick the supernatant out of the wells.
- Blot the plate on absorbent paper while still holding the plate on the magnet.
- Wash the reaction wells as described below (second post-detection antibody incubation wash).
- Remove the plate from the plate magnet and add 150 µL of PBS-TBN to each well.
- Cover the plate with a fresh foil seal and shake at 37 °C for 2 min at 600 rpm.
- Remove the plate from the plate shaker and place onto the magnetic plate separator for 2 minutes to separate the beads from the reaction mixture.
- While retaining the plate on the magnet, remove the foil seal, carefully invert the plate over a waste container, and gently flick the supernatant out of the wells.
- Remove the plate from the magnet.
- Add 100 µL of PBS-TBN to each well.
- Cover with foil seal and shake for 2 min at 37 °C.
- Remove the plate from the plate shaker. Then remove the foil seal and read 50 µL of each well on the flow analyzer according to the User Manual. A brief description is provided below.
- Select the drop-down menu in the upper left corner of the screen and navigate to Plate Configuration.
- Select Run Plate.
- Select the Eject icon to eject the plate carrier.
- Load the plate onto the plate carrier and select the Retract icon to retract the plate carrier.
- Select the Run icon to run the plate.
6. Single reporter neutralization assay protocol
- Prepare a fresh multiplex bead mix as described in section 3 above.
- Dilute patient and control sera 1:500 as follows.
- Dilute serum 1:100 by mixing 10 µL of serum into 990 µL of PBS-TBN.
- Dilute serum a further 5-fold by adding 40 µL of 1:100 serum into 160 µL of PBS-TBN.
- Add 50 µL of multiplex bead mix to each assigned well of a 96-well non-binding microtiter plate.
- Add 25 µL of 2 µg/mL ACE2 dilution to each well.
- Cover the plate with a microplate foil seal and incubate on a heated plate shaker at 37 °C for 2 min with shaking at 600 rpm.
- Remove the plate from the plate shaker and remove the foil seal.
- Add 25 µL of 1:500 serum or PBS-TBN to the assigned wells.
- Cover the plate with a microplate foil seal and incubate on a heated plate shaker at 37 °C for 15 min with shaking at 600 rpm.
- For the remainder of the assay procedure, follow steps 5.4 to 5.18.5 as described above.
7. Conversion to a dual reporter IgG and IgM serological assay
- Prepare antigen-coupled beads as described in Section 2 above.
NOTE: An additional bead set, coupled with human IgM, is included to monitor for the addition of anti-IgM detection reagents, as well as an additional AC bead set (220) to monitor collection of MFI for RP2. All bead stocks are at 1 x 10⁶ beads/mL for inclusion in multiplex bead mixes as described below. - Prepare fresh multiplex bead mixes as described in Section 3 above.
- Dilute serum samples and IgG-stripped negative control sera 1:1000 as described in Section 4 above.
- Add 50 µL of multiplex bead mix to each assigned well of a 96-well non-binding microtiter plate.
- Pipette 50 µL of 1:1000 serum or PBS-TBN to the appropriate wells. The final dilution of serum in the well is 1:2000.
- Cover the plate with a microplate foil seal and incubate on a heated plate shaker at 37 °C for 15 min with shaking at 600 rpm.
- Remove the plate from the plate shaker and place onto the magnetic plate separator for 2 min to separate the beads from the reaction mixture.
- While retaining the plate on the magnet, remove the foil seal, carefully invert the plate over a waste container, and gently flick the supernatant out of the wells.
- Blot the plate on absorbent paper while still holding the plate on the magnet.
- Wash the reaction wells as described below (first post-sample incubation wash).
- Remove the plate from the plate magnet and add 150 µL of PBS-TBN to each well.
- Cover the plate with a fresh foil seal and shake at 37 °C for 2 min at 600 rpm.
- Remove the plate from the plate shaker and place onto the plate magnet for 2 min to separate the beads from the reaction mixture.
- While retaining the plate on the magnet, remove the foil seal, carefully invert the plate over a waste container, and gently flick the supernatant out of the wells.
- Blot the plate on absorbent paper while still holding the plate on the magnet.
- Wash the reaction wells again with PBS-TBN (second post-sample incubation wash), exactly as described above in steps 7.10.1-7.10.5.
- Remove the plate from the magnet.
- Make a fresh Detection Reagent mix with the required combination of reagents and add 50 µL or 100 µL to each well.
NOTE: Detection Reagent mixes containing the anti-Human IgG conjugated to the Brilliant Violet 421 reporter dye (BV; excitation at 405 nm and emission at 421 nm) were used at 50 µL/well due to limiting amounts of the stock reagents available. All other Detection Reagent mixes are used at 100 µL/well. - Cover the plate with a microplate foil seal and incubate on a heated plate shaker at 37 °C for 15 min with shaking at 600 rpm.
- Remove the plate from the plate shaker and place onto the magnetic plate separator for 2 min to separate the beads from the reaction mixture.
- While retaining the plate on the magnet, remove the foil seal, carefully invert the plate over a waste container, and gently flick the supernatant out of the wells.
- Blot the plate on absorbent paper while still holding the plate on the magnet.
- Wash the reaction wells as described below with PBS-TBN (first wash after detection antibody incubation).
- Remove the plate from the plate magnet and add 150 µL of PBS-TBN to each well.
- Cover the plate with a fresh foil seal and shake at 37 °C for 2 min at 600 rpm.
- Remove the plate from the plate shaker and place onto the magnetic plate separator for 2 min to separate the beads from the reaction mixture.
- While retaining the plate on the magnet, remove the foil seal, carefully invert the plate over a waste container, and gently flick the supernatant out of the wells.
- Blot the plate on absorbent paper while still holding the plate on the magnet.
- Wash the reaction wells again with PBS-TBN (second wash after detection antibody incubation), exactly as described above in steps 7.17.1-7.17.5.
- Remove the plate from the magnet.
- Add 100 µL of PBS-TBN to each well.
- Cover with foil seal and shake for 2 min at 37 °C.
- Remove the plate from the plate shaker. Then remove the foil seal and read 50 µL of each well on the flow analyzer as described above in steps 5.18.1-5.18-5.
8. Conversion to dual reporter neutralization assay
- Use the coupled beads as described in step 7.1 above.
- Prepare a fresh multiplex bead mix as described in step 7.2.
- Serum samples and IgG-stripped negative control sera are diluted 1:500 as follows.
- Prepare a 1:100 dilution by mixing 10 µL of serum into 990 µL of PBS-TBN.
- Dilute the 1:100 samples a further 5-fold by adding 40 µL of the 1:100 dilutions to 160 µL of PBS-TBN.
- Add 50 µL of multiplex bead mix to each assigned well of a 96-well non-binding microtiter plate.
- Add 25 µL of 2 µg/mL ACE2 dilution to each well.
- Cover the plate with a microplate foil seal and incubate on a heated plate shaker at 37 °C for 2 min with shaking at 600 rpm.
- Remove the plate from the plate shaker and remove the foil seal.
- Add 25 µL of 1:500 serum or PBS-TBN to the assigned wells.
- Cover the plate with a foil seal and incubate on a heated plate shaker at 37 °C for 15 min with shaking at 600 rpm.
- Remove the plate from the plate shaker and place onto the magnetic plate separator for 2 min to separate the beads from the reaction mixture.
- With the plate retained on the magnet, remove the foil seal, carefully invert the plate over a waste container, and gently flick the supernatant out of the wells.
- Blot the plate on absorbent paper while still holding the plate on the magnet.
- Wash the reaction wells as described below (first post sample incubation wash).
- Remove the plate from the plate magnet and add 150 µL of PBS-TBN to each well.
- Cover the plate with a fresh foil seal and shake at 37 °C for 2 min at 600 rpm.
- Remove the plate from the plate shaker and place onto the magnetic plate separator for 2 min to separate the beads from the reaction mixture.
- With the plate retained on the magnet, remove the foil seal, carefully invert the plate over a waste container, and gently flick the supernatant out of the wells.
- Blot the plate on absorbent paper while still holding the plate on the magnet.
- Wash the reaction wells again with PBS-TBN (second post-sample incubation wash), exactly as described above in steps 8.13.1-8.13.5.
- Remove the plate from the magnet.
- Make a fresh Detection Reagent mix with the required combination of reagents and add 50 µL or 100 µL to each well.
NOTE: Detection Reagent mixes containing the anti-Human IgG conjugated to the BV reporter dye were used at 50 µL/well due to limiting amounts of the stock reagents available (see Table of Materials). All other Detection Reagent mixes are used at 100 µL/well. - Cover the plate with a microplate foil seal and incubate on a heated plate shaker at 37 °C for 15 min with shaking at 600 rpm.
- Remove the plate from the plate shaker and place onto the magnetic plate separator for 2 min to separate the beads from the reaction mixture.
- With the plate retained on the magnet, remove the foil seal, carefully invert the plate over a waste container, and gently flick the supernatant out of the wells.
- Blot the plate on absorbent paper while still holding the plate on the magnet.
- Wash the reaction wells as described below (first was after detection antibody incubation).
- Remove the plate from the plate magnet and add 150 µL of PBS-TBN to each well.
- Cover the plate with a fresh foil seal and shake at 37 °C for 2 min at 600 rpm.
- Remove the plate from the plate shaker and place onto the magnetic plate separator for 2 min to separate the beads from the reaction mixture.
- With the plate retained on the magnet, remove the foil seal, carefully invert the plate over a waste container, and gently flick the supernatant out of the wells.
- Blot the plate on absorbent paper while still holding the plate on the magnet.
- Wash the reaction wells again with PBS-TBN (second wash after detection antibody incubation), exactly as detailed above in steps 8.21.1-8.21.5.
- Remove the plate from the plate magnet and add 150 µL of PBS-TBN to each well.
- Cover the plate with a fresh foil seal and shake at 37 °C for 2 min at 600 rpm.
- Remove the plate from the plate shaker and place onto the magnetic plate separator for 2 minutes to separate the beads from the reaction mixture.
- With the plate retained on the magnet, remove the foil seal, carefully invert the plate over a waste container, and gently flick the supernatant out of the wells.
- Remove the plate from the magnet.
- Add 100 µL of PBS-TBN to each well.
- Cover with foil seal and shake for 2 min at 37 °C.
- Remove the plate from the plate shaker. Then remove the foil seal and read 50 µL of each well on the flow analyzer as described above in steps 5.18.1-5.18-5.
Results
Optimization of the Single Reporter Serological Assay.
The coupling strategy for all SARS-CoV-2 antigens is described in Cameron, et al., 20201 and in step 2.1 above. The strategy for coupling confirmation is described in step 2.3 above. For an efficient coupling, the median fluorescence intensity (MFI) values should be significantly higher than the no serum/no antibody negative control reaction(s) and should demonstrate a dose response of decreasing MFI signal with decreasing amounts of detection reagent. MFIs of approximately 1,000 MFI units or greater over background MFI generally indicate efficient protein coupling and are dependent on the concentration and specificity of the detection reagent used. Using this method, confirmation of S, RBD, and Nc antigen coupling were tested for two lots of beads (Figure 2). The MFI signals for all antigens were significantly higher than the background MFI and showed a dose response with titration of the detection reagents. The data also showed good reproducibility of MFI levels between the two different lots of coupled beads.
Optimization of the single reporter assay was done as described in Cameron, et al., 20201. Each antigen was tested at different coupling concentrations with different dilutions of several serum samples representing high, medium, low, and negative samples. In addition, because the assay measures IgG titers, an IgG-stripped serum was used as an additional negative sample. Results of a representative sample dilution series with different antigen coupling levels are shown in Figure 3. This initial dilution series was tested with a fixed concentration of detection reagents to get a potential range of representative antigen-specific and background MFI levels. From these data, additional sample dilution ranges and antigen coupling levels were determined and tested further with additional samples (data not shown).
Next, the concentration of the detection reagent was optimized for use with the different serum dilutions and antigen coupling levels. Representative data using 6 positive and 2 negative samples are shown in Figure 4. Following additional testing with several hundred negative pre-COVID-19 serum samples, the final optimal antigen coupling levels and detection regent concentrations were selected for the final assay protocol, as described in section 5.
Conversion to a single reporter neutralization assay
Conversion of the single reporter serological assay to a neutralization assay was achieved by adding an incubation step using ACE2 (as a competing reagent) with the beads prior to adding the serum sample. By titrating the amount of ACE2 added, inhibition of IgG binding to the S and RBD antigens was observed, as shown in Figure 5. While the 11 patient sera had different titers of IgG, each showed a significant decrease in MFI signal with increasing ACE2 concentration. As expected, ACE2 only impacts the MFI signals of S and RBD, but not the Nc antigen.
The percent residual MFI signal relative to 0 µg/mL ACE2 for all samples is shown in Figure 6. For most samples, a signal loss >30% was observed for S and RBD with increasing ACE2 concentration. As expected, there was no effect of ACE2 on the Nc signal.
Conversion to a dual reporter IgG and IgM serological assay
For the dual reporter IgG and IgM assay, the standard single reporter assay conditions were used to test different antibody and reporter combinations for the two reporter channels. The RP1 channel is similar to previous flow analysis instruments with detection of "orange" fluorescence for reporter dyes such as PE. The second channel, RP2, employs a violet excitation laser that can be used for detecting the "blue" fluorescence of dyes excited at 402 nm with emission spectra peaks in the 421-441 nm range.
Several different anti-human IgG and IgM antibody combinations were tested at various concentrations with the standard 2,000-fold sample dilution and incubation conditions detailed in section 6. An initial test of anti-IgM conjugated to the DyLight 405 reporter dye (DL 405; excitation at 400 nm and emission at 420 nm) for the RP2 channel was performed using a set of 11 PCR-positive samples with DFSO ranging from 5 to >60 days, and an IgG-stripped serum sample. This detection reagent did not produce a high signal in the RP2 channel as shown in Figure 7A,B,C. For samples with the high IgM RP2 MFI, the highest signals were seen for RBD and Nc (Figure 7B,C). While IgM titers should be elevated at this time in some samples, the observed MFI levels did not exceed 140 MFI units with the IgM detection reagent. Furthermore, the control bead for IgM lacked a significant dynamic range for MFI when using DL 405 conjugated to anti-IgM compared to a PE-labeled anti-IgM RP1 reporter used at the same concentrations (Figure 7D).
Because a suitable RP2 reporter-labeled detection reagent for IgM was not available, the original biotin anti-IgG with SASB was tested for use in the RP2 channel. The signal for IgG in the RP2 channel with SASB did not have the same dynamic range as with SAPE, but it still had a suitable range for measuring IgG titers for S, RBD, and Nc (Figure 8). These data led to testing different RP1 IgM and RP2 IgG detection reagent combinations, as described below.
Conversion to dual reporter neutralization assay
The dual reporter serological assay was converted to a neutralization assay by adding an incubation step with ACE2 and beads, prior to adding the serum sample. A 2-fold dilution series of ACE2 starting at 16 µg/ml was used, and then tested with sets of 11 samples and stripped sera as described above. In addition, 3 different combinations of RP1 IgM and RP2 IgG detection antibody mixes were tested on a set of 11 samples and stripped serum controls. The final combinations and reagent concentrations determined to be optimal are detailed in Table 1.
For IgG detection, the biotin anti-human IgG/SASB used in the original single reporter assay was tested along with another anti-IgG conjugated to the BV reporter dye. While the BV conjugate had high RP2 MFI signals, the MFI signal intensity for IgG titer varied across the ACE2 titrations (Figure 9A,C,E). The biotin anti-human IgG/SASB combination had more consistent MFI signal decrease across the ACE2 titration compared to the BV conjugate, demonstrating a dose response, although the MFI levels were lower. The signal fluctuation by the BV conjugate across ACE2 concentrations also interfered with determining the percent inhibition by ACE2 across the range of IgG titers compared to the biotin anti-human IgG/SASB combination (Figure 9B,D,F). Samples with low MFI signals, such as the DFSO 3 sample, do not have high enough titers to evaluate the performance of these reagents or measure IgG neutralizing capacity.
For determining IgM titers in the RP1 channel, a PE-conjugated anti-IgM was compared to an anti-human IgM conjugated to the DyLight 549 reporter dye (DL 549; excitation at 562 nm and emission at 576 nm) at the concentrations listed in Table 1. Of these two reagents, the PE anti-IgM displayed higher MFIs than those generated by DL 549 anti-human IgM for the samples tested (Figure 9A,C,E). The IgM control bead measuring the addition of these reagents had different average MFIs of ≈17,000 for the PE anti-IgM and 2,723 for the DL 549 conjugate. Even with these differences, the impact of the various ACE2 concentrations on MFI was measurable with the DL 549 conjugate. For determining ACE2 percent inhibition of IgM binding, there was a slight but insignificant difference between the two IgM detection reagents (Figure 9B,D,F).
| Combination | Reporter | Final Concentration In Well (µg/mL) | |
| RP1 | RP2 | ||
| 1 | PE anti-IgM | 2 | - |
| Biotin-Ig | - | 0.62 | |
| SASB | - | 4 | |
| 2 | DyLight 549 Anti-Human IgM | 1 | - |
| Brilliant Violet 421 Anti-Human IgG | - | 1 | |
| 3 | DyLight 549 Anti-Human IgM | 1 | - |
| Biotin-Ig | - | 0.62 | |
| SASB | - | 4 | |
Table 1: List of RP1 and RP2 reporter dye combinations tested. Several different RP1 and RP2 reporter dyes were evaluated for measuring IgG and IgM titers. The three combinations shown above were tested at different RP1 detection modes and for optimization of the neutralization assay. For RP2 combinations using SASB, concentrations for the biotinylated detection antibody and SASB are shown. *Final Concentration represents the final concentration in the reaction well.
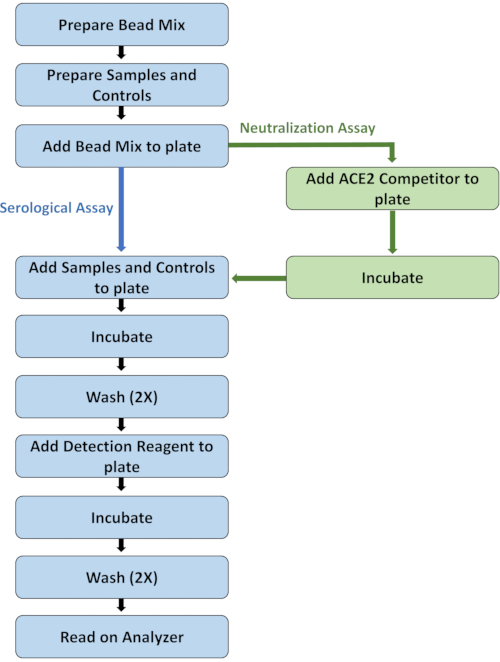
Figure 1: Flowchart highlighting main assay protocol steps. Please click here to view a larger version of this figure.
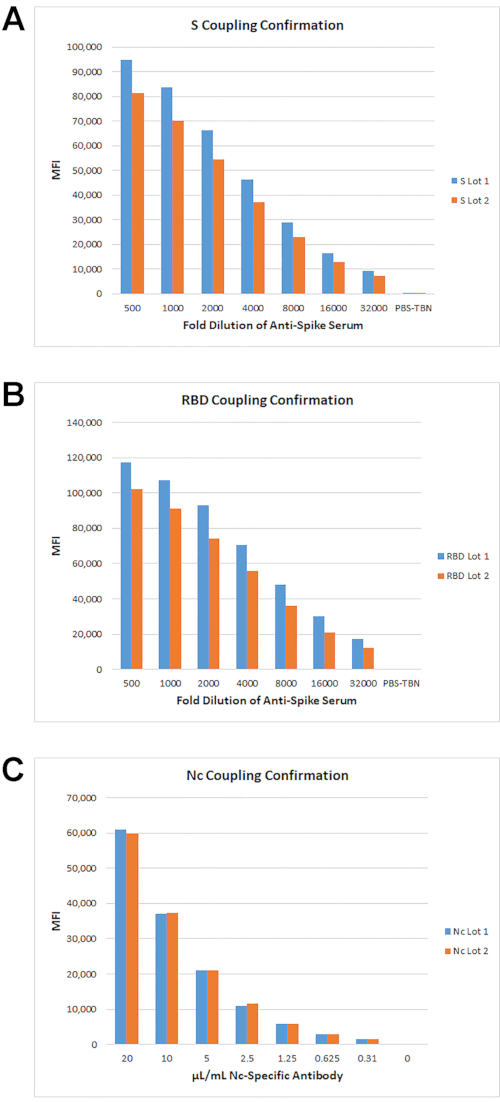
Figure 2: Confirmation of antigen coupling. Antigens were coupled at 100, 10 and 1 pmol/106 beads. For S and RBD antigens, rabbit anti-S sera was used and detected with PE anti-rabbit IgG. For Nc, a Protein G-purified rabbit polyclonal anti-Nc was used. The titration curves for beads coupled with 10 pmol S (A), 100 pmol RBD (B), and 100 pmol Nc (C) are shown. Please click here to view a larger version of this figure.
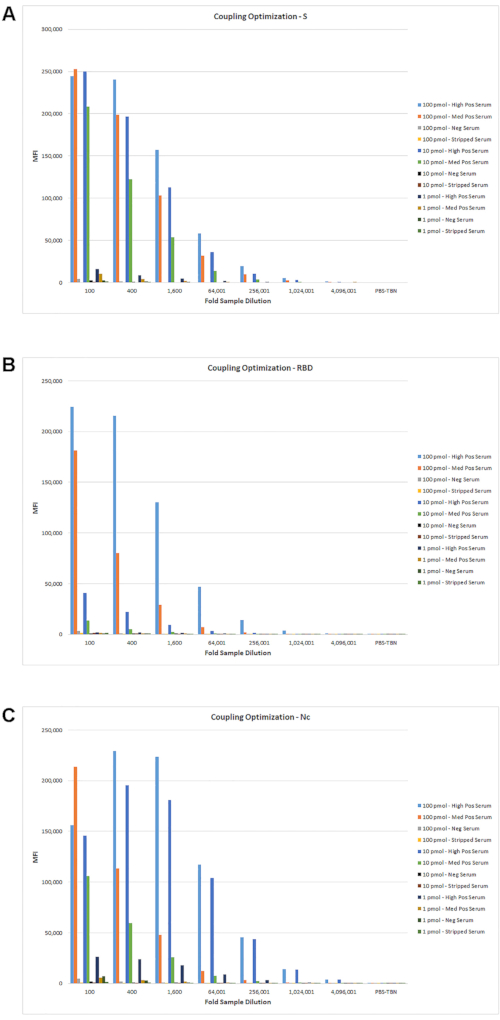
Figure 3: Optimization of serum dilution with different antigen coupling levels. Serum samples representing high, medium, low, and negative samples were tested with the different pmol antigen/106 bead couplings. A 4-fold serum titration was tested with a multiplex mix of antigen-coupled beads using the assay protocol described in section 5. The MFI values of the titration curves for S (A), RBD (B), and Nc (C) are shown. Please click here to view a larger version of this figure.
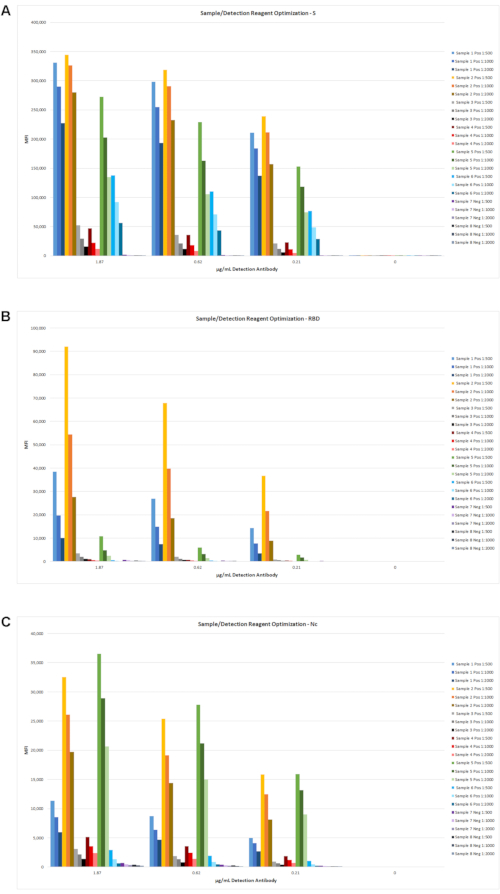
Figure 4: Determination of optimal serum dilution and detection reagent concentration. Eight serum samples, including negative patients (2 samples) and low- to high-positive (6 samples), were tested at additional serum dilutions with three different detection reagent concentrations. The MFI results are shown for S (A), RBD (B), and Nc (C). Based on these and other data (not shown), a sample dilution of 1:2,000 and a biotin detection antibody concentration of 0.62 µg/mL was selected. Please click here to view a larger version of this figure.
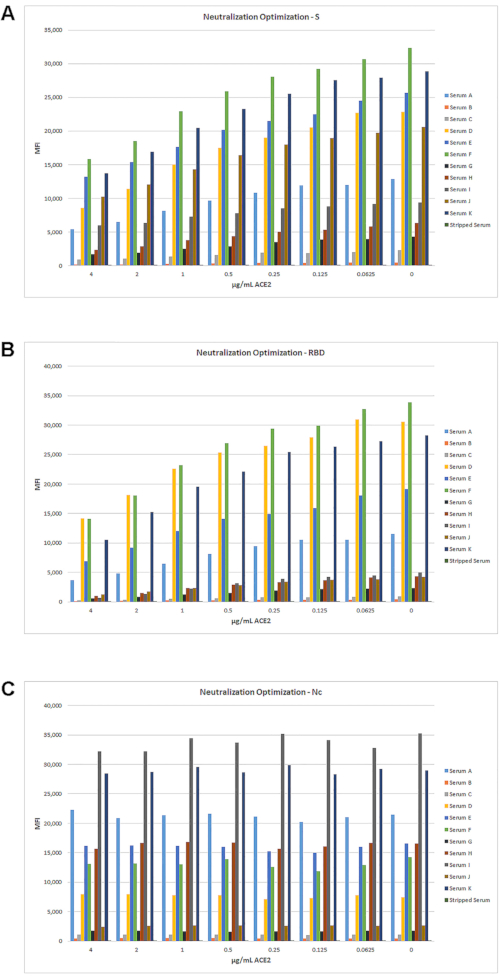
Figure 5: Optimization of single reporter neutralization assay. Modification of the single reporter serological assay to a neutralizing antibody detection assay was performed by adding an incubation step with ACE2 as a competitor, as described in Section 6. A set of 11 samples, ranging from low- to high-positive titer sera, and an IgG-striped serum sample were tested with a two-fold dilution series of ACE2 starting at 4 µg/mL, using standard assay conditions. Across this range of ACE2 concentrations, a decrease in MFI can be seen with increased ACE2 for S (A) and RBD (B), but not for Nc (C). Please click here to view a larger version of this figure.
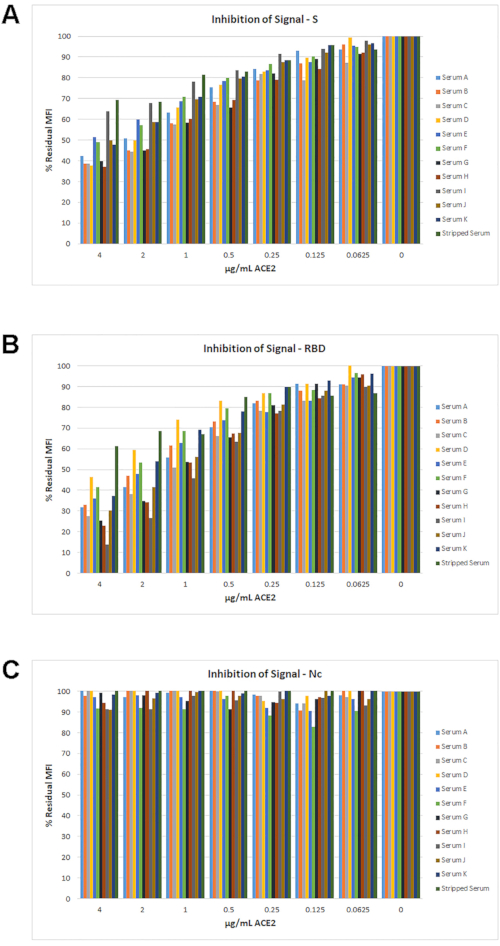
Figure 6: Percent inhibition of signal with ACE2. The percent residual signals for the set of 11 samples (from Figure 4) are shown. For each sample, regardless of its IgG titer, a maximum decrease of ≥30% MFI signal was achieved for S (A) and RBD (B) at the highest ACE2 concentration. For the Nc antigen (C) there was no significant inhibition of signal with any amount of ACE2 tested. Please click here to view a larger version of this figure.
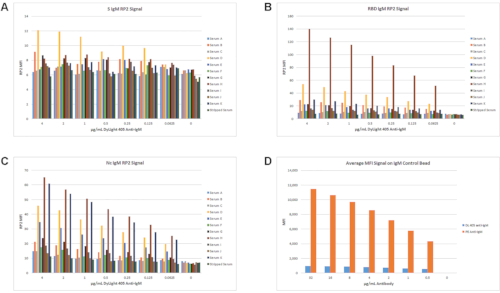
Figure 7: Test of DyLight 405 anti-IgM as RP2 IgM detection reagent. A set of 11 samples and IgG-stripped sera were used to test DL 405-conjugated anti-IgM as an RP2 detection reagent. The RP2 IgM MFI signals for S (A), RBD (B), and Nc (C) are shown. The highest MFI signal for any antigen with any sample was approximately 140 MFI units for RBD with sample H (B). Even the signal on the IgM control bead set was less than 1,000 MFI in the RP2 channel across the whole antibody titer range and did not show the increased dynamic range observed with the PE anti-IgM detection antibody in the RP1 channel (D). Please click here to view a larger version of this figure.
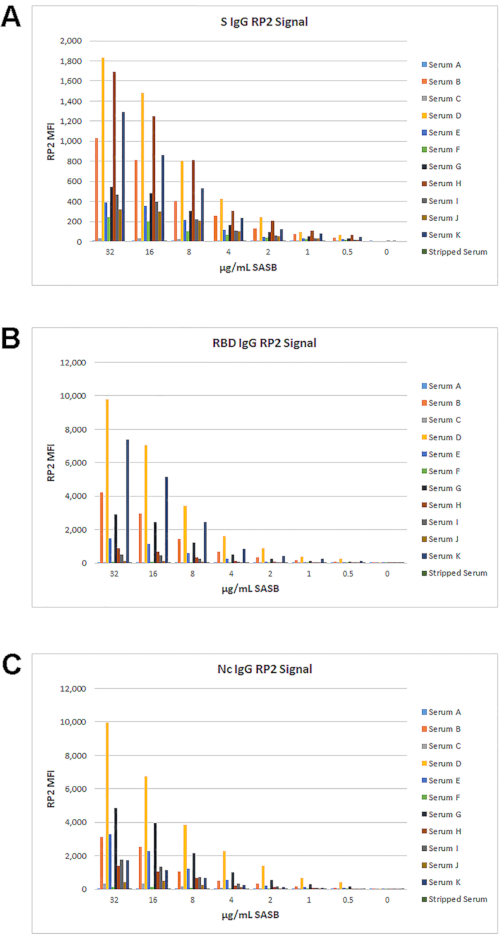
Figure 8: Optimization of SASB as RP2 reporter with Biotin anti-IgG. A set of 11 samples and IgG-stripped sera were used to test a dilution series of SASB with the standard 0.62 µg/mL biotin anti-IgG. The resulting IgG MFIs in the RP2 channel for S (A), RBD (B), and Nc (C) are shown. Please click here to view a larger version of this figure.
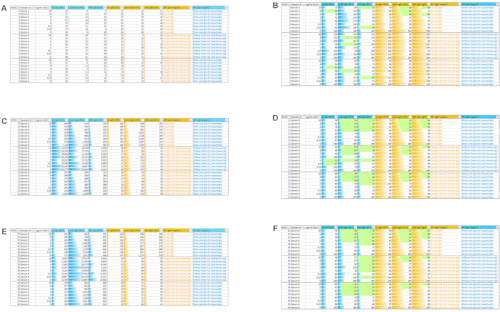
Figure 9: Comparison of three different combinations of RP1 IgM and RP1 IgG detection mixes. Three different detection antibody mixes were tested on 11 samples and IgG stripped sera. The combinations and final concentrations used are described in Table 1. All samples were tested with a 2-fold ACE2 dilutions, starting at 16 µg/mL. Data for samples at DFSO of 3, 12, and 30 days are shown. The MFI signals for RP1 IgM (orange) and RP2 IgG (blue) are shown in A (DFSO 3), C (DFSO 12), and E (DFSO 30). The ACE2 percent residual MFIs are shown in B (DFSO 3), D (DFSO 12), and F (DFSO 30). Signals representing a >30% decrease as compared to No ACE2 controls are highlighted light green. Please click here to view a larger version of this figure.
Discussion
This study expanded the functionality of a multiplex fluorescent microsphere assay, 3Flex, that qualitatively assesses the IgG response to infection by SARS-CoV-21. While many serological assays for COVID-19 detect a single antigen, this assay simultaneously evaluates S, RBD, and Nc antigens, and includes an internal antibody isotype control7. In addition, ACE2 is used as an indicator to detect neutralizing antibody titers to SARS-CoV-2.
Multi-antigen assays may be particularly useful in the future for discriminating immune responses between infected and vaccinated persons. With SARS-CoV-2, if only S and RBD antibodies are evaluated, it would be impossible to discern whether this was due to a past infection or to a vaccination antibody response. None of the vaccines that are currently in use target the Nc antigen, so by evaluating S/RBD and Nc antigens, it is possible to distinguish past viral infection (Nc- and S/RBD-positive) from a vaccination response (S/RBD-positive only; Nc-negative).
In the current study, the 3Flex serological and neutralization assays (sections 5 and 6) were transferred onto a new dual reporter flow analysis instrument (sections 7 and 8). Typical immunoassay protocols for bead-based multiplex assays are similar to standard ELISA protocols, following comparable steps for sample incubation, detection antibody/reporter incubation, and analysis of results8. Previous studies have also demonstrated how standard ELISA assays can be transferred to a bead-based multiplexing platform9.
The assay protocols could be seamlessly transferred from the predecessor single reporter instrument to the new dual reporter system, as shown by the results obtained for the test samples and controls (Figure 4 and Figure 5). In the serological assay, all positive serum samples demonstrated a characteristic dose-responsive decrease in signal corresponding to both a higher sample dilution and a lower detection antibody concentration, whereas the signals for the negative samples remained at background levels. Similarly, for the neutralization assay, decreasing signals for S and RBD, but not Nc, corresponded to increasing concentrations of the ACE2 competitor, whereas the IgG stripped serum was much less affected by the addition of ACE2. Pre-incubating the beads with ACE2 for 2 min prior to addition of the serum sample (as described in sections 6 and 8), was also compared to combining the beads with ACE2 and serum at the same time and produced little difference in the results (data not shown). However, because the results obtained with the beads plus ACE2 pre-incubation step were more consistent, it was the final procedure adopted for the neutralization assay protocol (sections 6 and 8).
Because the dual reporter system incorporates a second fluorescent reporter channel, both assays were converted into isotyping assays to simultaneously measure both IgG and IgM responses. The dual reporter functionality of the flow analyzer allows collection of fluorescent signals from two reporter detection reagents for each analyte in the multiplex for each sample, effectively doubling the data generated per sample in an assay. For development and optimization of the dual reporter assay protocols, several commercially available reporter dyes and detection antibodies were evaluated for the new RP2 channel (Figure 7 and Figure 8) to determine the best option(s) available. The anti-IgM antibody conjugated with the DL 405 reporter dye did not perform well in the RP2 channel (Figure 7), so biotin anti-IgG with SASB was subsequently evaluated for detection in the RP2 channel (Figure 8). Three combinations of RP1 and RP2 detection reagents were compared in the dual reporter neutralization assay (Table 1 and Figure 9) to determine the best performing combinations for simultaneous detection of IgG and IgM neutralizing antibodies. While there were significant differences in the signal intensity between the RP1 channel using PE-anti IgM and the RP2 channel using DL 549 anti-IgM, there was no significant difference in the measurement of the percent binding inhibition by ACE2.
Several limitations to the current method and this study are acknowledged. First, the samples tested and used in the method development and optimization were limited to sets of 8-11 samples. More samples will be tested in expanded studies to verify the method is fully optimized. Second, a limited number of reporter fluorophores and reporter pairs were tested. Further testing of all available reporters in all possible combinations will determine which reagents can be used successfully in this method. The anti-IgG antibody conjugated to biotin was different than the anti-IgG antibody conjugated to the BV 421 reporter. So, although variability in the signal intensity for the BV 421 anti-IgG existed, it could be due to the specificity of the antibody and not related to the reporter dye. Testing other available BV 421-conjugated antibodies may identify another antibody that would perform well in the RP2 channel. Future studies will also evaluate the combination of PE anti-IgM with BV 421 anti-human IgG for detection in RP1 and RP2, respectively. Last, even with the dual reporter capability of the instrument, assays are limited to two isotypes (two parameters) per reaction. If additional isotypes are to be measured or full isotyping is desired, then additional reactions using the same two reporter channels would need to be run in separate wells.
Bead-based multiplexing technology allows for rapid and flexible assay design with easy implementation into routine laboratory workflows3,4,10. This study demonstrated the ease in transferring the previously described 3Flex serological and neutralization assays for SARS-CoV-2 onto a flow analysis system for measuring IgG with a single reporter, or with slight modification, simultaneously measuring both IgG and IgM responses using two reporters. The dual reporter option has clear advantages over single reporter platforms because it can provide twice as much data per sample, using half the sample volume, and in half the number of reaction wells. With the appropriate reporter dyes and detection antibodies, isotyping assays can be easily developed and performed on the dual reporter flow analysis instrument.
Disclosures
Stephen Angeloni and Sherry Dunbar are employees of Luminex Corporation that produces some of the reagents and instruments that were used in this study. Open Access publication of this article was sponsored by Luminex Corporation
Acknowledgements
This report was funded by Luminex Corporation (Austin, TX). The authors thank Matthew Silverman PhD (Biomedical Publishing Solutions, Delray Beach, FL) for scientific editing assistance.
Materials
| Name | Company | Catalog Number | Comments |
|---|---|---|---|
| ACE2 (human) (rec.) | AdipoGen Life Sciences | AG-40B-0192-3050 | |
| Biotin-SP (long spacer) AffiniPure Goat Anti-Human IgG, Fcγ fragment specific | Jackson ImmunoResearch Laboratories | 109-065-098 | |
| Bovine Serum Albumin | MilliporeSigma | A7888 | Sigma-Aldrich |
| Branson 1800 Cleaner/water bath sonicator | Various | ||
| Brilliant Violet 421 AffiniPure Donkey Anti-Human IgG (H+L) | Jackson ImmunoResearch Laboratories | 709-675-149 | |
| Corning 96-well Black Flat Bottom Polystyrene NBS Microplate | Corning | 3650 | |
| Corning 96-well Microplate Aluminum Sealing Tape, Nonsterile | Corning | 6570 | |
| DyLight 405 AffiniPure Goat Anti-Human IgM, Fc5μ fragment specific | Jackson ImmunoResearch Laboratories | 109-475-043 | |
| DyLight 549 AffiniPure F(ab')2 Goat Anti-Human IgM Fc5μ specific | Jackson ImmunoResearch Laboratories | 109-506-129 | Discontinued but available from multiple vendors |
| eBioscience Streptavidin Super Bright 436 Conjugate | ThermoFisher Scientific | 62-4317-82 | |
| Fisherbrand Incubating Microplate Shaker | ThermoFisher Scientific | 02-217-757 | Fisher Scientific |
| Goat anti-Rabbit IgG (H+L) Cross-Adsorbed Secondary Antibody, PE | ThermoFisher Scientific | P-2771MP | |
| Luminex Magnetic Plate Separator | Luminex Corporation | CN-0269-01 | |
| MagPlex beads | Luminex Corporation | MC100XX-ID | |
| PE AffiniPure F(ab')2 Goat Anti-Human IgM Fc5μ specific | Jackson ImmunoResearch Laboratories | 109-116-129 | |
| Phosphate Buffered Saline | MilliporeSigma | P3813 | Sigma-Aldrich |
| SARS Nucleocapsid Protein Antibody | Novos Biologicals | NB100-56683 | Unconjugated, rabbit, polyclonal, Protein G purified |
| SARS Nucleocapsid Protein Antibody | Novos Biologicals | NB100-56049 | Unconjugated, rabbit, polyclonal, Protein A purified |
| SARS Spike Protein Antibody | Novos Biologicals | NB100-56047 | Unconjugated, rabbit, polyclonal, Protein G purified |
| SARS Spike Protein Antibody | Novos Biologicals | NB100-56048 | Unconjugated, rabbit, polyclonal, Protein G purified |
| SARS-CoV-2 (2019-nCoV) Spike S1 Antibody, Rabbit MAb | SinoBiological | 40150-R007 | |
| Sodium Azide | MilliporeSigma | S2002 | Sigma-Aldrich |
| Streptavidin, R-Phycoerythrin Conjugate (SAPE) | ThermoFisher Scientific | S21388 | premium grade |
| Tube Revolver/ Rotator | ThermoFisher Scientific | 88881001 | |
| TWEEN 20 | MilliporeSigma | P9416 | Sigma-Aldrich |
| xMAP Antibody Couplng Kit | Luminex Corporation | 40-50016 | |
| xMAP INTELLIFLEX DR-SE | Luminex Corporation | INTELLIFLEX-DRSE-RUO |
References
- Cameron, A., et al. A multiplex microsphere IgG assay for SARS-CoV-2 using ACE2-mediated inhibition as a surrogate for neutralization. Journal of Clinical Microbiology. 59 (2), 02489(2020).
- Waterboer, T., et al. Multiplex human papillomavirus serology based on in situ-purified glutathione s-transferase fusion proteins. Clinical Chemistry. 51 (10), 1845-1853 (2005).
- Pickering, J. W., et al. A multiplexed fluorescent microsphere immunoassay for antibodies to pneumococcal capsular polysaccharides. American Journal of Clinical Pathology. 117 (4), 589-596 (2002).
- Ayouba, A., et al. Development of a sensitive and specific serological assay based on Luminex technology for detection of antibodies to Zaire Ebola virus. Journal of Clinical Microbiology. 55 (1), 165-176 (2017).
- Hornbeck, P., Fleisher, T. A., Papadopoulos, N. M. Isotype determination of antibodies. Current Protocols in Immunology. Vastl, J. 116, 1-7 (2017).
- Angeloni, S. Multiplex Bead Mixes Made Easy with an Excel-Based Bead Calculator. , Available from: https://www.luminexcorp.com/blog/mmultiplex-bead-mixes-made-easy-with-an-excel-based-bead-calculator/ (2020).
- EUA Authorized Serology Test Performance. FDA. , Available from: https://www.fda.gov/medical-devices/coronavirus-disease-2019-covid-19-emergency-use-authorizations-medical-devices/eus-authorized-serology-test-performance (2020).
- Indirect ELISA protocol. Abcam. , Available from: https://www.abcam.com/ps/pdf/protocols/Indirect%20ELISA%20protocol.pdf (2021).
- Baker, H. N., Murphy, R., Lopez, E., Garcia, C. Conversion of a capture ELISA to a Luminex xMAP assay using a multiplex antibody screening method. Journal of Visualized Experiments. (65), e4084(2012).
- Pickering, J. W., Martins, T. B., Schroder, M. C., Hill, H. R. Comparison of a multiplex flow cytometric assay with enzyme-linked immunosorbent assay for auantitation of antibodies to tetanus, diphtheria, and Haemophilus influenzae Type b. Clinical and Diagnostic Laboratory Immunology. 9 (4), 872-876 (2002).
Reprints and Permissions
