This protocol describes the differentiation process of human induced pluripotent stem cells (iPSCs) into microglia-like cells for in vitro experimentation. We also include a detailed procedure for generating human synaptosomes from iPSC-derived lower motor neurons that can be used as a substrate for in vitro phagocytosis assays using live-cell imaging systems.
Method Article
Human Microglia-like Cells: Differentiation from Induced Pluripotent Stem Cells and In Vitro Live-cell Phagocytosis Assay using Human Synaptosomes
In This Article
Summary
Abstract
Microglia are the resident immune cells of myeloid origin that maintain homeostasis in the brain microenvironment and have become a key player in multiple neurological diseases. Studying human microglia in health and disease represents a challenge due to the extremely limited supply of human cells. Induced pluripotent stem cells (iPSCs) derived from human individuals can be used to circumvent this barrier. Here, it is demonstrated how to differentiate human iPSCs into microglia-like cells (iMGs) for in vitro experimentation. These iMGs exhibit the expected and physiological properties of microglia, including microglia-like morphology, expression of proper markers, and active phagocytosis. Additionally, documentation for isolating and labeling synaptosome substrates derived from human iPSC-derived lower motor neurons (i3LMNs) is provided. A live-cell, longitudinal imaging assay is used to monitor engulfment of human synaptosomes labeled with a pH-sensitive dye, allowing for investigations of iMG's phagocytic capacity. The protocols described herein are broadly applicable to different fields that are investigating human microglia biology and the contribution of microglia to disease.
Introduction
Microglia are the resident immune cells in the central nervous system (CNS) and play a crucial role in developing the CNS. Microglia are also important in the adult brain for maintaining homeostasis and actively responding to trauma and disease processes. Cumulative evidence shows that microglia are key contributors to the pathogenesis of multiple neurodevelopmental and neurodegenerative diseases1,2. Although current knowledge about microglial biology has been predominately derived from mouse models, recent studies have elucidated important differences between murine and human microglia, underscoring the need for developing technologies to study the genetics and biological functions of human microglia3,4. Isolation of microglia from dissected primary tissue can severely modify microglia properties5, potentially confounding results acquired with such cells. The overall goal of this method is to differentiate human iPSCs into iMGs, thereby providing a cell culture system to study human microglia under basal conditions. Furthermore, a phagocytosis assay using a fully human model system is included herein as a means to study the functionality of iMGs, both as a quality control measure and to assess iMG dysfunction in the context of disease.
Multiple protocols for microglia differentiation from iPSCs have recently emerged in the literature6,7,8,9,10. Potential disadvantages of some protocols include extended or long periods of differentiation, the addition of multiple growth factors, and/or complex experimental procedures6,9,10. Here, a "user-friendly" differentiation method is demonstrated that recapitulates aspects of microglia ontogeny through differentiation of iPSCs into precursor cells termed primitive macrophage precursors (PMPs)7,11. PMPs are generated as described previously, with some optimizations presented herein12. The PMPs mimic MYB-independent yolk-sac-derived macrophages, which give rise to microglia during embryonic development by invading the brain before blood-brain barrier closure13. To terminally differentiate PMPs into iMGs, we used a fast and simplified monoculture method based on protocols by Haenseler et al. and Brownjohn et al., with some modifications to generate an efficient microglia differentiation method in which iMGs robustly express microglia-enriched markers7,8. This differentiation method can be reproduced in laboratories with expertise in the culture of iPSCs and with research goals aiming to study microglia biology using a human model system.
iPSC-derived microglia represent a biologically relevant source of human microglia for in vitro experimentation and are an important tool to investigate microglial canonical functions, including phagocytosis. Microglia are the professional phagocytes of the brain and CNS, where they clear cell debris, aggregated proteins, and degraded myelin14. Microglia also function in synaptic remodeling by engulfing synapses and in the defense against external infections through phagocytosis of pathogens15,16. In this protocol, phagocytosis by iMGs is assessed using human synaptosomes as material for iMG engulfment. To this end, a description for isolating synaptosomes derived from human i3LMNs is described. The i3LMN-derived human synaptosomes are labeled with a pH-sensitive dye that allows for quantification of synaptosomes localized within acidic compartments during phagosome processing and degradation in vitro. A phagocytosis assay using live-cell microscopy is shown for monitoring the dynamic process of microglia engulfment in real-time. This functional assay establishes a basis to investigate possible defects in microglial phagocytosis in health and disease using a complete human system.
Protocol
NOTE: All the reagents used in this protocol must be sterile, and all the steps must be performed in a biosafety cabinet under sterile conditions. All the iPSC lines, as well as maintenance and differentiation media, are described in the Table of Materials. The microglia differentiation method illustrated below is based on previously published protocols7,8,12 with new modifications described herein.
1. Microglia differentiation
NOTE: An overview of the protocol is summarized in Figure 1.
- Induced pluripotent stem cell (iPSC) culture
NOTE: Further details describing iPSC culture techniques can be found elsewhere17.- Thawing and maintenance
- Prepare iPSC medium, aliquot the medium, and store at -20 °C for up to 6 months. Thaw the aliquots overnight at 4 °C and use them for up to 1 week. Leave the media at ambient temperature for at least 1 h before use.
- Coat the wells of a 6-well plate by adding 1 mL of 10 µg/mL of laminin 521 diluted in DPBS containing calcium and magnesium18. Keep the plates in an incubator at 37 °C and 5% CO2 for at least 2 h or preferably overnight. Once diluted, store the laminin at 4 °C for 3 months.
- Prepare 10 mM Rho kinase inhibitor Y27632 (ROCK Inhibitor) stock solution by diluting in sterile water. Make single-use aliquots of ROCK inhibitor solution and store them at -20 °C for up to 1 year.
- Prepare 0.5 mM EDTA by diluting the stock solution of 0.5 M EDTA in DPBS.
- To thaw a vial of frozen iPSCs, place the vial in a water bath at 37 °C until it is mostly thawed. Immediately transfer the content of the vial to a 15 mL conical tube containing 4 mL of iPSC medium. Centrifuge at 500 × g for 1 min.
- Aspirate the supernatant and resuspend the cells by adding 1 mL of iPSC medium containing 10 µM ROCK inhibitor slowly against the wall of the tube to avoid disturbance of the colonies.
- Add 1.5 mL of iPSC medium containing 10 µM ROCK inhibitor to each of the coated wells and transfer the resuspended colonies drop by drop to the wells containing the medium.
NOTE: Use 5-7 drops from step 1.1.1.6 for culture maintenance but adjust the optimal seeding density for every iPSC line. - Evenly distribute the cells in the wells by manually shuffling the plate side-to-side and back to front. Place the cells in an incubator at 37 °C and 5% CO2. The next day, completely replace the medium by adding fresh iPSC medium without ROCK inhibitor.
- For maintenance, change the medium every day until the cells reach 80% confluency.
NOTE: The cells can be maintained without changing the medium for 2 days if the iPSC medium used allows a flexible feeding schedule. It is advised to limit this to one time per passage and only if the cells are less than 50% confluent.
- Splitting
- Aspirate the medium and wash the cells with 1 mL of DPBS (without calcium and magnesium).
- To dislodge the cells, add 1 mL of 0.5 mM EDTA and incubate for 2-3 min at room temperature until the edges of the cell colonies lift from the surface of the well. Wash the cells again with DPBS and add 1 mL of iPSC medium.
- Dissociate the cell colonies by gently scraping them using a cell lifter. Scrape each area of the well only once to avoid disturbing the colonies.
NOTE: Alternative methods to dislodge the colonies from the well can be found elsewhere17. - Using a 1 mL pipette tip, collect the cells and transfer them drop by drop at a 1:6 ratio (cells to medium) into precoated wells (as mentioned in step 1.1.1.2) containing 1.5 mL of iPSC medium.
- Thawing and maintenance
- iPSC differentiation to microglia-like cells (iMGs)
NOTE: The small molecules and growth factors are dissolved in sterile-filtered 0.1% bovine serum albumin in DPBS to a stock concentration 1,000x higher than the final concentration. It is recommended to differentiate iPSCs into iMGs during early passages. Routine karyotyping of iPSC lines is advised.- Prepare standard coating solution
- Thaw the stock solution of an extracellular matrix coating reagent on ice at 4 °C overnight.
- Prechill microcentrifuge tubes and filter pipette tips at 4 °C.
- Aliquot 250 µL of the concentrated extracellular matrix coating reagent into each tube and immediately place on ice. Store the aliquots at -20 °C.
- To prepare the coating solution, thaw one of the extracellular matrix coating reagent aliquots on ice at 4 °C overnight.
- Add 50 mL of ice-cold DMEM-F12 optimized for growth of human embryonic and induced pluripotent stem cells (referred as to DMEM-F12) media to a prechilled conical tube and keep it on ice.
- Chill a 1 mL pipette tip by pipetting ice-cold DMEM-F12 up and down multiple times, and then immediately use the pipette tip to transfer 250 µL of the extracellular matrix coating reagent into the conical tube containing the DMEM-F12 medium.
NOTE: The standard coating solution can be stored for 2 weeks at 4 °C.
- Embryoid body (EB) formation
- Prepare EB medium that can be maintained at 4 °C for up to 4 days.
- Once iPSCs have reached 80% confluency, dissociate the colonies by washing with 1 mL of DPBS and adding 1 mL of a dissociation reagent for 2 min at 37 °C. Dislodge the colonies using a cell lifter by scraping multiple times to create a single-cell suspension. Collect the cells and transfer everything to a 15 mL conical tube containing 9 mL of DPBS.
- Centrifuge the cells at 500 × g for 1 min, remove the supernatant, and resuspend the cells in 1 mL of EB medium. Take 10 µL of cells and dilute 1:1 with Trypan blue. Count the cells with a hemacytometer, and based on the cell count, dilute the cell-stock to a final dilution of 10,000 cells per 100 µL. For plating cells, add 100 µL of the diluted cells per well into a low adherence, round-bottom, 96-well plate.
NOTE: Generally, 48 wells of the 96-well plate can be obtained from each 80% confluent well of iPSCs. - Centrifuge the plate at 125 × g for 3 min and incubate at 37 °C and 5% CO2 for 4 days. Perform a half-medium change on day 2 by using a multichannel pipette and gently collecting 50 µL of old medium, and then adding back 50 µL of fresh EB medium.
NOTE: On day 4, iPSCs will form spherical cellular structures termed EBs as described in the results section. The EB differentiation process can be extended up to 7 days, if necessary.
- Generation of primitive macrophage precursors (PMPs)
- Prepare PMP base medium, sterile-filter, and store it at 4 °C for up to 1 month.
- Coat the wells of a 6-well plate by adding 1 mL of ice-cold Matrigel coating solution and incubate at 37 °C and 5% CO2 for at least 2 h or preferably overnight.
- On day 4 of EB differentiation, transfer the EBs to the Matrigel-coated wells by collecting the EBs with 1 mL pipette tips (using a pipette). Pipette up and down once or twice to dislodge the EBs from the well. Hold the 6-well plate at a tilted angle to allow for the EBs to settle down at the edge of the well.
NOTE: Nine or ten EBs can be plated per coated well. - Once all the EBs have settled down, gently pipette and remove the old medium using a 1 mL pipette tip while keeping the EBs at the edge of the well. Add 3 mL of freshly prepared PMP complete medium to each well. Evenly distribute the cells in the wells by manually shuffling the plate side-to-side and back to front. Place the plate in the incubator at 37 °C and 5% CO2.
- Do not disturb the plate for 7 days to allow the EBs to attach to the bottom of the well. After that time, perform a half-medium change using PMP complete medium.
NOTE: At this point, most of the EBs should be attached to the plate. Any floating EBs can be removed. - After 5-7 days, inspect the EBs under a light field microscope at 4x magnification to ensure that they are attached to the bottom of the wells. Change the medium as described in 1.2.3.5. On day 21, perform a complete medium change with 3 mL of PMP complete medium.
NOTE: Myeloid progenitors floating in the medium may be evident at this point. These cells should be discarded during the medium change. - On day 28, look for round cells referred to as PMPs in the supernatant and collect the medium containing the PMPs using a 10 mL pipette and automatic pipettor. Take care not to disturb the EBs. Transfer the PMPs and the medium to a 15 mL conical tube and proceed as described in step 1.2.4.
NOTE: Usually PMPs from the same iPSC line can be collected from five wells of a 6-well plate and pooled together in a single 15 mL conical tube. - Add 3 mL of fresh PMP complete medium for further maintenance of the EBs. As PMPs continuously emerge from EBs for more than 3 months, collect them every 4-7 days (do not allow the medium to change color to a yellow tone) as described in steps 1.2.3.7 and 1.2.3.8.
NOTE: Although PMPs can be collected for several months, they may change their phenotype over time.
- Differentiation to iMGs
- Prepare iMG base medium (Table of Materials), sterile-filter and store it at 4 °C for up to 3 weeks.
- Once the PMPs have been collected into a 15 mL conical tube, centrifuge them at 200 × g for 4 min. Aspirate the supernatant and resuspend the PMPs using 1-2 mL of iMG basal medium. Count the cells using a hemocytometer by taking a small aliquot and diluting 1:1 with Trypan blue.
NOTE: 0.5-1.5 × 10⁶ PMPs are normally obtained every week depending on the iPSC line and the age of the EB culture. - Centrifuge the rest of the cells again at 200 × g for 4 min. Dilute the PMPs to the desired concentration such that cells are plated at a density of ~105/cm2 on cell culture-treated plates using freshly prepared iMG complete medium. Perform a half-medium change using freshly prepared iMG complete medium every 3-4 days throughout 10-12 days to allow for terminal differentiation.
NOTE: At this point, the cells should acquire microglia-like morphology. To confirm the commitment of PMPs to microglia fate, immunofluorescence analysis is performed to corroborate the expression of microglia-enriched markers such as purinergic receptor P2RY12 and transmembrane protein 119 (TMEM119)9. - To preserve cell health and viability, perform all the experiments between days 10 to 12 of iMG differentiation.
- Prepare standard coating solution
2. Phagocytosis assay using motor-neuron-derived human synaptosomes
- Transcription factor-mediated differentiation of iPSC-derived lower motor neurons (i3LMNs)
NOTE: A WTC11 line with stable insertion of the hNIL inducible transcription factor cassette containing the neurogenin-2 (NGN2), islet-1 (ISL1), and LIM homeobox 3 (LHX3) transcription factors into the CLYBL safe harbor locus was used for the differentiation process as described previously17. The iPSC line was maintained as described in step 1.1.1 but with the coating conditions described in step 1.2.1. Any extracellular matrix coating reagent can be used for culturing iPSCs that will be used for neuronal differentiation since laminin 521 is not required. All the media are equilibrated to ambient temperature for at least 1 h before use.- Coat 10 cm dishes with 5 mL of standard coating solution as described in step 1.2.1.
NOTE: Here, 3-4 10 cm dishes were used per differentiation. - Prepare Induction Base medium, sterile-filter, and store it at 4 °C for up to 3 weeks.
- Prepare Neuron medium, sterile-filter, and store it at 4 °C for up to 2 weeks.
- Prepare borate buffer by mixing 100 mM boric acid, 25 mM sodium tetraborate, and 75 mM sodium chloride in sterile water. Adjust the pH to 8.5 and sterile-filter it.
- Once iPSCs have reached 80% confluency, wash the cells with DPBS and dislodge the colonies by adding 0.5 mM EDTA.
NOTE: Two wells are usually sufficient for each 10 cm dish. - Incubate the cells for 4-5 min at ambient temperature. Remove the EDTA and add 3 mL of DMEM/F12 with HEPES to each well.
- Scrape the cells using a cell lifter and use a 10 mL pipette to remove the cells from the bottom of the well by gently pipetting up and down 2-3x.
- Collect the cells in a 15 mL conical tube and centrifuge at 300 × g for 3 min.
- Resuspend the cells in 3 mL of iPSC medium containing 10 µM ROCK inhibitor and count them using a hemacytometer.
- Plate 1.5 × 10⁶ iPSCs in a precoated 10 cm dish with 12 mL of iPSC medium containing 10 µM ROCK inhibitor.
- The next day, remove the medium and wash the cells with DPBS. Add 12 mL of freshly prepared Complete Induction medium to induce the expression of the transcription factors.
- On day 2, coat 10 cm dishes with 5 mL of neuron coating solution prepared with equal volumes of 0.1 mg/mL of poly-D-lysine and 1 mg/mL of poly-L-ornithine diluted in borate buffer. Incubate overnight at 37 °C and 5% CO2.
- On day 3, wash the coated dishes with sterile water 3x, aspirate the water completely, and let the dishes dry by tilting the plates and leaving them partially uncovered inside a biosafety cabinet for at least 1 h at ambient temperature.
- Once the dishes have fully dried, coat them with 6 mL of Complete Induction medium supplemented with 15 µg/mL of laminin and 40 µM BrdU for at least 1 h at 37 °C and 5% CO2.
NOTE: BrdU treatment is recommended to eliminate mitotically active cells and thus to enhance the purity of the neuronal cultures. The effects of BrdU on neuronal health are minimal. - Treat the differentiating cells with 3 mL of dissociation reagent per 10 cm dish and incubate for 3-4 min at ambient temperature.
- Add 6 mL of DPBS into the plate without removing the dissociation reagent and pipette the cells in solution up and down 4-5x with a 10 mL pipette to dissociate the cells.
- Collect the cell suspension and pass it through a 40 µm cell strainer into a 50 mL conical tube. Add 1 mL of Induction base medium to rinse the strainer.
- Centrifuge the cells at 300 × g for 5 min. Aspirate the medium and resuspend the cells in 3 mL of Complete Induction medium containing 40 µM BrdU.
- Count the cells with a hemocytometer. Plate approximately 2.5 × 10⁶ cells per 10 cm dish into precoated dishes by diluting the cells in 6 mL of Complete Induction medium containing 40 µM BrdU without removing the coating solution added in step 2.1.14.
- On day 4, aspirate the medium, wash the cells 1x with DPBS, and add fresh Complete Induction medium containing 40 µM BrdU.
- On day 6, aspirate the medium, wash the cells 1x with DPBS, and add Neuron medium supplemented with 1 µg/mL of laminin.
- At day 9, change 1/3rd of the medium by replacing it with fresh Neuron medium supplemented with 1 µg/mL of laminin.
- Maintain i3LMNs for an additional 25 days by performing half medium changes with Neuron medium supplemented with fresh 1 µg/mL of laminin every 3-4 days.
NOTE: At this timepoint, i3LMNs should present a neuronal morphology with long processes. Neurons also tend to form clumps or clusters of cells. A more detailed description of how to validate the differentiation of i3LMNs can be found elsewhere17.
- Coat 10 cm dishes with 5 mL of standard coating solution as described in step 1.2.1.
- Synaptosome purification and labeling
NOTE: Maintain sterile conditions and perform all steps inside a biosafety cabinet.- Wash i3 LMNs twice with DPBS.
- Add 2 mL of ice-cold cell lysis reagent for isolation of synaptosomes, incubate on ice for 2 min, and firmly scrape the neurons.
- Transfer the lysate to multiple 2 mL microtubes (~1.5 mL lysate per tube) and centrifuge at 1,200 × g for 10 min at 4 °C.
NOTE: Maintain the tubes on ice throughout this procedure. - Collect the supernatant (discard the pellet) and centrifuge at 15,000 × g for 20 min at 4 °C. Save and resuspend the pellet containing the synaptosomes with a similar volume (as the original lysate) of 5% DMSO in DPBS.
NOTE: The synaptosomes can be immediately labeled with a fluorophore or stored at -80 °C for future use. - Perform a Bicinchoninic acid (BCA) protein assay for all tubes to assess the total yield of protein in the synaptosome preparation.
NOTE: Other assays to measure protein concentration can be used. The total protein yield obtained from different preparations has been included in Table 1 as a reference. It is recommended to perform western blot analysis of the synaptosome preparation to confirm the presence of presynaptic and postsynaptic proteins. Here, the presynaptic marker, synaptophysin (SYP), and the postsynaptic marker, postsynaptic density protein 95 (PSD95) were chosen for western blotting analysis as described previously19. - Prepare a solution of 100 mM sodium bicarbonate in water, adjust the pH to 8.5, and sterile-filter.
- Solubilize 1 mg of lyophilized powder of the used pH-sensitive dye into 150 µL of DMSO. Make single-use aliquots and store them at -80 °C.
- Centrifuge the synaptosomes at 15,000 × g for 5 min at 4 °C.
- Dilute up to 1 mg of synaptosomes in 100 µL of 100 mM sodium bicarbonate solution.
- To label the synaptosomes, add 1 µL of the reconstituted pH-sensitive dye per 1 mg of synaptosomes and cover the reaction with aluminum foil to avoid light exposure. Shake at room temperature for 2 h using a tube shaker.
- Add 1 mL of DPBS to the tube and centrifuge the labeled synaptosomes at 15,000 × g for 5 min at 4 °C.
- Remove the supernatant and perform four additional washes as described in step 2.2.11.
- After the final wash and spin, remove the supernatant as much as possible without disturbing the pellet and resuspend the labeled synaptosomes with 5% DMSO in DPBS at a volume for the desired concentration (0.7 µg/µL used here). Prepare single-use aliquots and store at -80 °C. Be sure to avoid light exposure to the labeled synaptosomes.
- Live-cell phagocytosis assay
- Plate 20-30 × 104 PMPs into 96-well plates in 100 µL of iMG complete medium and follow the differentiation process for 10 days as indicated in step 1.2.4.
- On the day of the assay, prepare the nuclear staining solution by adding 1 drop of a nuclear stain for live cells into 2 mL of iMG basal medium.
- Remove 40 µL of medium per well of the 96-well plate and add 10 µL of the nuclear staining solution using a multichannel pipette. Incubate the plate at 37 °C and 5% CO2 for 2 h.
- Thaw the labeled synaptosomes on ice and gently sonicate using a water sonicator for 1 min. Immediately transfer the synaptosomes back to ice. Dilute the labeled synaptosomes in iMG complete medium at a ratio of 1 µL of synaptosomes per 50 µL of medium.
NOTE: The concentration of synaptosome is assay-dependent and may require optimization. To maintain a relatively low percentage (i.e., 0.1% or less) of DMSO in the medium, it is advised not to add more than 2 µL of synaptosomes per well. - As negative control, pretreat some of the wells with cytochalasin D to inhibit actin polymerization and thus phagocytosis. Prepare a solution of 60 µM cytochalasin D in iMG complete medium. Add 10 µL of this solution to each well for a final concentration of 10 µM and incubate at 37 °C and 5% CO2 for 30 min.
- Remove the plate from the incubator and incubate at 10 °C for 10 min. Maintain the plate on ice and add 50 µL of medium containing synaptosomes prepared as described in step 2.3.4.
- Centrifuge the plate at 270 × g for 3 min at 10 °C and maintain the plate on ice until imaging acquisition.
- Imaging acquisition and analysis
- Insert the plate into a live-cell imaging reader and select the wells to be analyzed.
- Select a 20x objective lens.
- Adjust the focus, light-emitting diode (LED) intensity, integration time, and gain of the brightfield and blue (4',6-diamidino-2-phenylindole [DAPI]) channels. The synaptosome fluorescence should be negligible at the initial time point. To focus on the red (RFP) channel, use the brightfield channel as a reference. The integration time and gain can vary between experiments; use these initial settings for the red channel: LED: 4, integration time: 250, and gain: 5.
- Select the number of individual tiles to be acquired in a montage per well (acquire 16 tiles at the center of the well, thereby imaging approximately 5% of the total well area). Set the temperature to 37 °C and the desired time interval for imaging.
NOTE: Images were acquired every 1 - 2 h for up to 16 h in this study. - Open the analysis software.
- Open the experiment that contains the images. Click on the Data Reduction icon.
- In the menu, pick Imaging Stitching under Imaging Processing to create a complete image from the 4 x 4 individual tiles in the montage with the parameters described in Table 2.
- Once the stitched images have been created, define an intensity threshold using the DAPI and RFP channels for these images. Open an image and click on Analyze; under Analysis, select Cellular Analysis, and under Detection Channel, pick a stitched image either in the DAPI or RFP channels. Go to the Primary Mask and Count tab and establish a threshold value and object size values that properly select the cell nuclei in the DAPI channel or the synaptosome signal in the RFP channel. Repeat the process with different images until parameters that can be applied to the entire experiment are optimized.
NOTE: Suggested values can be found in Table 2. - To count the number of nuclei, go to the Data Reduction menu, and under Image Analysis, select Cellular Analysis. Go to the Primary Mask and Count tab and under Channel, select the DAPI stitched images and use the parameters described in Table 2.
- Go to the Calculated Metrics tab and select Cell Count. To obtain the area of the synaptosome signal, go to the Data Reduction menu and under Analysis, select Cellular Analysis.
- Go to the Primary Mask and Count tab and under Channel, select RFP stitched images and use the parameters detailed in Table 2.
- Go to the Calculated Metrics tab and select Object Sum Area. In the Data Reduction tab , click on OK and allow the software to analyze all the acquired images.
- Export the Object Sum Area and Cell Count values for each time point. Divide the Object Sum Area by the Cell Count to calculate the normalized area per time point. If comparing multiple treatments or genotypes, calculate the phagocytosis index using equation (1):
 (1)
- Save the results and integrate the data.
Results
To generate iMGs using this protocol, it is important to start with undifferentiated iPSCs that show compact colony morphology with well-defined edges (Figure 2A). Dissociated iPSCs maintained as described in the EB formation section will form spherical aggregates, termed EBs, which will grow in size until day 4 of differentiation (Figure 2B). Once the EBs are collected and plated in the appropriate conditions for PMP generation, they attach to the Matrigel-coated plates, and a layer of cells will spread and surround the spherical aggregates (Figure 2C). Unhealthy EBs will detach from the plate and should be eliminated. From day 14 to 21 of PMP generation, potentially different cell types can emerge and will float in the medium; these cells should be discarded during media changes12. On day 28, round cells with a large cytoplasm-to-nucleus ratio will appear in suspension (Figure 2D), termed PMPs. These cells are produced continuously and can be harvested weekly during medium changes for up to 3 months. The number of PMPs harvested every week varies and depends on the iPSC line and the age of the culture; the yield generally declines with time. It is strongly recommended to culture iPSCs in laminin 521-coated plates instead of Matrigel, as the PMP yield is higher when iPSCs are maintained in the former conditions as reported previously and in this study (Figure 2E)18.
After PMPs have been exposed to iMG medium for 10-12 days, the cells acquire a microglia-like-morphology with a small cytoplasm and the presence of elongated processes (Figure 3A). To verify microglia identity, we performed immunofluorescence staining with antibodies against the myeloid marker ionized calcium-binding adapter molecule 1 (IBA1) and the microglia-enriched markers purinergic receptor P2RY12 and transmembrane protein 119 (TMEM119) as described previously20 (also see the Table of Materials). Typically, >95% of the cells express IBA1 and approximately 90% of the cells express P2RY12 and TMEM119 (Figure 3B).
To assess the phagocytic capacity of iMGs, i3LMN-derived human synaptosomes labeled with a pH-sensitive dye were used. To verify that the synaptosome preparation retains canonical structural properties, the enrichment of the presynaptic marker, synaptophysin (SYP), and the postsynaptic marker, postsynaptic density protein 95 (PSD95)19 were confirmed by Western blot analysis (Figure 4) performed as described before20 (also see the Table of Materials). Synaptosomes labeled with a pH-sensitive dye become fluorescent after being engulfed by iMGs and once they are localized within intracellular acidic (i.e., low pH) compartments.
At the initial time point, the red fluorescent signal was minimal, as most of the synaptosomes were not yet phagocytosed. After 30 min, a red fluorescent signal was detected and increased further over time. By 10 h, the red fluorescent signal was robust, as most of the synaptosomes had been engulfed and were localized to acidic intracellular compartments via the process of phagocytosis (Figure 5A). Cytochalasin D is an actin polymerization inhibitor widely used to block phagocytosis. As expected, we observed a strong reduction of the red fluorescent signal in cytochalasin D-treated iMGs, indicating that the detected signal results from phagocytic events. We also noticed that iMGs show changes in morphology after 10 h of phagocytosis that were not detected in the cytochalasin D-treated iMGs, possibly due to the lack of actin remodeling in the cytochalasin D-treated iMGs. Changes in microglia morphology are usually associated with activation status2.
By using the described automated quantification method, we measured the total area of red signal at each time point and normalized it to the cell number obtained by counting the nuclei. The results indicate that the area of engulfed synaptosomes increased with time until a plateau was reached at 16 h. As expected, the area of red signal from cytochalasin D-treated cells did not increase with time, since phagocytosis was inhibited (Figure 5B). Together, these results indicate that iMGs are capable of phagocytosing brain-disease-relevant material and are suitable for functional studies.
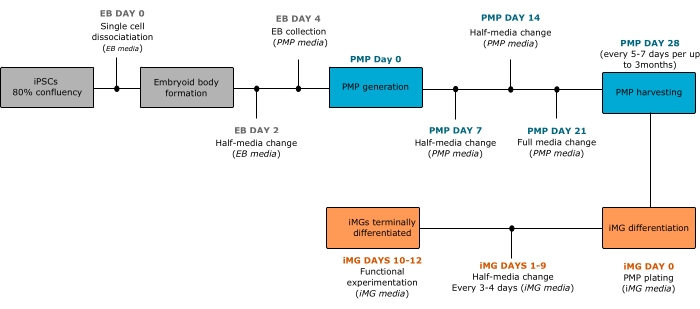
Figure 1: Schematic of the protocol to differentiate iPSCs into microglia-like cells. On day 0, once iPSCs have reached 80% confluency, the colonies are dissociated into single cells and cultured in EB medium to induce EB formation. On day 4, EBs are collected and plated in PMP medium to induce PMP generation. After 28 days, PMPs are collected and terminally differentiated into iMGs by using iMG medium. PMPs can be collected weekly for up to 3 months. Abbreviations: iPSCs = induced pluripotent stem cells; iMGs = microglia-like cells; EB = embryoid body; PMP = primitive macrophage precursor. Please click here to view a larger version of this figure.

Figure 2: Cell morphology assessed by light microscopy at the differentiation stages from iPSCs to PMPs. (A) iPSCs maintained in iPSC medium until 80% confluency. (B) An embryoid body after 4 days of differentiation in EB medium. (C) EBs attached to coated plates and (D) PMPs emerging in suspension from EBs after 28 days of culture in PMP medium. (E) Number of PMPs collected from ~48 EBs at week 1 (after 28 days of PMP differentiation) and week 12. Bar graphs show the average of six independent differentiations (data points) from two different iPSC lines. Statistics were obtained by two-way ANOVA and Šídák's multiple comparisons test. Scale bars = 1,000 µm (A), 400 µm (B-D). Abbreviations: iPSCs = induced pluripotent stem cells; iMGs = microglia-like cells; EB = embryoid body; PMP = primitive macrophage precursor. Please click here to view a larger version of this figure.

Figure 3: iMGs differentiated by this protocol display bona fide microglia characteristics after 10 days of terminal differentiation. (A) Representative brightfield image of iMGs presenting microglia-like morphology. Scale bar= 400 µm. (B) Representative immunofluorescence images of iMGs expressing the myeloid/microglia markers IBA1, P2RY12, and TMEM119. Scale bars= 400 µm (A), 50 µm (B). Abbreviations: iMGs = microglia-like cells; IBA1 = ionized calcium-binding adapter molecule 1; P2RY12 = purinergic receptor P2RY12; TMEM119 = transmembrane protein 119; DAPI = 4',6-diamidino-2-phenylindole. Please click here to view a larger version of this figure.
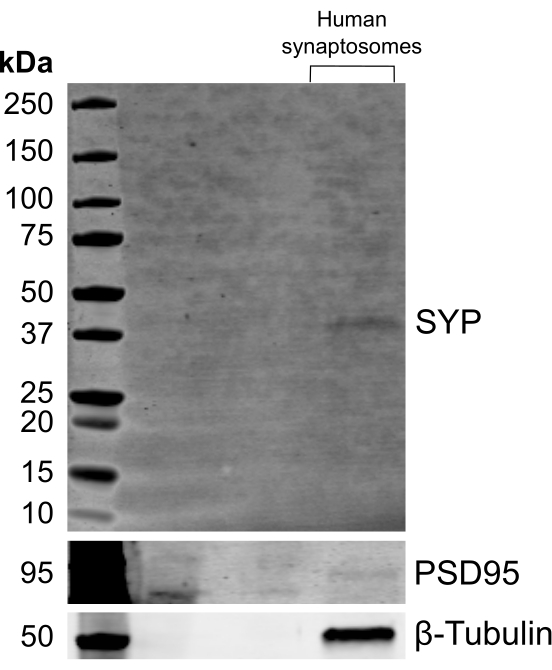
Figure 4: i3LMN-derived human synaptosomes expressed synaptic markers by western blot analysis. Representative western blot analysis of a human synaptosome preparation derived from i3LMN after 28 days of culture probed with the postsynaptic marker, PSD95, the presynaptic marker, SYP, and β-tubulin. Abbreviations: i3LMN = iPSC-derived lower motor neurons; PSD95 = postsynaptic density protein 95; SYP = synaptophysin. Please click here to view a larger version of this figure.

Figure 5: Phagocytosis assay of iMGs using human synaptosomes labeled with a pH-sensitive dye and monitored by live-cell, longitudinal imaging. (A) Representative brightfield and fluorescence montages of iMGs with nuclear staining (blue channel) exposed to labeled human synaptosomes (red channel) with and without cytoD treatment at the indicated time points. The montages were created by postacquisition processing of 16 tiles acquired at 20x. Scale bars= 400 µm. (B) Quantification of the area of the synaptosome fluorescent signal normalized to the cell number. Data points indicate the average ± SEM of three technical replicates. Each curve shows the quantification for two independent differentiations (iMGs 1 and 2) from one iPSC line with and without cytoD treatment. Abbreviations: iMGs = microglia-like cells; cytoD = cytochalasin D. Please click here to view a larger version of this figure.
| Number of 10 cm dishes of DIF28 i3LMN | Total protein (µg) |
| 2 | 143.2 |
| 2 | 34.9 |
| 5 | 613.8 |
| 7 | 1,159 |
Table 1: Total protein yield after synaptosome isolation from iPSC-derived lower-motor neurons at 28 days of differentiation. Total protein amount obtained from four independent differentiations after synaptosomes were extracted. Different numbers of 10 cm dishes containing i3LMN were harvested in each differentiation. The protein yield was measured by BCA protein assay. Abbreviations: iPSCs = induced pluripotent stem cells; i3LMN = iPSC-derived lower motor neurons; DIF28 = 28 days of differentiation; BCA = bicinchoninic acid.
| Parameters | Value |
| Registration channel | Bright field, DAPI, and RFP |
| Fusion method | Linear blend |
| Crop Stitched Image to Remove Black Rectangles on the Borders | Checked |
| Downsize Final Image | Checked |
| Parameters | Value |
| Threshold | Determined by user |
| Background | Dark |
| Split touching objects | Checked |
| Fill holes in masks | Checked |
| Min. object size | 7 µm |
| Max. object size | 30 µm |
| Include primary edge objects | Checked |
| Analyze entire image | Checked |
| Parameters | Value |
| Threshold | Determined by user |
| Background | Dark |
| Split touching objects | Checked |
| Fill holes in masks | Checked |
| Min. object size | 5 µm |
| Max. object size | 100 µm |
| Include primary edge objects | Checked |
| Analyze entire image | Checked |
Table 2: Parameters used for imaging acquisition and data analysis. Suggested parameters to consider for imaging acquisition during the phagocytosis assay and for analysis of the acquired images are listed.
Discussion
The differentiation protocol described here provides an efficient method to obtain iPSC-derived microglia-like cells in ~6-8 weeks with high purity and in a sufficient yield to perform immunofluorescence experiments and other assays that require a higher number of cells. This protocol has yielded up to 1 × 10⁶ iMGs in 1 week, which allows for protein and RNA extraction and corresponding downstream analyses (e.g., RNASeq, qRT-PCR, western blot, mass spectrometry). That said, a limitation of this protocol is that the yield of iMGs may restrict certain applications. Additional modifications can be implemented to accumulate PMPs from different weeks and maintain a homogeneous culture in suspension until enough progenitors are collected to proceed with the differentiation process at once18. Alternatively, the differentiation of EBs can be scaled up by using higher area cell-culture plates to increase the production of PMPs.
It is advised to use iPSCs cultured in laminin 521-coated plates to initiate the differentiation process. Other coating reagents can reduce the number of PMPs produced later in the process18. Similarly, coating the plates for EB adhesion during PMP generation improves EB attachment, thus prolonging the life of the culture. EB culture has been maintained for up to 4 months, at which point, multiple EBs detach and die. However, other researchers report culturing EBs for up to 1 year12. In our hands, iMGs generated from 3-month-old EB cultures maintain similar functional properties as iMGs differentiated from young cultures; cultures older than 3 months have not been used for functional experimentation.
To optimize the final stage of microglia differentiation from the original protocols described above7,8, we included 100 ng/mL of interleukin (IL)-34,7 5 ng/mL of colony stimulation factor 1 (M-CSF)10, and 50 ng/mL of transforming growth factor-beta (TGF-β) in the iMG medium. IL-34 and M-CSF stimulate CSF1 receptor-dependent pathways that are crucial for maintaining microglia fate and survival8 while TGF-β supports microglia homeostasis9, thus promoting a more physiological environment for PMP commitment to microglia fate. Of note, the entire differentiation process described here is performed in serum-free conditions, which prevents possible effects of serum on iMG behavior and alterations in downstream applications. For functional experimentation with iMGs, it is recommended to conduct experiments between 10 and 12 days of terminal differentiation. iMGs have been cultured for up to 14 days with a modest reduction of cell viability, after which point, cell health is significantly compromised.
Since one of the canonical functions of microglia is phagocytosis, an assay to investigate phagocytic activity in vitro was included in this protocol. To develop a human-cell-based system, synaptosomes derived from human i3LMNs were used. The quality of the synaptosome preparation was assessed by western blot analysis of synaptic markers in this study. Additionally, other structural and functional properties of the synaptosome preparation can be investigated by electron microscopy or immunostaining before the phagocytosis assay. The protocol described here to obtain human synaptosomes heavily relies on i3LMNs, which yield a relatively high number of neurons. However, neuronal yields will likely be lower when using other differentiation methods (i.e., protocols requiring cocktails of small molecules). Notably, the phagocytosis assay can be performed with multiple other substrates such as mouse-brain derived synaptosomes, aggregated proteins, or dead cells, all of which can be labeled with pH-sensitive dyes to monitor phagocytosis in a similar manner. It is proposed to use pH-sensitive dyes because the fluorescent signal is mainly emitted when the synaptosomes are localized within acid compartments during phagosome processing and degradation in the lysosomes21. This property reduces the background signal from synaptosomes outside the cells and facilitates the use of automated methods of quantification. Additionally, pH-sensitive dyes allow for the detection of true phagocytosis events as opposed to substrate adherence or docking onto the cell membrane.
While herein it is suggested to use ~35 µg of synaptosomes per well, the specific amount of human synaptosomes and other substrates should be optimized, as optimal conditions depend on the iPSC line and the experimental conditions. An ideal range of synaptosomes should result in a dose-response in the phagocytosis assay. Too much synaptosomes can saturate the system, making it difficult to detect meaningful differences as a function of genotype or treatment group. Too little material will result in a weak output signal in the assay. For this reason, it is advised to test multiple concentrations of each substrate to establish a working assay. Additionally, it is important to maintain the % DMSO within a safe range to preserve cell health.
In this protocol, phagocytosis was monitored using a live-cell imaging system (Table of Materials) because it provides kinetic information about the engulfment capacity of the cells. Microscopes and imaging systems that can support live-cell imaging and maintain stable temperature, humidity and CO2 concentrations are also suitable for this assay. All the phagocytosis experiments described here were imaged at 37 °C with 85%-95% humidity and 5% CO2. Other detection methods such as imaging of fixed cells or flow cytometry can also be used to assess phagocytosis using the same materials and cell culture protocols (up to and including the generation of iMGs and labeled synptosomes) when live-cell imaging is not feasible or desired. Similarly, other open-source software can be utilized for data analysis such as ImageJ or CellProfiler; the latter will allow for an automated analysis comparable to the software used here.
In summary, implementation of a robust protocol to differentiate microglia-like cells from human iPSCs is illustrated, thus overcoming the limited resource of human microglia. Differentiated microglia can be used for a variety of applications in the study of neurodevelopmental and neurodegenerative diseases. Moreover, a fully "humanized" phagocytosis assay is included, which will further aid the study of microglia function and dysfunction in the context of human development and disease.
Disclosures
The authors have no conflicts of interest to declare.
Acknowledgements
The authors thank Michael Ward for providing the WTC11 hNIL iPSC line for motor neuron differentiation and the Jackson Laboratories for supplying the KOLF2.1J WT clone B03 iPSC line used for microglia differentiation. We also thank Dorothy Schafer for her support during the implementation of the protocols, Anthony Giampetruzzi and John Landers for their help with the live-cell imaging system as well as Hayden Gadd for his technical contributions during revisions and Jonathan Jung for his collaboration in this study. This work was supported by the Dan and Diane Riccio Fund for Neuroscience from UMASS Chan Medical School and the Angel Fund, Inc.
Materials
| Name | Company | Catalog Number | Comments |
|---|---|---|---|
| Antibodies for immunofluorescence analysis | |||
| anti-IBA1 rabbit antibody | Wako Chemical USA | NC9288364 | 1:350 dilution |
| anti-P2RY12 rabbit antibody | Sigma-Aldrich | HPA014518 | 1:50 dilution |
| anti-TMEM119 rabbit antibody | Sigma-Aldrich | HPA051870 | 1:100 dilution |
| Antibodies for Western blot analysis | |||
| anti-β-Tubulin rabbit antibody | Abcam | ab6046 | 1:500 dilution |
| anti-Synaptophysin (SYP) rabbit antibody | Abclonal | A6344 | 1:1,000 dilution |
| anti-PSD95 mouse antibody | Millipore | MAB1596 | 1:500 dilution |
| Borate buffer components | |||
| Boric acid (100 mM) | Sigma | B6768 | |
| Sodium bicarbonate (NaHCO3) BioXtra | Sigma-Aldrich | S6297-250G | |
| Sodium chloride (75 mM) | Sigma | S7653 | |
| Sodium tetraborate (25 mM) | Sigma | 221732 | |
| Cell culture materials | |||
| 6-well plates | Greiner Bio-One | 657160 | |
| 40 μm Cell Strainers | Falcon | 352340 | |
| 100 mm x 20 mm Tissue Culture Treated | CELLTREAT | 229620 | |
| Cell Lifter, Double End, Flat Blade & Narrow Blade, Sterile | CELLTREAT | 229305 | |
| low adherence round-bottom 96-well plate | Corning | 7007 | |
| Primaria 24-well Flat Bottom Surface Modified Multiwell Cell Culture Plate | Corning | 353847, | |
| Primaria 6-well Cell Clear Flat Bottom Surface-Modified Multiwell Culture Plate | Corning | 353846 | |
| Primaria 96-well Clear Flat Bottom Microplate | Corning | 353872 | |
| Cell dissociation reagents | |||
| Accutase | Corning | 25058CI | dissociation reagents used for lower motor neuron differentiation |
| TrypLE reagent | Life Technologies | 12-605-010 | dissociation reagents used for microglia differentiation |
| UltraPure 0.5 M EDTA, pH 8.0 | Invitrogen | 15575020 | |
| Coating reagents for cell culture | |||
| Matrigel GFR Membrane Matrix | Corning™ | 354230 | Referred as to extracellular matrix coating reagent |
| CellAdhere Laminin-521 | STEMCELL Technology | 77004 | Referred as to laminin 521 |
| Poly-D-Lysine | Sigma | P7405 | Reconstitute to 0.1 mg/mL in borate buffer |
| Poly-L-Ornithine | Sigma | P3655 | Reconstitute to 1 mg/mL in borate buffer |
| Components of iPSC media | |||
| mTeSR Plus Kit | STEMCELL Technology | 100-0276 | To prepare iPSC media mixed the components to 1x |
| Components of EB media | |||
| BMP-4 | Fisher Scientific | PHC9534 | final concentration 50 ng/mL |
| iPSC media | final concentration 1x | ||
| ROCK inhibitor Y27632 | Fisher Scientific | BD 562822 | final concentration 10 µM |
| SCF | PeproTech | 300-07 | final concentration 20 ng/mL |
| VEGF | PeproTech | 100-20A | final concentration 50 ng/mL |
| Components of PMP base media | |||
| GlutaMAX | Gibco | 35050061 | final concentration 1x |
| Penicillin-Streptomycin (10,000 U/mL) | Gibco | 15140122 | final concentration 100 U/mL |
| X-VIVO 15 | Lonza | 12001-988 | final concentration 1x |
| Components of PMP complete media | |||
| 55 mM 2-mercaptoethanol | Gibco | 21985023 | final concentration 55 µM |
| IL-3 | PeproTech | 200-03 | final concentration 25 ng/mL |
| M-CSF | PeproTech | 300-25 | final concentration 100 ng/mL |
| PMP base media | final concentration 1x | ||
| Components of iMG base media | |||
| Advanced DMEM/F12 | Gibco | 12634010 | final concentration 1x |
| GlutaMAX | Gibco | 35050061 | final concentration 1x |
| N2 supplement, 100x | Gibco | 17502-048 | final concentration 1x |
| Penicillin-Streptomycin (10,000 U/mL) | Gibco | 15140122 | final concentration 100 U/mL |
| Components of iMG complete media | |||
| 55 mM 2-mercaptoethanol | Gibco | 21985023 | final concentration 55 µM |
| IL-34 | PeproTech or Biologend | 200-34 or 577904 | final concentration 100 ng/mL |
| iMG base media | final concentration 1x | ||
| M-CSF | PeproTech | 300-25 | final concentration 5 ng/mL |
| TGF-β | PeproTech | 100-21 | final concentration 50 ng/mL |
| Components of Induction base media | |||
| DMEM/F12 with HEPES | Gibco | 11330032 | final concentration 1x |
| GlutaMAX | Gibco | 35050061 | final concentration 1x |
| N2 supplement, 100x | Gibco | 17502-048 | final concentration 1x |
| Non-essential amino acids (NEAA), 100x | Gibco | 11140050 | final concentration 1x |
| Components of Complete induction media | |||
| Compound E | Calbiochem | 565790 | final concentration 0.2 μM and reconstitute stock reagent to 2 mM in 1:1 ethanol and DMSO |
| Doxycycline | Sigma | D9891 | final concentration 2 μg/mL and reconstitute stock reagent to 2 mg/mL in DPBS |
| Induction base media | final concentration 1x | ||
| ROCK inhibitor Y27632 | Fisher Scientific | BD 562822 | final concentration 10 μM |
| Components of Neuron media | |||
| B-27 Plus Neuronal Culture System | Gibco | A3653401 | final concentration 1x for media and suplemment |
| GlutaMAX | Gibco | 35050061 | final concentration 1x |
| N2 supplement, 100x | Gibco | 17502-048 | final concentration 1x |
| Non-essential amino acids (NEAA), 100x | Gibco | 11140050 | final concentration 1x |
| iPSC lines used in this study | |||
| KOLF2.1J: WT clone B03 | The Jackson Laboratories | ||
| WTC11 hNIL | National Institute of Health | ||
| Synaptosome isolation reagents | |||
| BCA Protein Assay Kit | Thermo Scientific Pierce | 23227 | |
| dimethyl sulfoxide (DMSO) | Sigma | D2650 | |
| Syn-PER Synaptic Protein Extraction Reagent | Thermo Scientific | 87793 | Referred as to cell lysis reagent for isolation of synaptosomes |
| Phagocytosis assay dyes | |||
| NucBlue Live Ready reagent | Invitrogen | R37605 | |
| pHrodo Red, succinimidyl ester | ThermoFisher Scientific | P36600 | Referred as to pH-sensitive dye |
| Other cell-culture reagents | |||
| Trypan Blue, 0.4% Solution | AMRESCO INC | K940-100ML | |
| Bovine serum albumin (BSA) | Sigma | 22144-77-0 | |
| BrdU | Sigma | B9285 | Reconstitute to 40 mM in sterile water |
| Cytochalasin D | Sigma | final concentration 10 µM | |
| DPBS with Calcium and magnesium | Corning | 21-030-CV | |
| DPBS without calcium and magnesium | Corning | 21-031-CV | Referred as to DPBS |
| KnockOut DMEM/F-12 | Gibco | 12660012 | Referred as to DMEM-F12 optimized for growth of human embryonic and induced pluripotent stem cells |
| Laminin Mouse Protein, Natural | Gibco | 23017015 | Referred as to laminin |
| Software and Equipment | |||
| Centrifuge | Eppendorf | Model 5810R | |
| Cytation 5 live cell imaging reader | Biotek | ||
| Gen5 Microplate Reader and Imager Software | Biotek | version 3.03 | |
| Multi-Therm Heat-Shake | Benchmark | refer as tube shaker | |
| Water sonicator | Elma | Mode Transsonic 310 |
References
- Heider, J., Vogel, S., Volkmer, H., Breitmeyer, R. Human iPSC-derived glia as a tool for neuropsychiatric research and drug development. International Journal of Molecular Sciences. 22 (19), 10254(2021).
- Muzio, L., Viotti, A., Martino, G. Microglia in neuroinflammation and neurodegeneration: from understanding to therapy. Frontiers in Neuroscience. 15, 742065(2021).
- Galatro, T. F., et al. Transcriptomic analysis of purified human cortical microglia reveals age-associated changes. Nature Neuroscience. 20 (8), 1162-1171 (2017).
- Gosselin, D., et al. An environment-dependent transcriptional network specifies human microglia identity. Science. 356 (6344), (2017).
- Haimon, Z., et al. Re-evaluating microglia expression profiles using RiboTag and cell isolation strategies. Nature Immunology. 19 (6), 636-644 (2018).
- Abud, E. M., et al. iPSC-derived human microglia-like cells to study neurological diseases. Neuron. 94 (2), 278-293 (2017).
- Brownjohn, P. W., et al. Functional studies of missense TREM2 mutations in human stem cell-derived microglia. Stem Cell Reports. 10 (4), 1294-1307 (2018).
- Haenseler, W., et al. A highly efficient human pluripotent stem cell microglia model displays a neuronal-co-culture-specific expression profile and inflammatory response. Stem Cell Reports. 8 (6), 1727-1742 (2017).
- McQuade, A., et al. Development and validation of a simplified method to generate human microglia from pluripotent stem cells. Molecular Neurodegeneration. 13 (1), 1-13 (2018).
- Muffat, J., et al. Efficient derivation of microglia-like cells from human pluripotent stem cells. Nature Medicine. 22 (11), 1358-1367 (2016).
- Haenseler, W., Rajendran, L. Concise review: modeling neurodegenerative diseases with human pluripotent stem cell-derived microglia. Stem Cells. 37 (6), 724-730 (2019).
- Wilgenburg, B. v, Browne, C., Vowles, J., Cowley, S. A. Efficient, long term production of monocyte-derived macrophages from human pluripotent stem cells under partly-defined and fully-defined conditions. PloS One. 8 (8), 71098(2013).
- Hoeffel, G., Ginhoux, F. Ontogeny of tissue-resident macrophages. Frontiers in Immunology. 6, 486(2015).
- Janda, E., Boi, L., Carta, A. R. Microglial phagocytosis and its regulation: a therapeutic target in Parkinson's disease. Frontiers in Molecular Neuroscience. 11, 144(2018).
- Schafer, D. P., Stevens, B. Microglia function in central nervous system development and plasticity. Cold Spring Harbor Perspectives in Biology. 7 (10), 020545(2015).
- Nau, R., Ribes, S., Djukic, M., Eiffert, H. Strategies to increase the activity of microglia as efficient protectors of the brain against infections. Frontiers in Cellular Neuroscience. 8, 138(2014).
- Fernandopulle, M. S., et al. Transcription factor-mediated differentiation of human iPSCs into neurons. Current Protocols in Cell Biology. 79 (1), 51(2018).
- Gutbier, S., et al. Large-scale production of human IPSC-derived macrophages for drug screening. International Journal of Molecular Sciences. 21 (13), 4808(2020).
- Sellgren, C., et al. Patient-specific models of microglia-mediated engulfment of synapses and neural progenitors. Molecular Psychiatry. 22 (2), 170-177 (2017).
- Schmidt, E. J., et al. ALS-linked PFN1 variants exhibit loss and gain of functions in the context of formin-induced actin polymerization. Proceedings of the National Academy of Sciences of the United States of America. 118 (23), (2021).
- Miksa, M., Komura, H., Wu, R., Shah, K. G., Wang, P. A novel method to determine the engulfment of apoptotic cells by macrophages using pHrodo succinimidyl ester. Journal of Immunological Methods. 342 (1-2), 71-77 (2009).
Reprints and Permissions
