A subscription to JoVE is required to view this content.  Sign in or start your free trial.
Magnetic Activated Cell Sorting (MACS): Isolation of Thymic T Lymphocytes
  • 00:03Concepts
  • 02:33Preparation of Materials and Dissection
  • 03:39Immune Cell Isolation
  • 05:22Magnetic Labeling of Immune Cells
  • 06:59Magnetic Separation of CD3-Positive Cells
  • 07:48Evaluation of Target-Cell Enrichment by Flow Cytometry
  • 09:00Data Analysis

Tri cellulaire magnétique (MACS) : isolement des lymphocytes T thymiques

English

Share

Overview

Source: Meunier Sylvain1,2,3, Perchet Thibaut1,2,3, Sophie Novault4, Rachel Golub1,2,3
1 Unité de lymphopoiesis, Département d’immunologie, Institut Pasteur, Paris, France
2 INSERM U1223, Paris, France
3 Université Paris Diderot, Sorbonne Paris Cité, Cellule Pasteur, Paris, France
4 Flow Cytometry Platfrom, Cytometry and Biomarkers UtechS, Center for Translational Science, Institut Pasteur, Paris, France

La défense contre les agents pathogènes dépend de la surveillance par le système immunitaire. Ce système est complexe et comprend de nombreux types de cellules, chacune ayant des fonctions spécifiques. Cette composition complexe permet des réponses immunitaires à une grande diversité d’agents pathogènes et de blessures. L’immunité adaptative permet des réponses spécifiques contre des agents pathogènes spécifiques. La majorité des cellules responsables de ce type d’immunité sont les lymphocytes (cellules B et lymphocytes T). Habituellement, les cellules B réagissent aux infections extracellulaires (comme les infections bactériennes), et les lymphocytes T réagissent aux infections intracellulaires (comme les infections virales). Les différents types de cellules dans les populations de lymphocytes peuvent être caractérisés par la combinaison de protéines de surface cellulaire qu’ils expriment et / ou par un panneau de cytokines sécrétées.

Le tri magnétique permet l’enrichissement des populations cellulaires ciblées à l’aide de propriétés magnétiques et l’expression d’une ou plusieurs protéines de surface cellulaire (1, 2). Cette technique se compose de trois étapes. Tout d’abord, les cellules sont incubées avec des perles magnétiques qui sont couplées avec un ou plusieurs anticorps monoclonaux spécifiques. Les cellules qui expriment les protéines de surface qui se lient à ces anticorps se fixent aux perles magnétiques. Ensuite, les populations cellulaires ciblées sont capturées avec un aimant. Pour finir, les cellules ciblées sont élifiées de l’aimant. À la fin, deux produits de tri sont obtenus, l’un contenant des cellules non étiquetées et l’autre contenant les cellules cibles couplées avec les perles magnétiques. Les colonnes peuvent être utilisées pour améliorer l’efficacité du tri magnétique. Dans la colonne, un élément non magnétique allonge le chemin de la cellule à travers la colonne. Par conséquent, le flux cellulaire est ralenti, facilitant la capture cellulaire par l’aimant.

Figure 1
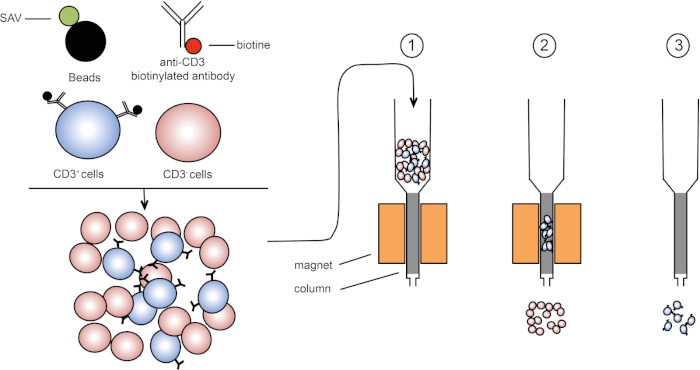
Figure 1 : Représentation schématique de la séparation magnétique. Les leucocytes thymiques sont tachés d’anticorps biotinylated anti-CD3. Après le lavage, les perles couplées de streptavidin (SAV) fixent spécifiquement la biotine sur des anticorps anti-CD3. (1) Les cellules sont transférées dans une colonne. (2) L’aimant ne retient pas les cellules non étiquetées, tandis que les cellules CD3-positives restent dans la colonne. Enfin, la colonne est séparée de l’aimant et (3) les cellules CD3-positives sont élucées dans le milieu. Veuillez cliquer ici pour voir une version plus grande de ce chiffre.

Il existe deux types de tri magnétique (3). Dans le tri positif, les cellules d’intérêt sont capturées avec les perles magnétiques. Dans le tri négatif, les cellules indésirables sont enlevées en capturant avec les perles magnétiques portant les anticorps appropriés. Cette technique MACS permet un bon enrichissement des cellules ciblées et améliore le pourcentage de cellules récupérées de 1-20% à 60-98% dans un organe. Après le tri, il est nécessaire de vérifier la pureté et le tri des cellules par différentes méthodes (par exemple, cytométrie du débit). La technique MACS est idéale pour enrichir une population cible pour d’autres expériences telles que la culture cellulaire ou l’analyse du cycle cellulaire.

Dans cet exercice de laboratoire, nous démontrons comment isoler les leucocytes thymiques et par la suite enrichir les cellules thymiques CD3-positives du mélange en utilisant la technique de tri de cellules magnétiques.

Procedure

1. Préparation Avant de commencer, enfilez des gants de laboratoire et des vêtements de protection appropriés. Laver tous les outils de dissection, d’abord avec un détergent, puis avec 70% d’éthanol, puis les sécher avec un essuie-tout propre. Préparer 200 ml de solution de sel équilibrée de Hank (HBSS) contenant 2 % de sérum fœtal de veau (FCS). 2. Dissection Épingler une souris euthanasiée sur une pl…

Results

In this protocol, CD3-positive cells were enriched from thymic leukocytes using magnetic cell sorting (Figure 1). Before magnetic cell enrichment CD3-positive cells represented 53.6% of the total thymic cells (Figure 2, top panels). After magnetic cell enrichment the percentage of CD3-positive cells increased to 95% (Figure 2, bottom panels). Thus, MACS is a simple, fast and efficient cell enrichment technique to enrich desired cell populations from a cell suspension mixture.

Figure 2
Figure 2: Gating strategy and purity test sorting. Cells are first gated based on their morphology (left: FSC-A, SSC-A), and then cells are plotted against CD3 (right: CD3, SSC-A). Top panel represents thymus cell suspension before cell enrichment. Bottom panel represents thymus cell suspension after magnetic cell sorting. Please click here to view a larger version of this figure.

Applications and Summary

Magnetic separation technology is a common method to easily and rapidly sort a target cell population. Using T cells specific antibodies and magnetic beads we enriched T cells frequency in our sample. The purity rate at the end of the experiment depends of the percentage of target cells in the initial cell suspension. Cells obtained after magnetic cell sorting can be used for various purposes such as- cell transfer or cell cycle analysis. Another sorting method, using flow cytometry, can be used to enrich cells. This technique yields have a very high purity rate after cell sorting however it requires more steps and takes more time.

References

  1. Owen, C. S. and Sykes, N. L. Magnetic labeling and cell sorting. Journal of Immunological Methods. 73 (1), 41-48 (1984).
  2. Miltenyi, S., Müller, W., Weichel, W. and Radbruch, A. High gradient magnetic cell separation with MACS. Cytometry. 11 (2), 231-238 (1990).
  3. Plouffe, B. D., Murthy, S. K. and Lewis, L. H. Fundamentals and application of magnetic particles in cell isolation and enrichment: a review. Reports on Progress in Physics. 78 (1), (2014).

Transcript

Magnetic-activated cell sorting, or MACS, is a technique that allows researchers to separate cells based on specific epitopes expressed on their surfaces.

The process typically begins with extraction of an organ or tissue, such as the thymus. Then, the cells are mechanically separated, usually by crushing, until the tissue is dissociated into single cells. Unwanted cells can be removed at this stage via the addition of chemicals. For example, ammonium-chloride-potassium, or ACK buffer, can be used to lyse unwanted erythrocytes.

Next, an antibody conjugated to a molecule called biotin is added to the suspension, and these complexes bind to the epitopes of the surface of the target cells. Biotin has a high affinity for another molecule called streptavidin. In the next step, streptavidin molecules fused to magnetic beads are added to the antibody labeled cells. When the biotin and streptavidin come into contact, they tightly bind. The result is that the cells of interest are coated with magnetic beads. This complex is sometimes referred to as a sandwich. In this case, CD3 on the cell membrane on the bottom, then anti-CD3 conjugated to biotin, and finally, streptavidin conjugated to magnetic beads.

These labeled cells can now be placed into a column containing a matrix which, assisted by gravity, allows the cells to pass slowly by a magnet. As they do so, the magnetic bead-labeled cells will stick to the edge of the tube nearest the magnet, while the non-labeled cells will continue on into a collection tube below. Next, the labeled cells can be removed from the column by simply removing the magnet, adding an eluent solution, and applying gentle pressure with a plunger to flush them out of the column and into a fresh collection tube. Ultimately, this process allows for 60 to 98% retrieval of the cells of interest.

In this procedure, we will isolate thymic leukocytes from a mouse and use MACS to sort out CD3-positive T-cells before confirming the efficiency of sorting using FACS.

To begin, put on any appropriate protective equipment including a lab coat and gloves. Next, wash a pair of dissecting scissors and forceps with 70% ethanol and dry them with a clean paper towel. Then prepare 200 milliliters of HBSS 2% fetal calf serum, or FCS, by mixing four milliliters of FCS with 196 milliliters of HBSS.

Pin a euthanized mouse in a supine position on a dissection plate. Using scissors and forceps, perform a longitudinal laparotomy to access the chest cavity. First, remove the heart to gain access to the thymus, which is located above the heart. Then identify the thymus, which is composed of two white lobes. Using forceps, carefully detach the thymus and place it on a Petri dish with five milliliters of HBSS 2% FCS.

To isolate the immune cells, first place the thymus on a 40 micrometer cell strainer in the Petri dish. Crush the tissue with a plunger to dissociate it into the dish. After this, rinse the plunger and strainer with HBSS 2% FCS to recover any adhered cells. Then, pipette the dissociated thymus cells and fluid from the Petri dish into a 15 milliliter centrifuge tube. Wash the Petri dish with five milliliters of HBSS 2% FCS and transfer this wash solution to the 15 milliliter centrifuge tube also.

Next, centrifuge the tube at 370 times g for seven minutes at 20 degrees Celsius. Discard the supernatant and resuspend the pellet in two milliliters of ACK lysing buffer to lyse the erythrocytes. Incubate for two minutes at room temperature on the bench top. Then, bring the volume to 14 milliliters with HBSS 2% FCS. Centrifuge the tube at 370 times g for seven minutes at 20 degrees Celsius. Then, discard the supernatant and resuspend the cells in five milliliters of HBSS 2% FCS.

Estimate the cell concentration using a Malassez slide as shown in the protocol for FACS isolation of B lymphocytes and adjust the cell concentration to 10 to the seventh cells per milliliter with HBSS 2% FCS.

Transfer 500 microliters of cell solution into two FACS tubes. Label one tube non-enriched T-cells and the other tube enriched T-cells, which will be separated using magnetic labeling.

Centrifuge the enriched T-cells tube at 370 times g for three minutes at 20 degrees Celsius. Discard the supernatant and resuspend the pellet in 250 microliters of biotin coupled anti CD3 antibody diluted one in 400 in HBSS 2% FCS. Incubate the cells for 20 minutes on ice and in the dark. Add three milliliters of HBSS 2% FCS to the tubes and centrifuge them again at 370 times g for three minutes at 20 degrees Celsius. Discard the supernatant and resuspend the pellet in 250 microliters of streptavidin-coupled beads diluted one in five in HBSS 2% FCS. Incubate the mixture of cells and beads for 20 minutes on ice. Next, add three milliliters of HBSS 2% FCS to the tube, pipette up and down to mix, and centrifuge again at 370 times g for three minutes at 20 degrees Celsius. Resuspend the pellet in two milliliters of HBSS 2% FCS.

Place the column on the magnet and add three milliliters of HBSS 2% FCS to humidify the system. Then, pipette the stained cells into the column. After the cell suspension passes through the column, wash the column three times with three milliliters of HBSS 2% FCS. Next, remove the column from the magnet and place it in a 15 milliliter tube. To elute the target cells, add five milliliters of HBSS 2% FCS to the column and flush the column with a plunger. Repeat this step with another five milliliters of HBSS 2% FCS.

To evaluate the effectiveness of target cell isolation, first transfer 500 microliters of eluted cell suspension to a FACS tube and label it enriched T-cells. Then, centrifuge both the enriched and non-enriched tubes at 370 times g for seven minutes at 20 degrees Celsius. Discard the supernatant, then add 100 microliters of fluorescent antibody diluted one in 200 in HBSS 2% FCS to both tubes. Incubate the cells for 20 minutes on ice and in the dark. Next, add three milliliters of HBSS 2% FCS to the tubes and centrifuge them at 370 times g for three minutes at 20 degrees Celsius. Discard the supernatant, then resuspend the pellets in 250 microliters of HBSS 2% FCS. Now, evaluate the CD3-positive cell enrichment rate using flow cytometry as shown in the FACS protocol.

Now, we will determine the frequency of CD3-positive lymphocytes among all thymocytes that were isolated from the mouse thymus. To start, double click on the FlowJo icon and drag the files for each tube in the all sample window. Then, double click on the enriched T-cells file to display the cells recorded from that sample on a dot plot that displays forward scatter, FSCA, on the x-axis, and side scatter, SSCA, on the y-axis.

Click on polygon to circle the lymphocyte populations. Next, double click on the circled population to create a new window. Select FSC-W on the y-axis, and FSC-A on the x-axis and circle the FSA-W negative cells. In the sub population identification window, name your cell population Single Cells. Next, click on OK on the sub population identification window, then double click on the circled population to create a new window. Select CD3 on the y-axis, and circle the CD3-positive cells. In the sub population identification window, name your cell population T-cells. Repeat with the non-enriched T-cells file. To visualize your cell population, click Layout Editor and drag the T-cell population from enriched T-cells and non-enriched T-cells files into the tab.

Dot plots representing CD3-positive lymphocytes will appear. CD3-positive cells should only appear in the population of interest in the CD3-positive enriched tube. To evaluate the enrichment of CD3-positive lymphocytes in the sorted cells, click on Table Editor and then drag the T-cells population from enriched T-cells and non-enriched T-cells files into the table. On the statistic menu, select Frequency of Lymphocyte Cells to check the percentage of CD3-positive cells in all lymphocytes. Then, click on Create Table. Parameter values will appear in a new table. For the enriched T-cells, the frequency of CD3-positive cells should be around 80% or above.

Tags

Cite This
JoVE Science Education Database. JoVE Science Education. Magnetic Activated Cell Sorting (MACS): Isolation of Thymic T Lymphocytes. JoVE, Cambridge, MA, (2023).